Journal of
eISSN: 2473-0831


Research Article Volume 7 Issue 2
Correspondence: Ahmed A Almrasy, Department of Pharmaceutical Analytical Chemistry, Faculty of Pharmacy, Al-Azhar University, 11751 Nasr City, Cairo, Egypt, Tel 2.01019E+11
Received: February 24, 2018 | Published: April 3, 2018
Citation: El-Abasawy NM, Attia KAM, Abo-serie AA, et al. Application of TLC densitometric method for simultaneous estimation of binary mixture of phenazopyridine hydrochloride and trimethoprim in their tablet dosage form. J Anal Pharm Res. 2018;7(2):167?170. DOI: 10.15406/japlr.2018.07.00219
In the present work; an accurate and precise TLC densitometric method has been developed for simultaneous determination of PHZ and TMP in their bulk and dosage form. The proposed method based on determination of the UV-visualized bands after TLC separation of PHZ and TMP. The studied drugs were quantitatively separated on 60 F254 silica gel plates using mobile phase consists of methanol: toluene: ethyl acetate (1:1:1, by volume)) with UV detection at 228nm over a concentration range of (0.5–6) and (1-10)μg/spot with mean percentage recoveries 99.66±0.984 and 99.72±1.232 for PHZ and TMP, respectively. The proposed method has been validated according to ICH guidelines. The validity of the proposed method was further evaluated by applying standard addition technique. The obtained results were statistically compared with the reported method, showing no significant difference with respect to accuracy and precision.
Keywords: phenazopyridine hydrochloride, trimethoprim, TLC, pharmaceutical analysis
Phenazopyridine hydrochloride (PHZ), [2, 6-diamino-3-(phenylazo) pyridine hydrochloride] Figure 1A exerts an analgesic effect on the mucosa of the urinary tract and provides symptomatic relief of pain in conditions such as cystitis and urethritis. It is given in conjunction with an antibacterial agent for the treatment of urinary tract infections.1 Trimethoprim (TMP), [5-(3,4,5-Trimethoxybenzyl)pyrimidine-2,4-diamine] Figure 1B exerts antibacterial effect that is used for the treatment of infections due to sensitive organisms, including gastro-enteritis and respiratory tract infections, and in particular for the treatment and prophylaxis of urinary tract infections.1
Few spectrophotometric2 and chromatographic3 methods have been reported for the determination of a mixture of PHZ and TMP while, multivariate spectrophotometric4 and electrochemical5 methods were used in combination with sulphamethoxazole in pharmaceutical dosage form. The aim of the present work was to develop simple, rapid, sensitive and selective TLC densitometric6,7 method for the determination of binary mixture of PHZ and TMP in pharmaceutical formulation.
Instruments
Pure standard
Standard PHZ (certified to contain 99.94%) and TMP (certified to contain 99.91%) were kindly supplied by kahira for pharmaceuticals, Cairo, Egypt.
Pharmaceutical preparation
Carmurit-T® tablets: (batch number 314467) each tablet is claimed to contain 25mg phenazopyridine hydrochloride and 100mg trimethoprim, manufactured by Memphis company for pharmaceuticals and chemical industries, purchased from local market.
Reagents and solvents
Methanol, acetonitrile, ethyl acetate and toluene, all of analytical grade, (Sigma-Aldrich, Germany).
Standard solutions
A standard solutions of (1mg/ml) was prepared by dissolving 0.1g of PHZ and TMP in 50ml methanol and complete to 100ml with the same solvent.
Construction of calibration curves
Into two separate series of 10 ml volumetric flasks, aliquots of standard solutions equivalent to (0.5-6mg) and (1-10mg) of PHZ and TMP respectively, were transferred separately and diluted to volume with methanol. So the series of flasks contain (50-600)µg/ml and (100-1000) µg/ml of each solution were applied to a TLC plate using Camag Linomat auto sampler with micro syringe (100μl). The plate was then developed by the ascending technique using methanol: toluene: ethyl acetate (1:1:1, by volume) as a mobile phase. The plate was then removed and air-dried. The chromatograms were scanned at 228nm. Calibration curves representing the relationship between integrated peak area and the corresponding concentrations of each drug were plotted.
Application to pharmaceutical formulation
Ten Carmurit-T® tablets were grinded to a fine powder with the help of mortar and pestle. An amount of the powder equivalent to 25mg PHZ and 100mg trimethoprim was transferred into 100-ml volumetric flask, dissolved in methanol, shaken for about 10 minutes and filtered through filter paper to obtain a solution labeled to contain (0.25mg/ml) of PHZ and (1mg/ml) of TMP. Transfer 4 ml into 10-ml volumetric flask then complete to volume with methanol to obtain a solution labeled to contain (100µg/ml) of PHZ and (400µg/ml) of TMP. The proposed method was applied for the determination of the pharmaceutical preparation solution using the procedure described above under the construction of the calibration curve. The cited drugs concentrations were calculated from the corresponding regression equations.
Reported method2
The reported method depends on direct spectrophotometric determination of PHZ at 429nm while TMP was determined by first derivative spectrophotometry and measuring the amplitude at 241nm.
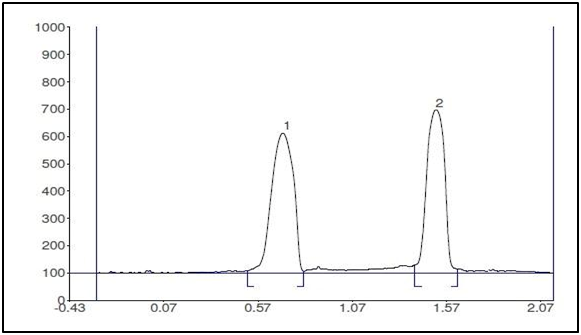
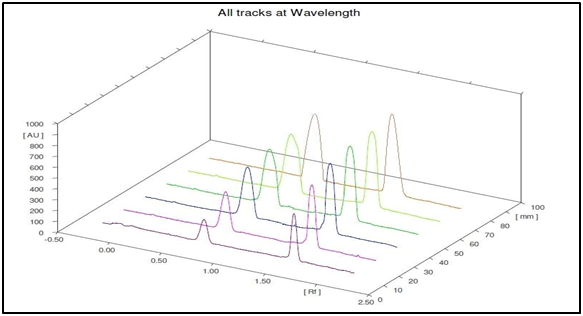
This study is concerned with the simultaneous determination of PHZ and TMP using TLC densitometric method. Various systems were tried, where complete separation of PHZ and TMP was achieved using methanol: toluene: ethyl acetate (1:1:1, by volume) as the mobile phase. The Rf values were 0.68 for TMP and 1.49 for PHZ as shown in Figures 2 & 3.

Figure 2 Two-dimensional densitometric chromatogram of (1) TMP (6µg/spot) and (2) PHZ (4µg/spot) at 228nm.

Figure 3 Three-dimensional densitometric chromatogram of TMP (1–10µg/spot) and PHZ (0.5–6µg/spot) at 228nm.
Method validation
Method validation was performed according to the International Conference on Harmonization (ICH) guideline7 for the proposed method as follows:
Linearity and range
TLC-Densitometric technique permits selective determination of PHZ and TMP in the range of 0.5–6 and 1–10μg/spot, respectively. The linear regression equations were calculated and found to be:
y=4605.73 x- 66.22 (r=0.9996) for PHZ at 228nm.
y=3099.62 x-206.19 (r=0.9997) for TMP at 228nm.
Where y is the peak area at 228 nm, x is the drug concentration in µg/spot and r is the correlation coefficient.
Calibration graphs were constructed by plotting the area under peak versus drug concentrations.
Limits of detection and quantitation
The limits of detection (LOD) and the limits of quantitation (LOQ) were determined according to ICH guidelines from the following equations:
LOD=3.3σ/S LOQ=10σ/S
Where σ is the residual standard deviation of the regression line and S is the slope of the calibration curve. LOD and LOQ values were mentioned in Table 1.
Accuracy
The accuracy of the proposed method was calculated by the average of three determinations for three concentrations for TMP or PHZ repeated three times as mentioned in Table 1.
Parameters |
PHZ |
TMP |
Wavelength (nm) |
228 |
228 |
Linearity range |
0.5-6(μg/spot) |
1-10(μg/spot) |
LOD |
0.153(μg/spot) |
0.225(μg/spot) |
LOQ |
0.465(μg/spot) |
0.684(μg/spot) |
- Regression Equation |
y a = b x b + a |
y a = b x b + a |
- Slope (b) |
4605.73 |
3099.62 |
- Intercept (a) |
-66.22 |
-206.19 |
Correlation coefficient (r) |
0.9996 |
0.9997 |
Accuracy (% R) |
99.66 |
99.72 |
Precision (% RSD) |
|
|
Repeatabilityc |
0.988 |
1.236 |
Intermediate precisiond |
1.191 |
1.417 |
Robustness (% RSD) |
|
|
- Mobile phase contents ratio (±2%) |
1.413 |
1.655 |
Table 1 Regression parameters and results of determination of pure samples of PHZ and TMP by the proposed method
a Peak area.
b Concentration in mg/spot.
c The intraday (n=3), Average of three determinations for three concentrations (2, 4 and 6µg/spot), for PHZ and TMP repeated three times within the day.
d The interday (n=3), Average of three determinations for three concentrations (2, 4 and 6µg/spot), for PHZ and TMP repeated three times in three days.
Precision
The Precision was evaluated by calculating intraday (repeatability) and interday (Intermediate precision) after repeating measuring of the three different concentrations three times in the same day and in three successive days using the proposed method. The calculated RSD% values were listed as mentioned in Table 1 indicating acceptable precision of the proposed method.
Robustness
The robustness of the method was evaluated by slight changes in the chromatographic parameters such as working wavelengths (±2nm) and the mobile phase contents ratio (±2%). In each case only one parameter was changed while other parameters were kept constant. These minor changes did not have any significant effect on the peak area or separation of both drugs and % RSD of the responses were <2% confirming robustness of the procedure, as mentioned in Table 1. The validity of the proposed procedures was assessed by applying the standard addition technique showing no excipients interference as mentioned in Table 2. The results obtained by applying the proposed method were statistically compared with the reported method2 and no significant difference was found regarding accuracy and precision as mentioned in Table 3.
PHZ |
TMP |
||||||||
Taken |
Found |
Pure added (μg/ml) |
Pure found (µg/ml) |
% Recovery |
Taken |
Found |
Pure added |
Pure found |
% Recovery |
1 |
1.01 |
1 |
0.98 |
98.82 |
2 |
1.99 |
2 |
2.03 |
101.73 |
2 |
2.03 |
101.75 |
3 |
3.01 |
100.13 |
||||
3 |
2.98 |
99.48 |
4 |
3.92 |
98.01 |
||||
4 |
4.07 |
101.72 |
15 |
4.93 |
98.64 |
||||
Mean |
|
100.44 |
|
99.63 |
|||||
% RSD |
|
1.511 |
|
1.668 |
|||||
Table 2 Recovery study of the studied drugs by adopting standard addition technique using the proposed method
Parameters |
TLC method |
Reported method*2 |
||
PHZ |
TMP |
PHZ |
TMP |
|
Number of measurements |
5 |
5 |
5 |
5 |
Mean |
100.28 |
100.40 |
100.33 |
99.77 |
SD |
1.586 |
1.677 |
0.874 |
1.172 |
Variance |
2.516 |
2.812 |
0.764 |
1.374 |
Student- t-test* |
0.059(2.306) |
0.684(2.306) |
—— |
—— |
F-value* |
3.291(6.388) |
2.047(6.388) |
—— |
—— |
Table 3 Statistical comparison for the results obtained by the proposed and the reported methods for the analysis of PHZ and TMP in Carmurit-T® tablets
*The values in the parenthesis are the corresponding theoretical values of t and F at (P = 0.05).
In this study; sensitive and selective TLC-densitometric procedure for the simultaneous determination of PHZ and TMP in their pure form and in their pharmaceutical preparation has been developed and validated. The developed method is time saving where many bands can be run at the same time. This method is also economic since a small quantity of mobile phase as a developing system was used unlike HPLC procedures. Finally we can conclude that the described TLC-densitometric procedure can be used in routine analysis of PHZ and TMP in their pure forms and pharmaceutical dosage form without previous separation.
Authors are deeply thankful to ALLAH, the Almighty, by the grace of whom this work was realized. Deep gratitude and appreciation to pharmaceutical analytical chemistry department, faculty of pharmacy Al Azhar University, for providing facilities and continuous support.
The author declares that there is no conflict of interest.

©2018 El-Abasawy, et al. This is an open access article distributed under the terms of the, which permits unrestricted use, distribution, and build upon your work non-commercially.