Journal of
eISSN: 2473-0831


Research Article Volume 4 Issue 6
Correspondence: Ahmed Mostafa, Department of Pharmaceutical Chemistry, College of Clinical Pharmacy, University of Dammam, King Faisal Road, Eastern Province, Dammam, P.O. Box 1982, Dammam 31441, Kingdom of Saudi Arabia, Tel +966 562623776
Received: February 20, 2017 | Published: May 29, 2017
Citation: Mostafa A, El-Gindy A, Emara S (2017) Simultaneous Spectrophotometric Estimation of Bisoprolol Fumarate and Hydrochlorothiazide in Tablet Formulation using Partial Least-Squares, Principal Component Regression Multivariate Calibrations and RP-HPLC Methods. J Anal Pharm Res 4(6): 00124. DOI: 10.15406/japlr.2017.04.00124
The UV spectrophotometric analysis of a binary mixture containing bisoprolol fumarate (BS) and hydrochlorothiazide (HZ) by using multivariate calibration methods, such as principal component regression (PCR) and partial least–squares regression (PLS–1); and a graphical spectrophotometric method such as second derivative of the ratio spectra 2DD was described. A calibration set of 22 reference samples was used to develop the models for PCR and PLS–1. The calibration models optimization was achieved through the proper wavelength ranges selection, and excluding any information about the interfering excipients. In addition, a High Performance Liquid Chromatography (HPLC) was developed to analyze the same mixture. The chromatographic separation was achieved on a reversed phase, RP 18 column with mobile phase consisting of acetonitrile–0.01 M KH2PO4 (40:60, v/v, and pH 3.5). Quantitation was achieved with UV detection at 232 nm based on peak area. The proposed methods were validated and successfully used for the analysis of laboratory–prepared mixtures and pharmaceutical formulations.
Keywords: bisoprolol fumarate, hydrchlorothiazide, hplc, chemometrics, second derivative of the ratio spectra.
BS: Bisoprolol Fumarate; HZ: Hydrochlorothiazide; PCR: Principal Component Regression; PLS: Partial Least–Squares Regression; HPLC: High Performance Liquid Chromatography; ALS: Alternating Least Squares; UPLC: Ultra Pressure Liquid Chromatography
Bisoprolol fumarate (BS) is a cardioselective b–blocker used in management of hypertension and angina pectoris.1 It is dispensed with hydrochlorothiazide (HZ). They are formulated in the form of tablets used in treatment of arterial hypertension. This work presents PLS–1, PCR, HPLC and2 DD methods for determination of BS as a weakly absorbing component in a combination containing HZ as a strongly absorbing component. Moreover, BS is formulated at a lower concentration than HZ. Therefore the strongly absorbing component HZ interferes seriously in the absorption spectra of the other component. Therefore, their simultaneous determination is hard by using conventional spectrophotometric techniques. Several methods have been reported for the analysis of BS or HZ alone or in combination with other drugs.2–15 and in their binary mixture using HPLC.16–23 Both BS and HZ are official in The United States Pharmacopeia.24 and British Pharmacopeia.25
UV–Vis – spectrophotometry is a well established technique for the green fast and direct determination of analytes without prior separation. The main problem that might arise is the highly overlapped spectra as the case with the analytes of most pharmaceutical formulations. Ratio spectra have been used to eliminate such interference between different analytes. It was first developed by Blanco et al.26 However in case of strong spectral overlap, ratio spectra might not work properly. Multivariate calibration such as partial least squares may be the method of choice to solve this strong spectral overlap. Such methods have been reported to be a valid alternative to HPLC for the analysis of different analytes in pharmaceutical preparations.27 PCR and PLS are multivariate regression methods which allow to establish a relationship between matrices of chemical data.28 The basic concept of PLS regression was originally developed by Wold.29 Readers interested in more mathematical principles of the PLS algorithms are encouraged to refer to the book by Vinzi et al.30
PCR compresses two steps; component analysis step that is followed by a regression step. Spectral decomposition is performed in both PLS and PCR but in different ways. In PCR, the spectral decomposition is based mainly on the variance of spectral data only, however in PLS, spectral data and concentration data are used in model development.31 The application of such techniques on spectral data may allow the development of green, fast, simple, specific and sensitive methods for determination of BS and HZ in pharmaceutical tablets.
Several chemometric–assisted spectrophotometric methods for the determination of HZ or BS with different drugs have been published.32–35 Multivariate curve resolution in combination with alternating least squares (MCR–ALS) has been used to study the dissolution profile of BS and HZ in binary mixture in tablets.36 To the best of our knowledge, PLS and PCR have not been used for the simultaneous determination of BS and HZ. The aim of this work is to develop and validate multivariate calibration models able to quantify two components mixture of BS as relatively weakly absorbing component, formulated at a lower concentration and HZ as a strongly absorbing component. Validation of the methods was performed using internal, cross and external validation. The methods were eventually applied to commercial tablets, without any preliminary separation steps.
In addition, HPLC and 2DD methods were developed for the assay of the components of the studied mixture. The proposed methods are simple, sensitive, reduced the duration of the analysis, precise and suitable for routine determination of the titled components in pharmaceutical dosage forms. The proposed HPLC method uses RP 18 column, which is available in many laboratories. However some of the published HPLC methods used cyano column.18 and/or ultra pressure liquid Chromatography (UPLC).21 which might not be available at some laboratories.
Instrumentation
Shimadzu double – beam (Japan) UV– Visible spectrophotometer, model UV– 1601 PC and connected to an IBM compatible computer was used. UVPC personal spectroscopy software version 3.7 (Shimadzu) was used. The spectral bandwidth was 2nm and the wavelength scanning speed was 2800nm min–1. PLS–Toolbox software version 2.1–PC for use with MATLAB 5 was used for PLS–1 and PCR analysis.
Shimadzu HPLC ( Kyoto, Japan) instrument was equipped with a model series LC–10 ADVP pump, SCL–10 AVP system controller, DGU–12 A degasser, Rheodyne 7725i injector with a 20µl loop and a SPD–10 AVP UV–VIS detector, analysis was made on a 250×4.6mm (i.d.) Shim–pack RP18 column (5µm particle size), at λ 232nm. Data acquisition was performed on class–VP software.
Materials and reagents
Pure BS and HZ were used and certified to contain 99.8 and 99.9%, respectively. HPLC grade acetonitrile and methanol used were (BDH, Poole, UK). Potassium dihydrogen phosphate, hydrochloric and phosphoric acids were analytical grade. Concor plus® tablets (AMOUN, EL–Obour City, Cairo, Egypt) labeled to contain 5mg BS and 12.5mg HZ were used.
HPLC conditions
The elution was carried out with mobile phase consisting of acetonitrile and 0.01M KH2PO4 in a ratio of 40:60v/v. The apparent pH was adjusted to 3.5. The flow rate was 1mL min–1. The injection volume was 20µl at ambient temperature.
Standard solutions and calibration
PLS–1 and PCR methods
A calibration matrix of 22 synthetic mixtures with different concentrations of each component was prepared in 0.1M hydrochloric acid in rang of 1–7µg mL–1 for BS and 2.5–17.5 µg mL–1 for HZ within concentration ratio from 1 : 0.2 to 1 : 18 for BS :HZ, respectively. The zero–order absorption spectra were recorded over the range 230–285nm. The data points of the spectra were collected at every 1.0nm. PLS–Toolbox software version 2.1 was used for data manipulation. PCR and PLS–1 models were developed using 3 latent variables for BS and 2 latent variables for HZ (PLS–1 model). Three principal components were used for PCR model of both components.
HPLC method
20µl of each working standard solution was injected in triplicate injections under the specified chromatographic conditions described previously. The peak area values were plotted against corresponding concentrations. Linear relationship was obtained.
For 2DD method
For determination of BS: The zero–order absorption spectra of standard solutions of BS were divided by a normalized spectrum of HZ.a spectrum of unit concentration. The second derivative of the obtained ratio spectra was calculated with Dl = 4nm. Then smoothing with 8 experimental points and scaling factor of 20 was performed. The amplitudes at 228.4nm were measured and found to be proportional to the concentration of BS.
For determination of HZ: The zero–order absorption spectra of HZ were divided by a normalized spectrum of BS. The second derivative of the obtained ratio spectra was calculated with Dl = 4nm. Then smoothing with 8 experimental points and scaling factor of 20 was performed. The amplitudes at 283nm were measured and found to be proportional to the concentration of HZ.
Sample preparation
Twenty tablets were weighted and finely powdered. A portion of the powder equivalent to 5mg of BS and 12.5mg of HZ was dissolved in 100mL methanol. The solution was filtered, and diluted with 0.1M hydrochloric acid (for spectrophotometric methods) or mobile phase (for HPLC method). The procedures for PCR, PLS–1, 2DD and HPLC methods described under calibration were followed.
PCR and PLS–1 methods
Figure 1 shows the zero–order absorption spectra of BS and HZ at their nominal concentrations in tablets. As can be seen, BS contributes very little to overall absorption of the sample; also the absorption band of HZ is extensively overlapped with BS spectrum. Conventional UV methods for the determination of BS is susceptible to interference from HZ. PLS–1 or PCR calibration methods can be used to overcome this problem. However, the UV spectrum of HZ is not strongly affected by the presence of BS. This is a favourable condition and conventional zero–order or direct derivative methods could be applied for determination of HZ in the studied binary mixture.
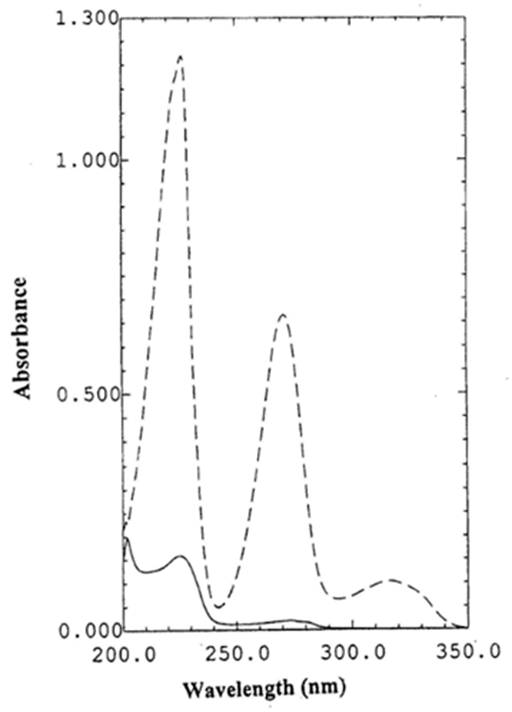
Figure 1 UV absorption spectra of 4µg mL-1 of BS (¬¬¬¬_____) and 10µg mL-1 of HZ (------) in 0.1M hydrochloric acid.
The wavelength range selection has a high impact on the quality of the developed multi–component model.37 In this work, PLS–1 and PCR models were developed using the wavelength range of 230–285nm with 1 nm skip point. Wavelengths less than 230nm were rejected due to the high contribution of HZ relative to BS. Wavelengths more than 285nm were not used because BS has no absorption in this region, therefore this region will introduce a significant amount of noise in the calibration matrix, thus decreasing the precision.
For best prediction PCR and PLS models, the optimum number of principal components or factors must be selected. These factors should account as much as possible for the experimental data without over fitting. Various methods have been developed to select the optimum number.30 Leaving–one–out cross– validation methods have been employed.38,39 A calibration matrix of 22 calibration spectra was used. PLS–1 and PCR calibration was performed using 21 calibration spectra then the model was used to predict the sample left out during the calibration process. This process was repeated 22 times until each calibration sample had been left out once. The root mean squares error of cross validation (RMSECV) was calculated for each run as follows:
Where n is the number of calibration samples and PRESS is the predicted residual error sum of squares. It can be calculated as follows:
Where Ypred and Ytrue are predicted and true concentrations in mg mL–1, respectively.
The RMSECV provides a good measure on how well the calibration model performs. It is an indicator of the precision and accuracy of predictions. It was recalculated upon addition of each new factor to the PLS–1 and PCR models. Thus the optimum number of factors was selected. The selected model was that with the fewest number of factor such that its RMSECV was not significantly greater than that for the model which yielded the lowest RMSECV. Figures 2 & 3 show the variation of the RMSECV as a function of the number of factors for PLS–1 and PCR models. A number of factors of 2 was found to be optimum for HZ (PLS–1 model), however 3 factors were optimum for BS (PLS–1 model) and BS and HZ (PCR model).
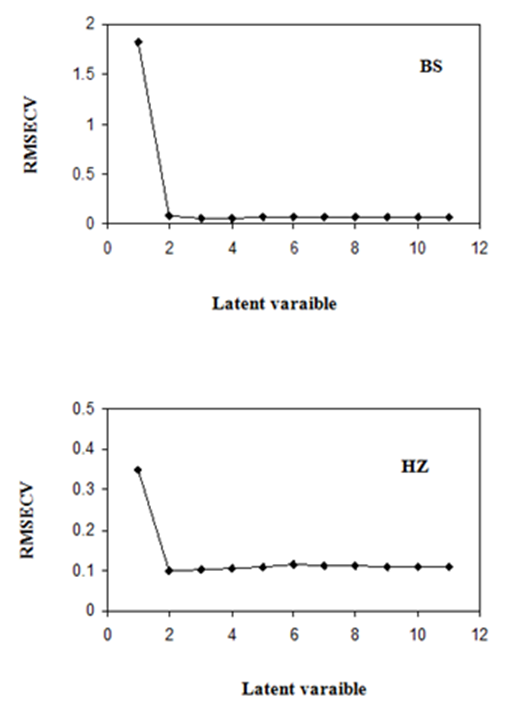
Figure 2 RMSECV plot of a calibration set prediction using cross- validation of PLS-1 model for BS and HZ.
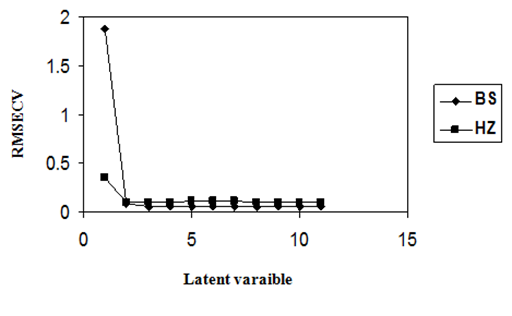
Figure 3 RMSECV plot of a calibration set prediction using cross- validation of PCR model for BS and HZ.
The prediction performance of the developed models was performed by plotting the known concentrations against the predicted ones. The results are shown in Table 1. Satisfactory correlation coefficient (r) value was obtained for each compound in the calibration matrix by PLS–1 and PCR optimized models indicating good predictive abilities of the models. The RMSECV obtained by optimizing the calibration matrix of the absorption spectra for the PLS–1 and PCR methods are shown in Table 1 indicating good accuracy and precision. The concentration residuals were plotted against the predicted concentrations (Figure 4 & 5). The random distribution around zero is another diagnostic tool indicating the adequate models' performance.
|
Item |
Method |
Compound |
|
|
BS |
HZ |
||
|
RMSECV |
PLS–1 |
5.28×10⁻² |
9.98×10⁻² |
|
PCR |
5.28×10⁻² |
10.2×10⁻² |
|
|
Intercept |
PLS–1 |
3.01×10⁻³ |
2.38×10⁻³ |
|
PCR |
3.01×10⁻³ |
2.32×10⁻³ |
|
|
Slope |
PLS–1 |
0.9994 |
0.9998 |
|
PCR |
0.9994 |
0.9998 |
|
|
Correlation coefficient (r) |
PLS–1 |
0.9997 |
0.9999 |
|
PCR |
0.9997 |
0.9999 |
|
|
S.E of intercept |
PLS–1 |
2.83×10⁻² |
3.90×10⁻² |
|
PCR |
5.68×10⁻³ |
3.87×10⁻² |
|
|
S.E of slope |
PLS–1 |
3.52×10⁻³ |
3.50×10⁻³ |
|
PCR |
3.22×10⁻³ |
3.47×10⁻³ |
|
Table 1 RMSECV and statistical parameter values for simultaneous determination of BS and HZ using PLS–1 and PCR methods
HPLC method
The developed HPLC method has been applied for simultaneous determination of BS and HZ. The mobile phase composition and pH were studied and optimized. A satisfactory resolution was obtained with isocratic mobile phase containing acetonitrile and 0.01M KH2PO4 (40:60, v/v) and flow rate of 1mL min–1 and detection wavelength of 232nm. Increasing acetonitrile concentration to more than 70% led to inadequate separation of the two drugs. Decreasing acetonitrile concentration (<20%), BS peak showed excessive tailing. Optimization of apparent pH of the mobile phase resulted in maximum capacity factor (K`) value at apparent pH 6.0, with loss of peak symmetry for BS. Resolution of both analytes was improved at apparent pH 3.0–4.0. However at apparent pH 3.5 optimum resolution with reasonable retention time was observed. The chromatogram in Figure 6 shows the complete separation of the two components indicating the method specificity. BS and HZ were eluted at 3.38±0.04 and 4.03±0.02 min, respectively, for ten replicates.
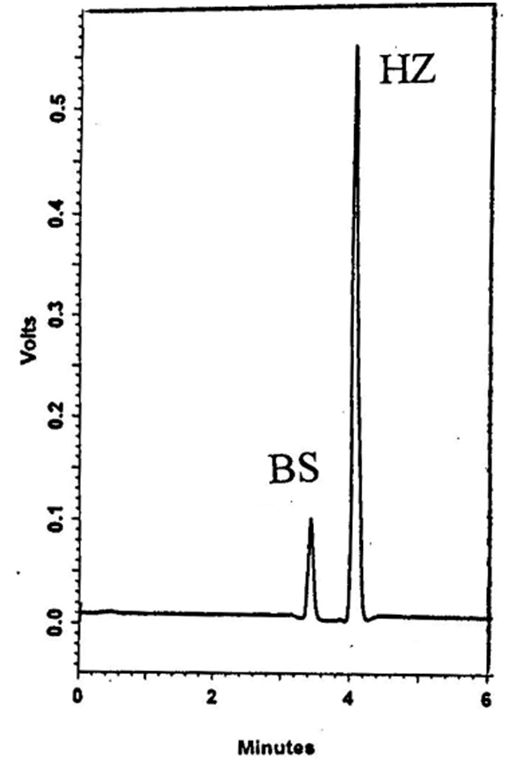
Figure 6 HPLC chromatogram of 20µl injection of tablet sample containing 4µg mL-1 of BS and 10µg mL-1 of HZ
Method linearity was measured by plotting peak areas of calibration standard solution versus concentration of each drug. Linear correlation was obtained. Characteristic parameters for regression equations of the HPLC method and correlation coefficient obtained by least squares treatment of the results were given in Table 2.
|
Parameters |
2DD |
HPLC |
||
|
BS |
HZ |
BS |
HZ |
|
|
Calibration range(μg ml–1) |
1–7 |
2.5–17.5 |
1–7 |
2.5–17.5 |
|
Detection limit (μg ml–1) |
1.69 x 10⁻² |
1.68 x 10⁻² |
0.026 |
0.017 |
|
Quantitation limit (μg ml–1) |
5.63 x 10⁻² |
5.60 x 10⁻² |
0.087 |
0.057 |
|
Regression equation(Y)a: |
2.22 x 10⁻² |
50.4 x 10⁻² |
1.29 x 10⁵ |
3.26 x 10⁵ |
|
Standard deviation of the slope (Sb) |
1.89 x 10⁻⁴ |
4.26 x 10⁻³ |
1.67 x 10³ |
2.85 x 10³ |
|
Relative standard deviation of the slope (%) |
0.85 |
0.85 |
1.29 |
0.88 |
|
Confidence limit of the slopeb |
2.22 x 10⁻² – 2.24 x 10⁻² |
50.01 x 10⁻² – 50.83x 10⁻² |
1.27 x 10⁵ –1.30 x 10⁵ |
3.23 x 10⁵ – 3.28 x 10⁵ |
|
Intercept (a) |
(– 2.86 x 10⁻⁴) |
1.75 x 10⁻² |
– 1.04 x 10³ |
–1.86 x 10⁴ |
|
Standard deviation of the intercept (Sa) |
8.44 x 10⁻⁴ |
4.75 x 10⁻² |
7.49 x 10³ |
3.19 x 10⁴ |
|
Confidence limit of the interceptb |
(–11.1 x 10⁻⁴)– 5.35 x 10⁻⁴ |
(–2.86 x 10⁻²) –6.37x 10⁻² |
(–8.31 x10³)–6.24x10³ |
(–4.96 x10³) – 1.24 x 10⁴ |
|
Correlation coefficient (r) |
0.9999 |
0.9999 |
0.9999 |
0.9999 |
|
Standard error of estimation |
3.78 x 10⁻⁴ |
2.12 x 10⁻² |
3.35 x 10³ |
1.43 x 10⁴ |
Table 2 Characteristic parameters of the calibration equations for the proposed 2DD and HPLC methods for simultaneous determination of BS and HZ
a Y = a+bC ,where C is the concentration of drug in µg ml–1 and Y is the 2DD amplitude or peak area for 2DD or HPLC methods, respectively.
b 95% confidence limit.
For 2DD method
For the developed 2DD method, the divisor standard concentration, the ∆l and smoothing function were all studied and optimized. Normalized spectrum was used as the divisor as it showed the best results in terms of sensitivity, signal to noise ratio and reliability. ∆λ= 4nm was selected as the optimum value. A smoothing function has been applied due to the extent of the noise levels on the ratio spectra, and 8 experimental points were considered as suitable.
The second derivative of the ratio spectra was preferred than the first derivative for a better resolution of the spectra and more accurate and precise results. Amplitudes at 228.4 and 283nm were measured and found to be proportional to the concentration of BS and HZ, respectively (Figure 7 & 8). The characteristic parameters for regression equations for the 2DD method and correlation coefficient were given in Table 2.
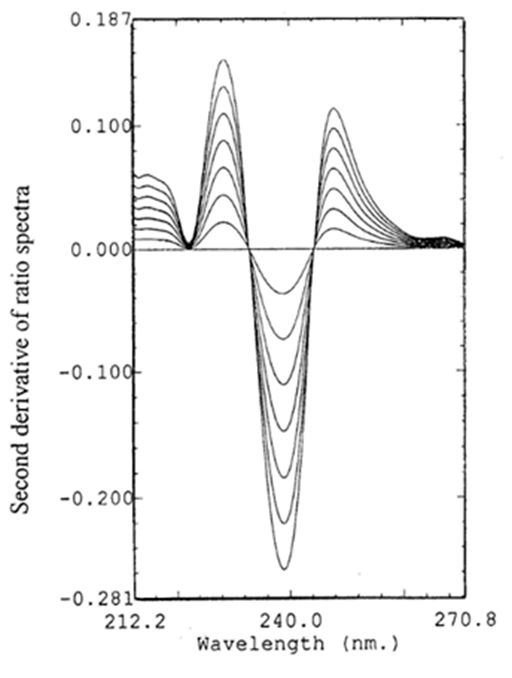
Figure 7 Second derivative of ratio spectra for different concentrations (1, 2, 3, 4, 5, 6, 7µg mL-1) of BS, using normalized spectrum of HZ as divisor.
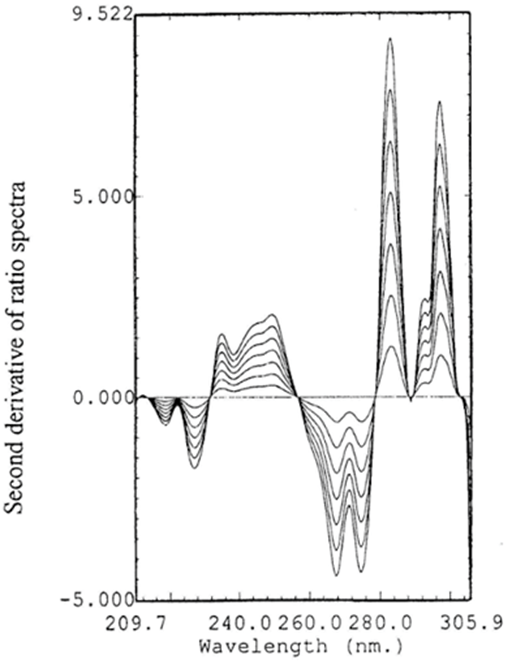
Figure 8 Second derivative of ratio spectra for different concentrations (2.5, 5, 7.5, 10, 12.5, 15, 17.5µg mL-1) of HZ, using normalized spectrum of BS as divisor.
Analysis of pharmaceutical tablets
The proposed PLS–1, PCR, 2DD and HPLC methods were applied for the determination of BS and HZ in commercial tablets. Five replicates determination were made. Satisfactory results were obtained for each compound (Table 3). The results of the proposed methods were compared with a published HPLC method.17 and there were no significant differences between the proposed methods and the reported one (Table 3).
|
|
Mean found ± S.Da |
||||
|
PLS–1 |
PCR |
2DD |
HPLC |
Published method[2] |
|
|
Synthetic Mixtures |
|
|
|
|
|
|
For BS |
100.6±0.87 |
100.6±0.87 |
100.1±0.62 |
100.1±0.33 |
|
|
For HZ |
100.6±0.85 |
100.5±0.75 |
100.0±1.08 |
99.9±0.38 |
|
|
Commercial Tablets |
|
|
|
|
|
|
For BS |
99.5±0.74 |
99.5±0.77 |
98.7±0.80 |
99.4±0.51 |
98.9±0.63 |
|
t |
1.38 |
1.35 |
0.44 |
1.40 |
2.31b |
|
F |
1.40 |
1.49 |
1.61 |
1.53 |
6.39 b |
|
For HZ |
99.1±0.75 |
99.1±0.75 |
99.1±0.80 |
99.4±0.47 |
99.3±0.65 |
|
t |
0.45 |
0.45 |
0.43 |
0.29 |
2.31 b |
|
F |
1.33 |
1.33 |
1.52 |
1.91 |
6.39 b |
|
Recoveryc |
|
|
|
|
|
|
For BS |
100.0±0.47 |
100.0±0.47 |
100.3±0.90 |
99.8±0.42 |
|
|
For HZ |
99.9±0.85 |
100.0±0.90 |
99.6±0.98 |
99.9±0.58 |
|
Table 3 Determination of BS and HZ in synthetic mixtures and commercial tablets using the proposed methods
aMean and S.D., percentage recovery from the label claim amount.
bTheoretical values for t and F at p = 0.05
cFor standard addition of 50% of the nominal content.
Validation of the methods
Linearity: The linearity of the HPLC and 2DD methods was evaluated according to the International Conference on Harmonization (ICH) recommendations. Eight concentrations were used, ranging between 1–7 and 2.5–17.5μg mL–1 for BS and HZ, respectively. Each concentration was repeated three times. The results showed high correlation coeffecient and the intercept value was not statistically (p<0.05) different from zero. The linearity parameters were provided in Table 2.
Selectivity
Selectivity was assessed by analysis of 6 laboratory–prepared mixtures of the studied components at various concentrations within the linearity range for the proposed methods. Satisfactory results were obtained (Table 3), indicating the high selectivity of the proposed methods.
Accuracy
Accuracy was assessed by standard addition techniques and excellent recoveries were obtained (Table 3) indicating the good accuracy of the proposed methods.
Precision
Repeatability and intermediate precision were performed at three concentration levels for each compound and the data was evaluated by one– way ANOVA. A 8 days Х 2 replicates design was performed. Three univariate analyses of variance for each concentration level were made. Since the P– value of the F– test is always greater than 0.05, there is no statistically significant difference between the mean results obtained from one level of day to another at the 95 % confidence level.
Detection and quantitation limits
The following equation was applied to calculate the detection limit:
where, n is the number of standards, tp is the Student’s coefficient at the selected level of significance, b is the slope of the regression line, and is the variance which can be calculated using the following relationship:
Where y is the experimental value on the ordinate and ycalc is the value calculated from the regression equation. The theoretical values were assessed practically and given in Table 2.
Robustness
The robustness of a method is its ability to remain unaffected by small change in parameters. Variation of pH of the mobile phase by ±0.2 and its organic strength by ±3 % did not have significant effect on chromatographic resolution in HPLC method. Variation of strength of hydrochloric acid by ±0.02M did not have significant effect on spectrophotometric methods.
Analytical solution sability
The studied solutions of both analytes in mobile phase or 0.1M hydrochloric acid exhibited no chromatographic or absorbance changes for 24 hours when kept at room temperature, and for 5 days when stored refrigerated at 5ºC.
The application of multivariate calibration to zero–order spectra is an effective technique for the quality control of pharmaceutical preparations. Two chemometric models, PLS–1 and PCR were proposed in this work for the simultaneous determination of BS and HZ in their binary mixture and in commercial tablets. The results obtained were compared with the published HPLC method and good coincidence was observed. The two chemometric methods are green, fast, simple, precise and accurate. In addition, they require no sample preparation or chromatographic separation. Overall, PLS–1 and PCR have proved to be a valid alternative to, HPLC and 2DD.
None.
None.

©2017 Mostafa, et al. This is an open access article distributed under the terms of the, which permits unrestricted use, distribution, and build upon your work non-commercially.