Journal of
eISSN: 2373-6437


Case Report Volume 16 Issue 2
1Neuroanesthesiologist, Central Military Hospital, Mexico
2Neuroanesthesiologist, Manuel Velasco Suárez National Institute of Neurology and Neurosurgery, Mexico
Correspondence: Ilayali Moreno Arzate, Neuroanesthesiologist, Central Military Hospital, Mexico
Received: April 20, 2024 | Published: April 29, 2024
Citation: Arzate AIM, Corona AO. Detection of epileptiform discharges by patient state index and density spectral array during anesthetic emergence after resection of hemispheric brain tumor. Case report. J Anesth Crit Care Open Access. 2024;16(2):50‒53. DOI: 10.15406/jaccoa.2024.16.00589
Background: Processed electroencephalogram (EEGp) plays a crucial role in anesthesia as a quantitative and automated method for assessing anesthetic depth. It utilizes mathematical algorithms to furnish objective measures, offering an intuitive interface for anesthesiologists lacking specialized neurophysiology training. Among the array of visual graphical analyses, the Density Spectral Array (DSA) stands out as particularly promising. DSA furnishes a comprehensive and visual depiction of the patient's brain activity, aiding anesthesiologists in maintaining optimal anesthetic depth during surgical procedures
Conclusion: This report underscores the potential of analyzing
Case report: A 51-year-old male with a medical history of neurofibromatosis type 2 and a frontal hemispheric brain tumor underwent resection in the operating room under total intravenous anesthesia. Anesthetic depth was monitored utilizing SedLine® Patient Status Index (PSi). The resection proceeded uneventfully; however, upon extubation, EEG processing revealed epileptiform discharges concurrent with tonic-clonic movement of the right hand electroencephalogram waveforms alongside the latest SedLine-derived Density Spectral Array to confirm the presence of partial epileptic seizures during the immediate post-extubation and postoperative phases following brain tumor resection. Employing advanced monitoring techniques like Density Spectral Array aids in early detection of neurological complications, facilitating timely intervention and potentially enhancing patient outcomes during the critical postoperative period.
Keywords: EEGp, depth of Anesthesia, Density Spectral Array (DSA), Patient Status Index (PSi)
The inception of electroencephalogram (EEG) recording traces back to 1929, credited to the German neurologist and psychiatrist Hans Berger, who identified electrical fluctuations originating in the pyramidal cells of the cortex.1 Subsequently, in 1937, documentation of electroencephalogram changes induced by drugs targeting the central nervous system emerged.2 Given that the brain serves as the primary target organ for anesthesia, the hypnotic aspect of anesthesia holds paramount importance. It is subject to multiple influences, contingent upon patient factors, surgical procedures, and pharmacokinetics/pharmacodynamics.3 Maintaining an appropriate level of anesthetic depth during surgery is imperative. Inadequate anesthesia, characterized by a state of "light anesthesia," elevates the risk of post-traumatic stress due to residual consciousness, while excessive anesthesia, or "deep anesthesia," may lead to hemodynamic instability and suppression flares.4
In recent years, there has been a surge in interest regarding the utilization of total intravenous anesthesia (TIVA), particularly in the realm of anesthesia for neurological surgeries, where intraoperative neurophysiological monitoring is commonplace. The adoption of three-compartment models facilitates drug infusion calculations to achieve desired target concentrations either in plasma or at the effect site.5 Prior to the advent of processed electroencephalogram (EEGp) monitoring, anesthesiologists relied on hemodynamic parameters to gauge anesthetic depth. Presently, the quantification of hypnosis via monitoring enables precise modulation of drug administration to achieve optimal anesthetic depth, thereby reducing the risk of intraoperative awareness with recall.6 EEGp assumes pivotal significance in anesthesia, serving as a quantitative and automated tool for assessing anesthetic depth through mathematical algorithms, thereby fostering an intuitive environment for anesthesiologists without specialized neurophysiology training.
Beyond anesthesia, the exploration of EEGp devices for guiding sedation protocols or monitoring post-arrest status in Intensive Care Units has gained traction, often evidenced by case reports. Several alternatives exist for EEGp monitoring, with the Bi-spectral Index (BIS), introduced in 1996, being the most prevalent. Another alternative is the Patient Status Index (PSi) with the SedLine system. The presence of electromyography (EMG) in the EEG trace is typically regarded as an artifact,7 and the decision to attenuate this component entails trade-offs, potentially compromising early warning signs indicative of pain or lightened anesthesia.8,9
In 1971, Bart et al. elucidated the decomposition of EEG signals into distinct oscillations at specific frequencies under general anesthesia.1. Bickford et al. introduced the compressed spectral matrix or spectrogram, depicting EEG activity of anesthetized patients over time as a three-dimensional graph.11 Fleming and Smith proposed the spectral density array (DSA), a two-dimensional spectrogram graph, serving the same purpose.12 Subsequently, various anesthetic depth monitoring devices incorporating diverse algorithms and unique filters have been developed to enhance signal clarity and processing.13 Presently, the DSA emerges as potentially the most advantageous among visual graphical analyses. Power is represented through color-coding (red: high, blue: low), complemented by an X-Y plot of time versus frequency. Anesthesiologists should familiarize themselves with the technical disparities of each new device and meticulously select monitors based on the sensitivity and specificity pertinent to each patient and clinical context.
A 51-year-old male with a medical history of Neurofibromatosis type 2 presented with a clinical progression spanning 3 months, characterized by difficulties in concentration, short- term memory loss, and a frontal oppressive-type headache rated 5/10 on the analog pain scale, exacerbated by the Valsalva maneuver. Imaging studies revealed a hypodense lesion with central necrosis in the right frontal lobe accompanied by perilesional edema, resulting in interhemispheric line displacement. Additionally, there was partial collapse of the ipsilateral lateral ventricle and subfacial herniation.
Preoperative electroencephalogram (EEG): No epileptic activity detected.
Upon admission to the operating room, vital signs were as follows: heart rate 71 beats per minute (bpm), respiratory rate 14 breaths per minute (bpm), blood pressure 128/73 mmHg, oxygen saturation 99%, and temperature 36°C. Type 1 monitoring was initiated, including electrocardiogram (ECG), pulse oximetry, non-invasive blood pressure, and anesthetic depth monitoring with the patient status index (PSi) (Sedline®).
The anesthetic induction involved total intravenous anesthesia (TIVA) through Target Controlled Infusion (TCI), with depth of anesthesia monitored using PSi. Medications administered included Fentanyl Marsh II, TCI 3 ng/ml, lidocaine 15 mg/kg/min, and propofol TCI (Schnider) 1-2.5 mg/ml guided by PSi. A single dose of rocuronium 50 mg was given, and endotracheal intubation was performed with videolaryngoscopy (Glidescope®).
During the intraoperative phase, maintenance medications included Fentanyl Marsh II, TCI 3 ng/ml, lidocaine 15 mg/kg/min, and propofol TCI Schnider 1-2.5 mg/ml guided by PSi, ensuring normal vital signs and PSi within the parameters of general anesthesia. A Mayfield- Kees neurosurgical cranial fixator was placed, and a right frontotemporo-parietal craniotomy was performed for brain tumor resection using a neuronavigation system, without complications.
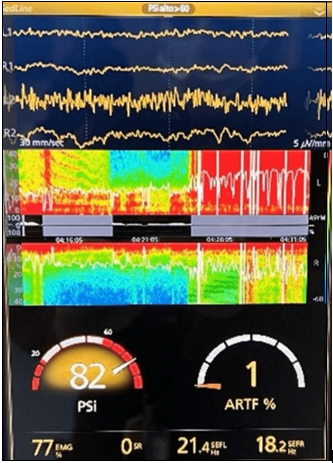
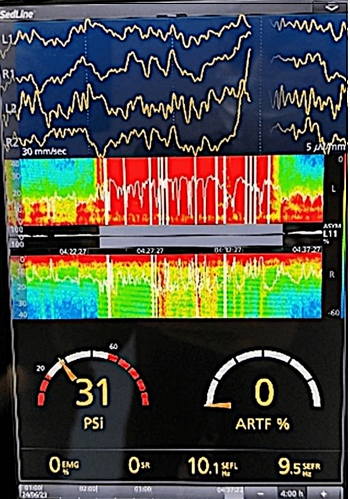
Upon completion of the surgical procedure, perfusions were suspended, and the extubation protocol was initiated. The patient was safely extubated in the operating room without complications. However, one minute later, abnormal movements in the right hand, including tonic and clonic movements of the right extremity, were observed, leading to a diagnosis of an epileptic crisis. Benzodiazepine was administered without a clinical or electroencephalographic response, prompting advanced airway management and intravenous sedation for neurological rest. Following this intervention, normalization of the electroencephalogram and DSA (figure 4) was observed. The patient was transferred to the emergency post-surgical computed tomography (CT), revealing a laminar epidural hematoma.
Awareness during anesthesia, particularly concerning for patients under neuromuscular blockade, underscores the importance of utilizing depth of anesthesia monitors with processed electroencephalogram (EEGp). However, it's imperative for anesthesiologists not to solely rely on monitor data, including EEGp indices. They should be proficient in interpreting common EEG wave patterns during anesthesia. Despite basic training, physicians unfamiliar with continuous EEGp use may misinterpret waveforms. Continuous training integrated into anesthesiology curriculum is advocated over single sessions to enhance competency.14 Complex EEG interpretation during anesthesia, evident in studies like ENGAGES, necessitates ongoing training for concept reinforcement and knowledge retention.15
Gimson and Smith's study documented epileptic seizures detected on anesthetic depth monitors with EEGp, predominantly utilizing BIS in the literature.16 You et al. demonstrated SedLine's effectiveness in detecting epileptiform discharges with 100% sensitivity and specificity, emphasizing its utility in identifying abnormal brain activity.17 Regarding anesthetic drugs, no clear dose-response relationship exists for seizures, and some drugs may have pro-epileptic effects, emphasizing careful consideration in patients with seizure history or predisposition.18 Early seizures post-craniotomy for brain tumor resection are common, warranting vigilance and appropriate management to prevent and address potential complications (Figure 1-4).19-21

Figure 3 Electroencephalogram and spectral density array (DSA) post extubation.
The DSA shows a sudden and short change in the shades towards red, consistent with the SEF 95 line, recovering to its baseline in a few minutes.
The Spectral Edge Frequency (SEF 95) shows significant variability in the SEF 95 line with decreasing amplitude trend, presence of prominent depressions towards zero, giving an image of inverted polypoints.

Figure 4 Electroencephalogram and spectral density matrix (DSA) after intubation and sedation.
After advanced airway management and intravenous sedation, normalization of the SEF95 line is observed around 8-12 Hz, and the DSA changes to predominantly blue (low power). Within the electroencephalogram channels we observed slow waves.
Interpreting raw EEG can be challenging for untrained anesthesiologists, contrasting with the quantitative analysis of classical frequency bands by PSi monitors. Combining Depth of Anesthesia Spectral Array (DSA) with PSi enables nuanced characterization of different brain stages, advocated in current anesthesia practice. Anesthesiologists must acquire proficiency in interpreting EEG and electromyography (EMG) signals akin to electrocardiograms. In our case, changes in DSA color and EEG morphology facilitated anticipation of neurosurgical patient complications, directly impacting patient prognosis. Continuous EEG monitoring and interpretation are crucial in perioperative care, enabling early complication detection and intervention to enhance patient outcomes.
None.
The authors declare they have no conflicts of interest.

©2024 Arzate, et al. This is an open access article distributed under the terms of the, which permits unrestricted use, distribution, and build upon your work non-commercially.