eISSN: 2574-8092


Research Article Volume 7 Issue 3
Department of Chemistry, University of Nairobi
Correspondence: Mbugua James Kamau, Department of Chemistry, University of Nairobi, P.O. BOX 30197, 00100, Nairobi, Kenya, Tel +254735345517
Received: October 10, 2021 | Published: November 5, 2021
Citation: Kinyua AP, Mbugua JK, Imwene KO, et al. Current and voltage data logging from microbial fuel cells using arduino based sensors. Int Rob Auto J. 2021;7(3):90-93. DOI: 10.15406/iratj.2021.07.00232
In the anaerobic oxidation of organic substrates, exo-electrogenic bacteria are utilized in microbial fuel cells to generate current. Voltage and current are the primary output of the microbial fuel cells. In the present study, automatic current and voltage data logging into an excel sheet using PLX DAQ application is described. The current and voltage are generated from double chamber microbial fuel cells loaded with cow dung and tomato wastes. The chambers are linked with a NaCl salt bridge. An Arduino board micro-controller is programmed to read analog pins sensor data. The data is read from an H-shaped MFC using a 25V voltage sensor and ACS712 current sensors. The Arduino UNO voltage measurement device was evaluated, and the results showed no major differences between the Arduino and multimeter potentials. Using general statistics and hypothesis tests on averages, it was shown that the potentials measured with Arduino and the multimeter Escort was equivalent. Replace the multimeter with Arduino UNO, and you'll save money in the process. Compared to a commercial multimeter, the cost of an Arduino UNO is less than a tenth of that amount. Additionally, the Arduino UNO has up to five channels (allowing for the simultaneous monitoring of up to five cells), whereas the Escort multimeter just has one.
Keywords: Arduino, voltage, current, microbial fuel cells, multimeter
MFC, microbial fuel cells; LCD, liquid crystal display; ADC, analog to digital converter
The quest for new energy sources that are both efficient and sustainable has become a major focus of research around the world Logan.1 Microbial fuel cells (MFCs) have recently emerged as promising contributors to the transition to a low-carbon society, with the ability to reduce greenhouse gas emissions and fossil fuel supremacy. MFCs produce electricity through the catalytic action of exo-electrogenic bacteria involved in the anaerobic oxidation of organic substrates acting as low-grade fuels, which is perhaps the most significant aspect that makes this technology so appealing Logan.1 MFCs generate less energy than other fuel cell technologies; they can produce chemical energy from a variety of wastes, and they can transform non-purified organic substrates into electrical energy efficiently and directly Nastro et al.2 A microbial fuel cell is a system that uses microorganisms to catalyze the conversion of chemical energy to electrical energy. To generate electricity, a MFC uses the electron-extracting properties of special bacteria attached to the anode. Organic material is oxidized by bacteria attached to the anode, releasing carbon dioxide and protons into the anode chamber solution. Electrons are transported to the anode and then pass through an electrical circuit to the cathode, where they are absorbed during oxygen reduction. Meanwhile, protons travel through a membrane into the cathode chamber. As a result of the movement of electrons, a current is produced Siddharth.3
The microbial fuel cell represents a radically new long-term, cost-effective, open, and environmentally responsible solution to wastewater treatment and energy production. They've also been researched for use as biosensors, such as sensors for measuring biological oxygen demand. The types of microbes in an MFC's anodic chamber, as well as the MFC's configuration and operating conditions, have a major impact on power production and columbic performance. Because of their low power density of several thousand Mw/m2, MFC applications in the real world are currently constrained. MFC performance is being improved, and construction and operational costs are being reduced Siddharth.3 Typically, one of the main monitoring variables for cell performance consists of voltage measurements Poggi-Varaldo et al.4 Cell power (P) and current intensity (I) can easily be derived by using the potential and the external resistance Logan.1 based on Ohm’s law for direct current circuits. Bio-electrochemical studies are often limited due to the need for precise and expensive instrumentation for electrochemical measurements Poggi-Varaldo et al.5
The aim of the study
This work aimed to evaluate a low-cost voltage-measuring device (Arduino UNO) versus commercial, more expensive multimeter for monitoring the potential delivered by a bio cathode MFC.
Arduino mega
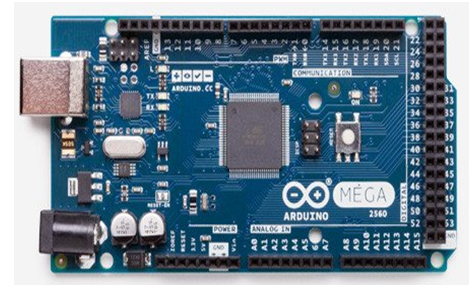
The Arduino Mega is an ATmega1280-based microcontroller module Blum6 as depicted in Figure 1. It features 54 digital input/output pins (14 of which can be used as PWM outputs), 16 analog inputs, 4 UARTs (hardware serial ports), a 16 MHz crystal oscillator, a USB link, a power jack, an ICSP header, and a reset button. It comes with everything you need to get started with the microcontroller; simply plug it into a device with a USB cable or power it with an AC-to-DC adapter or battery The Arduino Playground.7

Figure 1 Arduino Mega Board.13
Voltage sensor
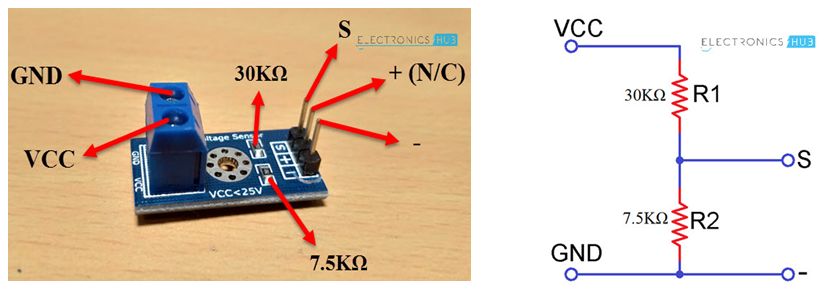
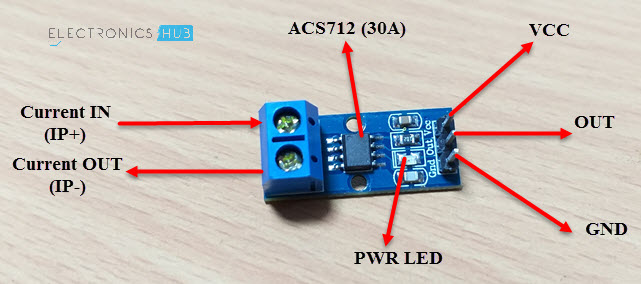
The Voltage Sensor is a simple module that can be used with Arduino (or any other microcontroller with a 5V input tolerance) to calculate external voltages that are higher than the microcontroller's maximum acceptable value, in this case, 5V. The pins of a voltage sensor module are shown in the picture below Figure 2. Allegro Micro Systems' ACS712 Current Sensor is employed to precisely calculate AC and DC currents. This sensor is based on the Hall Effect, and the IC includes a built-in Hall Effect device. The analog voltage generated by the ACS712 is proportional to AC or DC currents. In this work, we propose the use of a low-cost microcontroller board “Arduino UNO” and sensors to monitor voltage and current generation from tomato and cow dung wastes in a H-shaped double chamber MFC.

Figure 2 A voltage sensor module.14
The prototype consists of an Arduino (mega) board, Liquid Crystal Display (LCD), a voltage sensor and a current sensor interfaced and connected on a breadboard. The evaluation of Arduino UNO for monitoring cell potential was done using a double chamber MFC was inoculated with cow dung. Each chamber volume was 1500cm3 and contained 5 of graphite rods totaling an electrode area of 0.00666m2. The external resistance used in the test was a 1000Ω resistor. The chambers were separated with a NaCl salt bridge. The anode chamber was inoculated with cow dung and tomato waste while the cathodic chamber contained water. The operation’s initial pH was 7.23 for the analyte and catholyte. The cell voltage was simultaneously monitored with both an Arduino UNO and a multimeter (DT9205A); the readings were set every 1 min. To improve the accuracy of the Arduino UNO, we improved the resolution of the Arduino board and decreased the noise. The analog to digital converter (ADC) resolution on the Arduino UNO is 10 bits, meaning that when using the default voltage reference of 5V, every digital unit represents 4.88 mV, being a low resolution. To overcome this issue voltage reference of 0.83 V was set to improve the ADC resolution. The AA batteries were used as constant DC power source and was implemented a voltage divider with a 33 kΩ resistor and the internal resistance of 32 kΩ of the Arduino board. According to the voltage divider equation Vf=Vi*32/(32+33), the final voltage should be around 0.73 mV, but after reading it with a multimeter, the true voltage (0.83 mV) was added to the code. The current was measured using the two methods across an LED.
The block diagram showing the process flow is shown in Figure 4 while the components’ connections to the Arduino were done using Dip Trace v3.3.4 and is shown by schematics in Figure 5. The connection of the MFC, the multimeter and the Arduino-based voltage and current monitoring device is shown in Figure 6. The code was also written to take readings and print after every 1 minute. Daily voltage was then averaged and reported. Based on previous tests an adjustment factor was added for better fitting at low voltages, the printing command of the code was modified to work with the public interface PLX-DAQ in Microsoft Excel. The final code is shown in appendix 1.

Figure 3 An ASC712 current sensor module.15
Data analysis
The collected data (potential readings) during the operation of the cell was evaluated with different statistical parameters. Absolute and relative errors were estimated with equations 1 and 2 respectively.
(1)
(2)
where is the voltage reading of the multimeter at any specific time and is the potential reading with the Arduino UNO at the same time.
The MFC cell potential and current were monitored for 24 days using Arduino based sensors and a multimeter. The average daily voltage and current are reported. Figure 7 shows the voltage and current on tomato waste measurement of both instruments and that of the Arduino UNO follows closely the multimeter line, showing only some observable noise in the readings. The daily voltage recorded was in the range of 0.05 – 0.34V while the current ranged from 0.002 – 0.05mA. In Figure 8, the voltage and current monitored using the two methods was plot against time. There was no observable difference between the two methods. The daily average voltage and current were in the range of 0.08 – 0.35V and 0.001 – 0.041mA respectively.
A previous study by Poggi-Varaldo et al.5 showed that the readings of the Arduino UNO showed an average error of 0.75 mV (with a standard deviation ± 0.66 mV) with respect to the multimeter readings. The statistical analysis consisted of the test of the hypothesis of means of matched (paired) samples, based on the potentials measured with Arduino and multimeter. The test indicated that there was no significant difference between the potentials. Depending on the configuration and material used, the highest power transfer point occurs at a voltage between 300 mV and 500 mV at the single MFC stage. Smaller MFCs are often more power-dense than larger ones due to diffusion limitations and improved internal resistance Ge et al.8 These two inherent characteristics of the technology have fuelled the production of MFC-systems aimed at supplying high power densities to real-world applications. The most popular technique used by researchers is to stack several MFCs together Gajda et al.9 This strategy enables the units to be electrically connected in series or parallel, thus raising the voltage or current produced by the stack Ieropoulos et al.,10; Aelterman et al.,11; Chen et al.12
The evaluation of the Arduino UNO device for MFC voltage measurement showed that potentials from Arduino and multimeter were not significantly different. General statistical analysis of data, as well as the test of the hypothesis of means (for matched or paired samples), showed that potentials measured with Arduino and multimeter Escort were equivalent. Therefore, replacing the multimeter with Arduino UNO is feasible and economic. Arduino UNO costs represent less than 1% of the price of the commercial multimeter. Besides, Arduino UNO has up to 5 channels (allowing the simultaneous Monitoring of five cells) whereas the multimeter Escort has only one.13–16
None.
The authors declare that there have no conflicts of inertest.
None.

©2021 Kinyua, et al. This is an open access article distributed under the terms of the, which permits unrestricted use, distribution, and build upon your work non-commercially.