International Journal of
eISSN: 2475-5559


Research Article Volume 4 Issue 3
Chemistry Department, Faculty of Science, Ain Shams University, Egypt
Correspondence: Fayza S Hashem, Professor, Chemistry Department, Faculty of Science, Ain Shams University, Cairo, Egypt, Tel +0020111784595
Received: January 24, 2019 | Published: May 2, 2019
Citation: Hashem FS, Hekal EE, Wahab MAEI. The influence of Triethanol amine and ethylene glycol on the grindability, setting and hydration characteristics of Portland cement. Int J Petrochem Sci Eng. 2019;4(3):81-88. DOI: 10.15406/ipcse.2019.04.00107
Triethanol amine and ethylene glycol are used as grinding aids for Ordinary Portland Cement (OPC). Standard water of consistency, Blaine area, initial and final setting times and compressive strength are tested for OPC. The phase composition and microstructure of the formed hydrates are tested using DTA/TG and SEM techniques. Results showed that both the two GAs had a significant improvement in the performance of grinding mills. This is indicating by higher Blaine area when a dose of 0.03, 0.04 and 0.05wt. % are applied. Beside there are increase in the water demand (greater than 5%) for the all OPC mortar mixes admixed with triethanol amin or ethylene glycol at concentrations less than 0.05 wt.%. The improved hydration properties are reflected by an increase in the mechanical properties and microstructure of the mortar pastes admixed with the two GAs. This is with attributed to the increase in the cement fineness which leads to the progress in the degree of cement hydration.
Keywords: portland cement, triethanol amine, ethylene glycol, water demand, setting time and compressive strength
Grinding aids are mostly organic compounds that are added to the clinker in the cement mill. Their main purposes are to reduce the energy consumed in grinding the clinker. In addition to increase the efficiency of the mill, some grinding aids can also provide important positive effects on the final cement paste like the reheology and the improved strength development.1,2 Grinding aids that provides these “extra” properties are called quality improvers or the name performance enhancer as we also may like to use.3 During the grinding of clinker, the ground particles may be agglomerated. For that, grinding aids are usually added in concentration range of 0.02 to 0.1 % of the manufactured cement weight.4,5 According to their structure, grinding aids could be classified into groups such as aliphatic amines-base,6 glycols-base7 and phenol-base grinding aids. In addition, there are more complex compounds such as amino ethyl ethanol amine (AEEA) and hydroxyl ethyl diethylene triamine (HEDETA) that have been used at low dosage (0.01 - 0.1% in weight) in order to reduce the energy cost since 1930.8,9 Cement particles aggregation essentially depends on many factors such as the clinker composition, crystallinity of the cement phases, dispersion state of the cement, mill type and the atmosphere within the mill.7,10 To reduce cement particles agglomeration, grinding aids are usually added during grinding of cement clinker in the range of 0.02% to 0.1% from cement weight. The high polarity of chemical functioning groups in these compounds leads to be adsorbed on electrostatic surfaces of the grinding clinker, which so they resist the rebinding phenomenon. Eventually, better dry powder dispersion of the ground cement increases mill productivity and cement fineness for the same energy consumption, and produces improvement in flow, leading to faster unloading and improved storage volume of bulk cement storage.11,12 According to the literature, triethanol amine (TEA) can be considered as the most popular grinding aid in cement industry. However its action on cement pastes is very complex and depending on the type of cement and the amount of TEA.1,13‒15 An addition of 0.02 % of TEA to Portland cement, acts as a set accelerator at 0.25 % it acts as a mild set retarder, at 0.5% TEA acts as a sever retarder, and at 1% it behaves as a very strong accelerator. In our study we will evaluate the performance of ethylene glycol (EG) and Triethanol amine (TEA) grinding aid on the hydration characteristics of Ordinary Portland cement (OPC). The effect of addition of (EG) and (TEA) on the grindability. Setting times and the mechanical properties of OPC and PLC cement were also investigated.
Materials
Industrial clinker and gypsum (from Helwan cement company) are used for the production of type I Portland cement (CEM I 42.5 R). Their chemical compositions are presented in Table 1. The chemical oxide composition of OPC clinker and theoretical phase calculated by Bogue formulae are presented in Table 1. Ethylene glycol and triethanol amine are used as grinding aids and strength enhancer for OPC. They are provided from Aldrich-sigma.
Oxides |
SiO2 |
Al2O3 |
Fe2O3 |
CaO |
MgO |
K2O |
Na2O |
SO3 |
Cl |
LOI |
Total |
% |
19.78 |
4.55 |
3.28 |
61.84 |
1.91 |
0.21 |
0.24 |
2.54 |
0.06 |
4.1 |
98.81 |
Table 1 Chemical oxide composition of Portland cement (PC).
Preparation of dry mixes
During the grinding of OPC clinker in lab ball mill, the grinding aids are added with the ratios 0, 0.03, 0.04 and 0.05 wt. % of the clinker with gypsum. A constant 10% of gypsum by weight of clinker has been added to each cement mixture with clinker factor 90%. A laboratory porcelain lab mill of 35liters was used for grinding. The mill was operated in a room where ambient temperature and relative humidity were 23±28C and 55±5%, respectively. To compare the grindability of the different dry mixes, all the dry mixes were grinded for 45 minutes and the Blaine surface area was measured.
Preparation of cement mortar specimens
Mortar preparation and casting were conducted according to the BS/EN 196-1:2005 using the standard mortar prism with 40mm×40mm×160mm size. Water-to-binder ratio was fixed at 0.5 for all of the specimens. Prepared mortar prisms were taken from the mold after one day and placed into the water tank for curing at room temperature of 20±2oC until the desired age of testing was achieved. Finally, prisms were used for the compressive strength test of mortar at the ages of 2, 7, 28, and 90 days.3
Techniques
The effectiveness of EG and TEA on the grindability of OPC clinker was evaluated through measuring the grindability index (G.I.). This calculated by using equation 1:
G.I = (Blaine area) aids(Blaine area) control (1)
Where: (Blaine area) aids is the specific surface area (Blaine) for OPC clinker in presence of definite concentration of the used grinding aid;
And (Blaine area) control is the Blaine for OPC clinker in absence of grinding aid.
The standard water of consistency and setting times for each hardened cement pastes were determined according to ASTM C187 and C191 test methods respectively.16,17 A set of three mortar specimens were used for the determination of compressive strength as described by ASTM Specifications.18 This was accomplished using a "Ton-industrial machine" for maximum load of 60tons. The resulting crushed specimens were ground, and the hydration reaction was stopped by stirring about 10grams of the ground sample with 100ml of a mixture of acetone and methanol (1:1 by volume) using a magnetic stirrer for at least one hour and then the solvent mixture was removed by decantation and filtration. Finally, the sample was dried at 80ºC in the dryer overnight. To evaluate the effect of the grinding aids on the mechanical properties of hardened mortar pastes, the relative compressive strengths were calculated using equation 2:
(C.S)rel. =(C.S )G(C.S) x 100 (2)
Where: (C.S)G is the compressive strength of mortar specimens admixed with grinding aid (GA) after a certain period of hardening t; and, (C.S.) is the compressive strength of mortar in absence of GA after the same hardening time. The phase compositions and microstructure of the formed hydrates are tested on the dried samples using differential thermal analysis (DTA) and Scanning electron microscope (SEM).
Blaine area and grindability index
Table 2 shows the Blaine area and the grindability index (GI) values of the dry mixes prepared from OPC in presence of different dosage of ethylene glycol (EG) and triethanol amine (TEA) after grinding for 45minutes. For OPC mixes, presence of grinding aids shows higher values of Blaine areas than the control mix. Beside, EG offers better grinding aid performance than (TEA). Moreover, GI values for EG increase by increasing the EG dose from 0.03 to 0.05 while (TEA) does not show an increase in values of GI till 0.05dose. Cement particles possess positive and negative charges when it ground into smaller particles. These charges make agglomeration of the cement particles and they become easier to adhere on the ball mill surface. Ethylene glycol (EG) absorbed on the cement particles and ball mill surface via the hydroxyl groups which neutralize this electrostatic surface charge. Besides, the alkyl part of EG shield the surface charge of cement particle which reduces the adhesive forces leading to prevention of aggregation of the powder and coating on balls mill.19 This make the ball mill getting the higher capability to produce finer particles.20 The increase in the GI values by increasing EG dose could be related to the monolayer coverage of the solid surface.3,7,21,22 For triethanol amine (TEA) the unchanged GI values after 0.04dose is attributed to the formation of multimolecular layers on the solid surfaces at excessive dose. Multimolecular layers of GAs can lead to the formation of capillary forces that favor agglomeration.
mix |
GA name |
GA dose (%) |
Blaine area(Cm2/g) |
GI |
Blank |
- |
- |
4096 |
1 |
Admixed cement |
EG |
0.03 |
4269 |
1.04 |
|
0.04 |
4296 |
1.05 |
|
0.05 |
4401 |
1.07 |
||
TEA |
0.03 |
4213 |
1.03 |
|
0.04 |
4213 |
1.03 |
||
0.05 |
4074 |
0.99 |
Table 2 Blaine Area and Grindability index of OPC and OPC admixed with different doses of EG and TEA.
Standard water of consistency
Figure 1 shows the standard water of consistency of OPC pastes admixed with 0, 0.03, 0.04 and 0.05wt. % grinding aids. Higher water: cement ratio for normal consistency are observed in OPC pastes containing grinding aids (EG and TEA). This could be related to the increase in the cement fineness as a result of presence of grinding aids. Increasing the finesses of cement requires higher amounts of water for proper lubrication.10 TEA shows higher water of consistency for OPC pastes compared to (EG). Increasing the dose of EG and TEA in the OPC paste increases the standard water of consistency. This may attributed to compounds relating to class of amines merely modify particle size cements neutralized charges arising at rupture valence bond and catalyze hydration process to increase strength, both in initial and late periods of hardening. Glycol compositions mainly prevent agglomeration of cement particles in grinding process, and exert little effect on change in particle size. The most effective influence on processes of grinding and hardening, have intensifiers based on surfactants.23
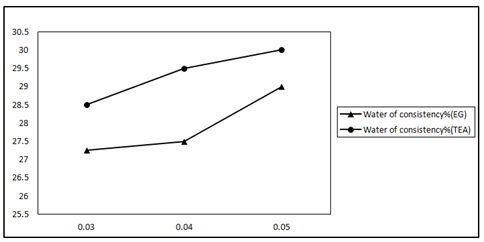
Figure 1 Water of consistency (%) of EG and TEA with different doses (0.03, 0.04 and 0.05) of GA–glycol and amine based.
Setting times
Increasing the standard water of consistency in Portland cement pastes admixed with grinding aids leads to increase the initial and final setting times, Figure 2. The initial and final setting times for Portland cement pastes admixed with TEA were longer than those obtained for EG. This related to setting times describe the stiffening behavior of the cement paste. The results of setting time measurements for the cement mixes admixed with TEA increases both initial and final setting times. The increase in both initial and final setting times with the addition of TEA, confirms a retardation effect for TEA at this level of addition.14 The initial and final setting time increased gradually with the use of higher GA concentration of TEA. It is well established that the setting of cement is a percolation process in which isolated or weakly bound particles are connected together by the formation of hydration products when mixed with water.5 While in presence of EG, it was observed that the initial and final setting time decreased gradually with the use of higher GA concentration, this may be due to the increase in the finesse of the cement which fast its hydration.
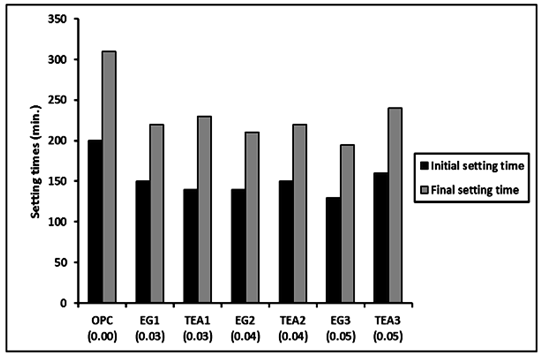
Figure 2 Initial and final setting time of EG and TEA at different doses (0.03, 0.04 and 0.05) of GA-EG and GA-TEA.
Compressive strength of mortar specimens
The variation of the compressive strength values for mortar specimens made from OPC, sand and admixed with EG and TEA after 2, 7, 28 and 90 days are shown in Figure 3 and Figure 4 respectively. The control mortar paste shows three stages of strength development with increasing the hydration ages up to 90days. A rapid increase in the compressive strength values is noticed during the first 7days of hydration which represents the acceleration stage. This is followed by a continuous and gradual increase up to 28days. A slow increase in the compressive strength values noticed during the hydration period from 28 to 90days. Mortar specimens admixed with EG glycol or TEA, showed the same trend of variation of compressive strength values with the hydration ages but with relatively higher values. The increase in the compressive strength values due to presence of grinding aids were evaluated via calculation of relative compressive strength. According to the values of the relative strength both triethanol amine (TEA) and ethylene glycol (EG) showed an increase in the relative strength values at all the hydration ages indicating the presence of the grinding aids causes an enhancement in the mechanical properties of hardened mortar. Moreover, the values of the relative strength increase with increasing the dose of the grinding aid which is more notable at early hydration ages, up to 7days, than the later ages. The improvement in relative strength due to presence of GAs may be attributed to increasing the cement fineness which leads to an increase in the degree of cement hydration, as well as to improvement in the interfacial transition zone between the cement paste and sand particles, thus resulting in increased strength.24 TEA can form chelates with Ca2+ and Fe2+ and hence facilitate the dissolution rate of various phases in cement and the early hydration rate of C3A and C4AF6 thus TEA increase the 28-day compressive strength higher than that of EG. Beside, at a dosage of 0.015%, TEA is accelerating both the hydration of C3S and C3A and thus contributes in increasing of strength. The increase in the compressive strength values due to presence of grinding aids were evaluated via calculation of relative compressive strength. According to the values of the relative strength both tri ethanol amine (TEA) and ethylene glycol (EG) showed an increase in the relative strength values at all the hydration ages indicating the presence of the grinding aids causes an enhancement in the mechanical properties of hardened mortar, see Table 3. Moreover, the values of the relative strength increase with increasing the dose of the grinding aid which is more notable at early hydration ages, up to 7 days, than the later ages. The improvement in relative strength due to presence of GAs may be attributed to increasing the cement fineness which leads to an increase in the degree of cement hydration, as well as to improvement in the interfacial transition zone between the cement paste and sand particles, thus resulting in increased strength.24
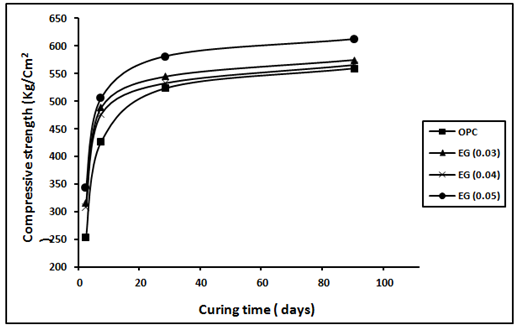
Figure 3 Compressive strength (kg/cm2) of the hardened cement mortars made of mixes OPC and OPC with (0.03, 0.04 and 0.05) of TEA against curing time.
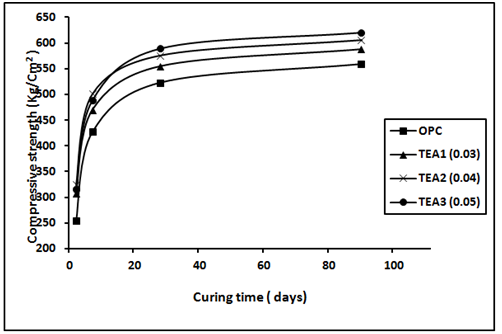
Figure 4 Compressive strength (kg/cm2) of the hardened cement mortars made of mixes OPC and OPC with (0.03, 0.04 and 0.05) of EG against curing time.
Mixes |
Relative compressive strength (%) |
|||
2 d |
7 d |
28 d |
90 d |
|
EG1 |
124.3 |
114.5 |
104.2 |
102.9 |
EG2 |
121.2 |
111.7 |
101.9 |
101.3 |
EG3 |
134.9 |
118.5 |
111.1 |
109.5 |
TEA1 |
120.4 |
110.1 |
106.1 |
105.2 |
TEA2 |
127.5 |
117.3 |
110.1 |
108.4 |
TEA3 |
123.9 |
114.5 |
112.8 |
111.1 |
Table 3 Relative compressive strength of OPC mixes with different doses of ethylene glycol and tri ethanol amine.
X-Ray diffraction analysis (XRD)
The main hydration products of the hardened cement OPC mortars are mainly microcrystalline calcium silicate hydrate (CSH), beside, calcium hydroxide or portalndite (CH) and calcium aluminate silicate hydrate (CASH). In addition, the peaks characterized to unhydrated OPC phases like alite phase (C3S), belite phase (β-C2S) and quartz are noticed in XRD diffraction curves of OPC mortar mix after 2 and 7 days. The XRD diffractograms of the hardened mortar specimens of OPC admixed with (0.04wt. %) of triethanol amine (TEA) and ethylene glycol (EG) were investigated. Figure 5 and Figure 6 show XRD patterns of the investigated hardened OPC mortar presence of 0.04wt. % TEA and EG cured at 2, 7 and 90days of hydration age. They indicate that the main hydration products of the hardened cement OPC mortars admixed with tri ethanol amine (TEA, 0.04wt.%) and ethylene glycol (EG, 0.04wt. %) are microcrystalline calcium silicate hydrate (CSH) as well as the well crystallized calcium hydroxide (CH) and calcium aluminate silicate hydrate (CASH). The intensities of the peaks characterizing the hydration products, namely CSH and CH have higher values in TEA than that of the EG whether at early age or later age of which refer to the high reactivity of TEA at all ages of hydration that is attributed formation of relatively large quantity of CH at the later ages of hydration due to the progress of hydration with time.
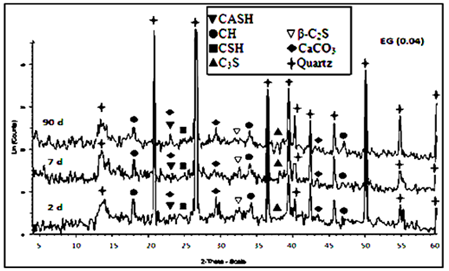
Figure 5 XRD patterns for hardened Portland cement OPC mortar with EG (0.04) after 2, 7, 90days of hydration.
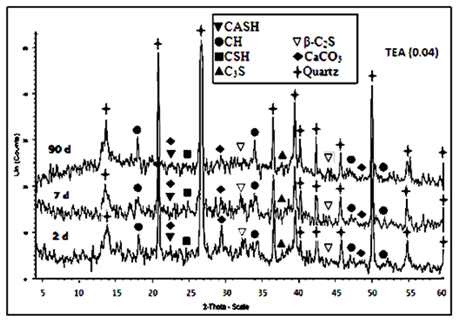
Figure 6 XRD patterns for hardened Portland cement OPC mortar with TEA (0.04) after 2, 7, 90days of hydration.
Differential thermal analysis (DTA)
DTA curves of the hardened mortar specimens made from 100% OPC and 100% OPC+0.04wt.% of EG and TEA (mixes OPC, EG2 and TEA 2 respectively) after 2, 7 and 90days, see Figure 7A-C. DTA curve of OPC mix after 2days of hydration, Figure 7A, shows three endothermic peaks at 55.07, 101.28 and 216.69ºC. The first and second peaks are characteristic to the removal of free water dehydration. The other peak located at 216.69ºC is due to dehydration of ettringite and amorphous and ill-crystalline calcium silicate hydrate CSH.25‒27 Other endothermic peaks were appeared at 477.67 and 576.46ºC, which are related to the dehydration of free calcium hydroxide or portalndite (CH) and α-β quartz transformation respectively.28 The endotherms that appeared from 711.65 to 895.24 are attributed to decomposition of calcium carbonate (CaCO3). After 7days of hydration, two endotherms could be clearly distinguished at 53.35 and 110.26ºC; these endotherms are attributed to the removal of free water. One endotherm peak can be observed at 317.92ºC that may due to the dehydration of CSH, calcium aluminate hydrate (CAH) and ettringite. The endotherm peak characterizing CH phase can be observed at 466.35ºC, appeared with higher intensity than 2days, this indicates that the amount of calcium hydroxide (CH) released during hydration reaction was increased due to the progress of hydration reaction with time. Another two endotherm peaks can be noticed at 576.77 and 693.26-893.26ºC that due to α-β quartz transformation and decomposition of calcium carbonate, respectively. After 28 days, evidently, the results of Figure 7Cdemonstrate mostly the same endotherms observed in Figure 7B. Only, two basic differences exists in case of 90days of hydration; the first is continuous increase in the intensity of the endotherm characterizing the CH phase with increasing age of hydration up to 90 days and the second is splitting of the first peak to three endotherms with higher intensities which are characterized to CSH and became more broadening and were shifted to higher temperatures.
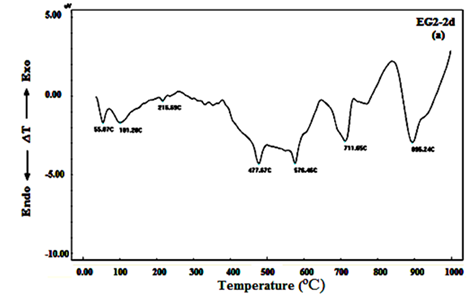
Figure 7A DTA curves of mortar specimens made from 100% OPC+0.04wt.% of EG after 2days of hydration.
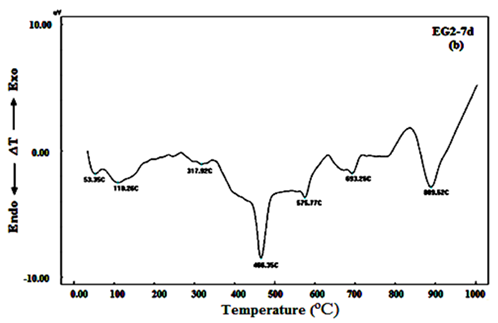
Figure 7B DTA curves of mortar specimens made from 100% OPC+0.04wt.% of EG after 7days of hydration.
Figure 7C DTA curves of mortar specimens made from 100% OPC+0.04wt.% of EG after 28days of hydration.
Figures 8A-C shows DTA thermograms of the hardened mortar specimens made from 100% OPC+0.04wt. % of TEA after 2, 7 and 90days. The thermograms of the hardened mortar paste after 2 days of hydration indicate the appearance of five main endotherms located at 98.16, 298.46, 473.76, 577.20ºC and 698.46-896.27ºC, see Figure 8A. The endotherm appeared at 98.16ºC is due to the removal of free moisture, while the endotherm located at 298.46ºC is due to dehydration of ettringite and calcium silicate hydrate (CSH), the endotherm located at 473.76ºC is attributed to the dehydration of free calcium hydroxide (CH). The endotherm appeared at 577.20ºC is mainly due to the α-β quartz transformation. Double endotherms could also be distinguished at the temperature range of 698.46-896.27ºC which represents the decomposition of calcium carbonate (CC) with different degrees of crystallinity. After 7days of hydration, Figure 8B showed the same endotherms observed in Figure 8A, the main differences observed are the existence of the first peak was splitted to three endotherms located at 55.73- 106.52 and 149.88ºC with higher intensities which are characterized to removal of water and dehydration of CSH respectively that became more broadening and were shifted to higher temperatures as well as the endotherm characterizing to CH was observed to be more sharper with higher intensities than that of observed at 2days of hydration. Figure 8C shows DTA thermograms of the hardened mortar specimens after 90 days of hydration, DTA curves indicate that the absorption peak of losing free water appears at 114.14ºC and the absorption peak at 144.77ºC is caused by removing water of C-S-H gel, the endotherm peak located at 274.55ºC is due to dehydration of ettringite (Aft) and mono sulfate hydrate (AFm). The absorption peak at 467.0ºC caused by removing structure water of Ca (OH)2 has higher intensities than observed at early ages (2 and 7days) see Fig.b23 (a& b) that refer to the progress of the hydration reaction at later ages of hydration, the absorption peak at about 576.06 and 673.93-888.43ºC is caused by α-β quartz transformation and decomposition of the nearly amorphous and crystalline CaCO3 respectively. Obviously, the DTA thermograms of TEA2 at the hydration ages (2, 7 and 90days) showed the endotherm peak characterizing of CH with higher intensities and shifted to higher temperatures than EG2 at the same hydration ages that indicates that TEA promotes hydration degree of cement at all hydration ages by accelerating hydration reaction that is attributed to TEA molecules easily combine with metal ions of cement minerals and form clathrate, which promote or induce hydration reaction of cement mineral and water, thus, the strength of cementitious materials can be observed. Because DTA analysis can reflect the hydration product types of cement and the hydration product in heating process, and the hydration degree of cement paste is determined according to the change of thermogravimetry, evidently, DTA thermograms could show the TEA effect on the cement strength enhancement at dose 0.04wt. % if it compare with EG at the same dose that emphasizes the compressive strength results.
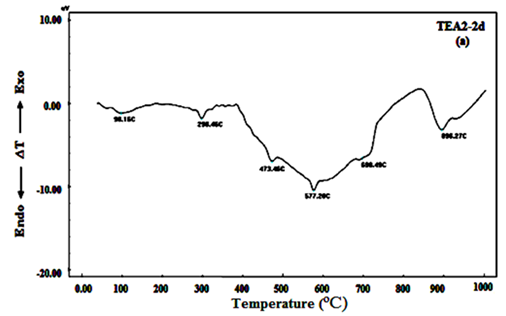
Figure 8A DTA curves of mortar specimens made from 100% OPC+0.04wt.% of TEA after 2days of hydration.
The effect of addition of various grinding aids on the microstructures of hardened Ordinary Portland cement mortars are studied using scanning electron microscope (SEM). The microstructure of some selected hardened mortar specimens made ordinary Portland cement in presence and absence of ethylene glycol or triethanol amine was studied using scanning electron microscope (SEM). Figures 9‒11 show the micrographs of hardened mortars made from OPC, OPC+0.04 wt.% ethylene glycol and OPC+ 0.04 wt.% triethanol amine after 2 and 90 days of hydration. The SEM micrographs of hardened mortar specimens made from OPC (control mix) after 2 days of hydration, Figure 9 show partial covering of unhydrated cement phases and the sand particles with hydration products mainly ill crystalline and amorphous calcium silicate hydrates (CSH). After 90 days of hydration, SEM micrographs for OPC mortar show a more compact structure with low porosities in which the ill-crystalline calcium silicates hydrate (CSH) fill the micro pores and connect between the sand particles. This displays the progress of the hydration reaction of OPC mortar. In addition, platy crystals of Portlandite; Ca(OH)2 , are clearly appeared in SEM micrographs. Figure 10A, B shows SEM micrographs of EG2 after 2 days of hydration. According to these micrographs, the main hydration products formed are amorphous calcium silicate hydrates and large amounts of calcium hydroxide crystals. These hydration products participate in the pores and voids and cover the unreacted cement phases and the sand particles leads to compact structure of high compressive strength. After 90days, SEM micrographs of EG2 show compact structure which indicates the formation of the hydration products was continued to produce a massive structure of improved compressive strength. SEM micrographs of TEA2 specimens after 2 and 90 days are given in Figure 11A, B. Similar results are observed for SEM micrographs of TEA2 after 2 days of hydration as EG2 mix. Nearly amorphous CSH is the main hydration products beside calcium hydroxide for TEA2 specimens after 2 days of hydration. Also the formation of higher amounts of these hydration products confirms the acceleration effect to the hydration reaction occur due to presence of TEA. This acceleration to the degree of hydration is continued to 90days as observed in SEM micrographs.
Figure 10 SEM micrographs of mortar speciemen made from (OPC+0.04EG) after 2 and 90days of hydration.
None.
The author declares that there are no conflicts of interest.

©2019 Hashem, et al. This is an open access article distributed under the terms of the, which permits unrestricted use, distribution, and build upon your work non-commercially.