International Journal of
eISSN: 2475-5559


Research Article Volume 3 Issue 4
1National Engineering School, University of Monastir, Tunisia
2National Engineering School, University of Monastir, Tunisia
Correspondence: Khalifa Mejbri, National Engineering School, University of Monastir, Av. Ibn El Jazzar, 5000 Monastir, Tunisia, Tel (+216) 53782393
Received: May 01, 2018 | Published: October 25, 2018
Citation: Mejbri K, Bellagi A. Modeling of the thermodynamic properties of the methylamine/water refrigerant mixture. Int J Petrochem Sci Eng. 2018;3(5):161-170. DOI: 10.15406/ipcse.2018.03.00090
This paper presents the prediction of the phase behavior of methylamine/water refrigerant mixture. To do so, two equations of state were investigated: PC-SAFT and GEOS. The adjustable specific parameters of pure fluids are determined by regression of vapor pressure and saturated liquid and vapor density data. The calculations show that the GEOS model predicts more accurately the thermodynamic properties of pure fluids, in particular in the vicinity of the critical point. For binary mixtures, the cross-interaction parameters are obtained by regression of the vapor-liquid equilibrium data available in the literature. The comparison between predicted and experimental data reveals that both investigated EOS have comparable performance with slight superiority to GEOS when approaching the critical temperature of methylamine. Finally, since the GEOS model is more mathematically tractable and more accurate when applied to pure fluids, it is adopted for the correlation and prediction of the thermodynamic properties of the methylamine/water system.
Keywords: methylamine, water, thermodynamic, properties, equations, PC SAFT, GEOS
Absorption refrigeration machines represent a promising solution in order to circumvent the increase in electric power consumption due to air-conditioning and refrigeration particularly in the summer period. This technique for the production of cold exhibits some interesting advantages. By using heat as driving energy, such that released by the combustion of natural gas or LPG, it is possible to by-pass the usage of electric power. Moreover, this method allows the valorization of the thermal emissions of intermediate temperatures. The electric power needed is marginal (i.e., essentially for circulation pumps and control systems). However, the absorption cycles are much more complex in comparison to the vapor compression machines. On the energy performance level, the single-effect absorption refrigeration chillers present a COP (between 0.5 and 0.7) lower than its counterpart obtained with the vapor compression systems, even when brought back to the primary energy. Hence, the absorption technique for production of cold is not energy efficient. However, this concern becomes secondary if the supplied driving heat is inexpensive (e.g., heat from thermal discharges or from thermal solar energy plants). Under these circumstances, the absorption refrigeration may well constitute a viable alternative to the vapor compression systems. During last decades, many studies in this field have focused on the standard systems water-ammonia and water-LiBr solutions and theoretical and experimental investigations of other alternative working fluids. This quest was aimed at the development of techniques, which improve absorption systems performance and make them economically competitive when compared to the conventional compression vapor systems.1–21 The absorption heat transformers are also investigated with interest for waste-heat reutilization within industrial processes, due to their favorable economics and mild environmental effects.22–28
The thermal performance of an absorption refrigeration system is greatly dependent on the physical and chemical properties of the working fluids used.29–31 Up to now, only two refrigerant mixtures, NH3-H2O and LiBr- H2O, are widely employed in commercialized absorption chillers. However, these working fluids present some limitations. Firstly, the LiBr- H2O system works at high vacuum levels, which are difficult to maintain. Secondly, this mixture cannot be used for air-cooled units under high ambient air temperatures due to salt crystallization.32–34 Further, with water as refrigerant temperatures lower than 0°C are not possible. On the other hand, the NH3-H2O mixture is such that the boiling temperature difference between the absorbent (water) and refrigerant (ammonia) of is not sufficiently large, which makes necessary a rectification step at the exhaust of the boiler to ensure the required purity of the desorbed ammonia. In addition, the driving heat has to be supplied to the generator at a high temperature of about 180°C. In order to circumvent the limitations of the NH3-H2O system, a large number of studies has focused on the search for alternative and more appropriate fluid mixtures.35–37 The looked-for working fluid system should exhibit the desired properties in particular keep the condenser pressure at the lowest possible level above one bar, allowing low generator temperatures, and hence making the use of low-grade thermal sources as driving heat. A potential candidate is water/methylamine system with methylamine replacing ammonia as refrigerant. It has been found that the thermodynamic properties of the methylamine–H2O mixture are interesting for application in absorption refrigeration.38–40 Vapor pressures and driving temperatures data indicate that thermal energy sources at low temperatures may be used (e.g., solar, geothermal and waste heat of industrial and commercial processes). However, methylamine is a refrigerant that has been poorly investigated in the literature. Indeed, property data for the pure fluid and its solutions with several solvents are scarcely reported in the literature. Some thermodynamic properties of methylamine–H2O mixtures are found in references,41–51 occasionally expressed in empirical expressions for each property. Even, if such relations reproduce fairly the experimental data,40 the thermodynamic consistency of the calculated properties from different relations is not ensured.
Coherent prediction of thermodynamic properties of refrigerant mixtures is of primordial importance for the reliable design of absorption refrigeration machines. The objective of present study is to develop, basing on the scarce published data for methylamine/water system, a reliable thermodynamic model for predicting and calculating phase equilibria and for the design and dimensioning of absorption refrigerating machines relevant properties of the mixture. The proposed models should possess a sufficient accuracy over a wide range of conditions and involve a minimum number of adjustable and easily accessible parameters. The equations of state (EOS) represent the best choice for this purpose; in fact, all the thermodynamic properties can be consistently derived from an EOS when it expresses a thermodynamic potential. In the following, two EOS models will be investigated and compared: PC-SAFT and GEOS. The PC-SAFT (Perturbed Chain Statistical Associating Fluid Theory) equation of state is based on a theoretical approach. Applying the Barker-Henderson perturbation theory to a reference hard-chain fluid, a valuable variant of the original SAFT model52–53 is obtained and applied to correlate asymmetric, highly non-ideal, and associating fluids.54–62 The general cubic equation of state GEOS considered in the present paper is a semi-empirical approach.63–67 GEOS is a four-coefficient cubic EOS that permits the critical compressibility factor adjustment, ZC, instead of the prediction of a universal value. Hence, the saturation property predictions for polar compounds and their mixtures are improved due to this added flexibility. The predictions of thermodynamics properties by both investigated models will be confronted to their corresponding experimental data. This will shed light to which EOS is more appropriate and accurate in the correlation and prediction of the thermodynamic properties of the methylamine/water mixture in wide ranges of temperature and pressures comprising the typical operating domain of absorption refrigeration cycles.
PC-SAFT equation of state
In the Perturbed Chain SAFT (PC–SAFT) equation of state, the fluid molecules are considered a shard chains of spherical segments with interaction potential divided into
The repulsive contribution is modeled with a hard chain reference fluid in which no attractions are present. The contributions describing the hard chain term and the association interaction are expressed identically to those embedded in the original SAFT EOS. Whereas, a perturbation-theory of second order is applied to the hard–chains instead of hard-spheres to modify the dispersion-term. This allows us to account for the effect of the non-spherical shape of the molecules on the number of intermolecular interactions. Thus, the dispersion term is a function of segment number m. Accordingly the molar reduced Helmholtz free energy is expressed as the sum of a reduced ideal gas contribution aOaO and a reduced residual contribution (arar ). The latter is composed of three terms: ahcahc , adispadisp and aassocaassoc corresponding to hard-chain, dispersion and association interactions, respectively:54–58
a=ART=aο+ar=aο+ahc+adisp+aassoca=ART=aο+ar=aο+ahc+adisp+aassoc (1)
In the PC–SAFT EOS, each non-associating compound in the mixture is characterized by three pure–component parameters (the segment number mi, the segment diameter σi, and the dispersion energy parameter εi/kεi/k .The average segment number of a mixture, ˉm¯¯¯m is estimated from the segment numbers of its components, mi, as follows:
ˉm=∑iximi¯¯¯m=∑iximi (2)
The segment diameter,σij , and dispersive energy, εij/kεij/k for a pair of unlike segments are obtained by the conventional Berthelot–Lorentz combining rules:
σij=12(σi+σj)σij=12(σi+σj) (3)
εijk=(1−kij)√εikεjkεijk=(1−kij)√εikεjk (4)
where Kij is an adjustable binary parameter introduced to correct cross–dispersive interactions.
To give more flexibility to this model in predicting methylamine/water system properties, Reid-Panagiotopoulos mixing rule depending on composition is applied and Equation (4) is replaced by:59–61
εijk=[1−kij+(kij−kji)xi]√εikεjkεijk=[1−kij+(kij−kji)xi]√εikεjk (5)
εijk=[1−kij+(kij−kji)xi]√εikεjkεijk=[1−kij+(kij−kji)xi]√εikεjk (6)
Where kjikji and kjikji are two adjustable empirical binary cross-interaction parameters.
Association contribution
Basing on Wertheim’s first–order perturbation theory, Chapman et al.52,53 proposed an association model to represent the interactions due to the short–range association (hydrogen bonding) aassocaassoc . This model is retained in this paper. Basing on this theory, a molecule is supposed to have one or more association sites that can form hydrogen bonds. Two additional pure-component parameters, the association energy, εAiBi/kεAiBi/k and the effective association volume, K(AiBi)K(AiBi) are used to characterize the associating interactions between unlike association sites Ai and Bi. Hence, a self-associating substance is modeled with five pure–component parameters. The association-site number on a molecule and the potential site–site interactions have a powerful influence on the fluid structure, and consequently on the phase equilibria. Thus, a careful chose should be considered. The reduced association Helmholtz free energy of a mixture can be written as a mole fraction weighted linear combination of the free energies of the pure components:59–62
aassoc=∑ixi[∑Ai(lnXAi−XAi2)+Mi2]aassoc=∑ixi[∑Ai(lnXAi−XAi2)+Mi2] (7)
where XAi is the mole fraction of molecules i that are not bonded at site A. The monomer fractions XAi of the components of the mixture are calculated by resolving of the non–linear system of equations:
XAi=(1+NAvρ∑jxj∑BjXBjΔAiBj)−1XAi=(1+NAvρ∑jxj∑BjXBjΔAiBj)−1 (8)
The summation ∑Bjcovers all sites on molecule j and ∑j all components of the system. ΔAiBjΔAiBj represents the association bond strength between sites A and B on molecules i and j, respectively. ΔAiBjΔAiBj is expressed as a function of the association volume, κAiBjκAiBj the association energy, εAiBjkTεAiBjkT and the radial distribution function,ghsij(dju)ghsij(dju) , as follows:
ΔAiBj=σ3ijκAiBjghsij[exp(εAiBjkT)−1]ΔAiBj=σ3ijκAiBjghsij[exp(εAiBjkT)−1] (9)
The cross–association interaction coefficients between two different associating components can be expressed with pure–component parameters using the following simple combining-rules:
εAiBjkb=√εAiBikεAjBjkεAiBjkb=√εAiBikεAjBjk (10)
κAiBj=√κAiBiκAjBjκAiBj=√κAiBiκAjBj (11)
Resolution of the association term
The calculation of self-associating compounds properties requires the aassocaassoc term and its derivatives with respect to molar density, temperature and molar fractions. Prior to the determination of aassocaassoc for a pure component, the definition and specification of all non–zero site–site interactions must be given. Solely not vanishing values of ΔABΔAB are used to calculate the monomer fractions,XAXA In general, equations (6) are not XA−XA− -explicit. In order to simplify their resolution, some approximations, aimed to reduce the number of adjustable parameters, are considered:52–53
The association strength ΔΔ is set equal to zero for like atom interactions (e.g., oxygen-oxygen, hydrogen-hydrogen), and symmetrical for unlike atom interactions.
For a specific fluid, the monomer fractions XAXA are equal (XA=XB=....=X)(XA=XB=....=X) .
The monomer fraction X for a pure compound exhibiting two associating sites becomes:
X=(−1+√1+4NAvρΔ)/(2NAvρΔ)X=(−1+√1+4NAvρΔ)/(2NAvρΔ) (12)
In the case of four associating sites it writes:
X=(−1+√1+8NAvρΔ)/(4NAvρΔ)X=(−1+√1+8NAvρΔ)/(4NAvρΔ) (13)
For mixtures composed of self and cross-associating components, the monomer fractions Xi for all associating compounds can be simultaneously evaluated iteratively from the system of equations (6) and considering the above given assumptions.59, 61, 62
For the binary methylamine/water mixture investigated in this paper, X1 and X2are evaluated by solving the equation system:61,62
x1NAvρΔ11X21+(1+2 x2NAvρΔ12 X2)X1−1=0x1NAvρΔ11X21+(1+2 x2NAvρΔ12 X2)X1−1=0 (14)
2 x2NAvρΔ22X22+(1+x1NAvρΔ12 X1)X2−1=02 x2NAvρΔ22X22+(1+x1NAvρΔ12 X1)X2−1=0 (15)
Methylamine (component 1) is modeled with a 2B-association-scheme and water (component 2) is represented with a 4C-association-scheme. Once the fractions XiXi determined, their derivatives with respect to their different variables (temperature, molar density and molar compositions xi) are evaluated as well as the contribution of the association interactions. The thermodynamic properties of a system can be derived from the reduced Helmholtz free energy with the flowing relations:59
P=RTρ[1+ρ(∂ar∂ρ)T,xi]P=RTρ[1+ρ(∂ar∂ρ)T,xi] (16)
lnφk=ar+(∂ar∂xk)T,ρ,xi≠k−∑cj=1xj(∂ar∂xj)T,ρ,xi≠j+(Z−1)−lnZlnφk=ar+(∂ar∂xk)T,ρ,xi≠k−∑cj=1xj(∂ar∂xj)T,ρ,xi≠j+(Z−1)−lnZ (17)
h(T,P,xi)RT=hο(T,xi)RT−T(∂ar∂T)ρ,xi+(Z−1)h(T,P,xi)RT=hο(T,xi)RT−T(∂ar∂T)ρ,xi+(Z−1) (18)
s(T,P,xi)R=sο(T,P,xi)R−ar−T(∂ar∂T)ρ,xi+lnZs(T,P,xi)R=sο(T,P,xi)R−ar−T(∂ar∂T)ρ,xi+lnZ (19)
GEOS cubic equation of state
The used GEOS is a general four-parameter cubic equation of state:63–67
P=RTˉV−b−a(ˉV−d)2+c=RTρ1−bρ−aρ2(1−dρ)2+cρ2P=RT¯¯¯V−b−a(¯¯¯V−d)2+c=RTρ1−bρ−aρ2(1−dρ)2+cρ2 (20)
For a pure fluid, the four coefficients a, b, c and d are expressed as follows:
a=ΩaR2T2CPC(α(Tr))2 ; b=ΩbRTCPCa=ΩaR2T2CPC(α(Tr))2 ; b=ΩbRTCPC (21)
c=ΩcR2T2CP2C ; d=ΩdRTCPCc=ΩcR2T2CP2C ; d=ΩdRTCPC (22)
Let TrTr ,PrPr and ρrρr represent the reduced variables, and ξc is the calculated value of the critical compressibility factor, respectively. At the critical point we have:
Pr=1 ; (∂Pr∂ρr)Tr=0Pr=1 ; (∂Pr∂ρr)Tr=0 (23)
(∂2Pr∂ρ2r)Tr=0 ; αc=(∂Pr∂Tr)ρr(∂2Pr∂ρ2r)Tr=0 ; αc=(∂Pr∂Tr)ρr (24)
αc is the Riedel’s criterion.
At the critical point,Tr=1Tr=1 and Pr=1Pr=1 he expressions for the constants Ωa,Ωb,Ωc;and Ωdare then:
Ωa=(1−B)3 ; Ωb=ξc−BΩa=(1−B)3 ; Ωb=ξc−B (25)
Ωc=(1−B)2(B−0.25) ; Ωd=ξc−1−B2Ωc=(1−B)2(B−0.25) ; Ωd=ξc−1−B2 (26)
B=1+γ1αc+γ1B=1+γ1αc+γ1 (27)
For the attractive term, the temperature-dependent alpha function is defined as:
α(Tr)=1+γ1y+γ2y2+ γ3y3 , for Tr≤1α(Tr)=1+γ1y+γ2y2+ γ3y3 , for Tr≤1 (28)
α(Tr)=1+γ1y , for Tr>1α(Tr)=1+γ1y , for Tr>1 (29)
y=1−√Try=1−√Tr (30)
where γ1, γ2 and γ3 are component-specific adjustable parameters. The experimental values of the critical constants and the accentric factor are used in order to deduce the Riedel factor αc from the relation:
αc=5.808+4.98 ωαc=5.808+4.98 ω (31)
Thus, in this model, a pure fluid is characterized by 4 adjustable parameters: γ1, γ2, γ3 and ξc.
The mixing rules for mixtures are:
a=∑i∑jxixjaija=∑i∑jxixjaij (32)
aij=[1−kij+(kij−kji)xi]√aiaj , kii=kjj=0aij=[1−kij+(kij−kji)xi]√aiaj , kii=kjj=0 (33)
b=∑i∑j(1−λij)xixj(bi+bj2) , λij=λjib=∑i∑j(1−λij)xixj(bi+bj2) , λij=λji (34)
c=±∑i∑j(1−υij)xixj√cicj , υij=υjic=±∑i∑j(1−υij)xixj√cicj , υij=υji (35)
d=∑ixidid=∑ixidi (36)
In equation (35), we use the sign “+” for ci when cj> 0, and the sign “‒” for ci when cj< 0. Negative values are more common for pure compounds. Then, four adjustable binary cross-interaction parameters are introduced for a binary system: kijkij ,kjikji , λijλij andvijvij
The fugacity coefficient of component j is deduced from a cubic equation of state using the following relation:
lnφj=−1RTˉv∫∞[(∂P∂nj)T,V,ni≠j−RTˉV]dˉV−lnZlnφj=−1RT¯v∫∞[(∂P∂nj)T,V,ni≠j−RT¯¯¯V]d¯¯¯V−lnZ (37)
The reduced molar enthalpy and entropy write as follows:
H(T,P,xi)RT=Hο(T,xi)RT+1RTv∫∞[T(∂P∂T)V,ni−P]dˉV+Z−1H(T,P,xi)RT=Hο(T,xi)RT+1RTv∫∞[T(∂P∂T)V,ni−P]d¯¯¯V+Z−1 (38)
S(T,P,xi)R=Sο(T,P,xi)R+1Rˉv∫∞[(∂P∂T)V,ni−RˉV]dˉV+lnZS(T,P,xi)R=Sο(T,P,xi)R+1R¯v∫∞[(∂P∂T)V,ni−R¯¯¯V]d¯¯¯V+lnZ (39)
Detailed expressions of these thermodynamic properties are given in appendix B.
Ideal-gas properties
The properties of the reference perfect gas mixture of methylamine/water are modeled with the reduced Helmholtz free-energy of a mixture of ideal gases (aοin Eq. (1)) which is derived from those of the pure ideal-gas of methylamine and water,aο01aο01 and aο02aο02 , respectively. They are combined at constant temperature T and constant pressure P according to:
aο(T,ρο,x)=xaο01(T,ρο)+(1−x) aο02(T,ρο)+xlnx+(1−x) lnxaο(T,ρο,x)=xaο01(T,ρο)+(1−x) aο02(T,ρο)+xlnx+(1−x) lnx (40)
The term xlnx+(1−x) lnxxlnx+(1−x) lnx results from the mixing entropy of the mixture of ideal gases. The ideal-gas molar density is For a pure ideal-gas, the molar free energy writes:
Aο(T,ρο)=Uο0−TSο0+T∫T0CοV(T)dT−TT∫T0CοV(T)TdT+RTln(ρορ0)Aο(T,ρο)=Uο0−TSο0+T∫T0CοV(T)dT−TT∫T0CοV(T)TdT+RTln(ρορ0) (41)
The molar isochoric heat capacity CοVCοV of a pure ideal gas is expressed as polynomial temperature-dependent function according to:
CοV(T)=θ0+θ1T+θ2T2+θ3T3CοV(T)=θ0+θ1T+θ2T2+θ3T3 (42)
In this work, the arbitrary reference state of the pure fluid is chosen to be the perfect-gas state at reference temperature T0T0 and pressure P0P0 , and consequently the reference molar density is ρο0=P0/(RT0)ρο0=P0/(RT0) . The arbitrary values of the reference molar internal energy Uο0Uο0 and molar entropy Sο0Sο0 of pure fluid are chosen in order to set HL=0HL=0 and SL=0SL=0 for saturated liquid at the triple-point state of the pure compounds (i.e., 179.70 K for methylamine and 273.16 K for water). The perfect-gas coefficients of the Helmholtz free energy are summarized in Table 1 for both pure methylamine and water. The detailed expressions of AοAο , HοHο and SοSο of a binary mixture are given in the appendix A.
Coefficient |
Methylamine |
Water |
TOTO |
179.70 K |
273.16 K |
POPO |
1.01325 bar |
1.01325 bar |
ρooρoo |
44.522 mol/m3 |
67.816 mol/m3 |
UooUoo |
34209.05 J/mol |
44384.25 J/mol |
UooUoo |
33241.41 J/mol |
43786.03 J/mol |
SooSoo |
134.33 J/(mol K) |
120.13 J/(mol K) |
SooSoo |
130.48 J/(mol K) |
118.21 J/(mol K) |
θoθo |
21.6519 |
26.5514 |
θ1θ1 |
2.03E-02 |
-1.54E-02 |
θ2θ2 |
2.73E-04 |
4.42E-05 |
θ3θ3 |
-2.70E-07 |
-2.42E-08 |
Table 1 Coefficients of the ideal-gas part of the Helmholtz free energy, Eqs. (41-42)
Estimation of pure-component parameters
Adjustable pure-component parameters in the investigated equations of state are evaluated by simultaneously fitting data of vapor pressure, liquid and vapor density at saturation. For this purpose, the following objective function is minimized: S1=∑Nj=1[(Pexpj−PcaljPexpj)2+(ρexpL,j−ρcalL,jρexpL,j)2+(ρexpV,j−ρcalV,jρexpV,j)2]S1=∑Nj=1[(Pexpj−PcaljPexpj)2+(ρexpL,j−ρcalL,jρexpL,j)2+(ρexpV,j−ρcalV,jρexpV,j)2] (43)
where N represents the number of used experimental data. Vapor-liquid equilibrium data for water are retrieved from,70 and for mono-methylamine from41,71-73 A Fortran program based on the generalized least squares subroutine ODRPACK68 and the non-linear equations solver CONLES69 is developed for the numerical regression of the literature data. The vapor-liquid phase behavior of a pure fluid are calculated, at a fixed temperature value T, by solving a system of two non-linear equations: chemical potential and pressure equalities. This calculation yields the values of the saturated liquid and vapor molar densities ρcalLρcalL and ρcalvρcalv .
Table 2 & Table 3 summarize the pure-component parameters along with the absolute average deviations AADs for (1) vapor pressure (ΔP), (2) saturated liquid density (ΔρL) and (3) saturated vapor density (ΔρV) data, respectively, for PC-SAFT and GEOS models. As can be noted, the GEOS is more accurate than PC-SAFT model in the correlation of the saturation pressures and the liquid and vapor densities of water. For methylamine, the two investigated models have comparable performances in terms of vapor pressure predictions. However, the PC-SAFT model correlates more precisely the methylamine saturated liquid densities than the GEOS equation of state. Figure 1 illustrates the pressure-density diagram for the saturated phase equilibria for H2O. It is clear that the GEOS cubic EOS is more accurate than the PC-SAFT equation in the correlation of the saturated liquid and vapor phases; especially in the vicinity of the critical state. The enthalpy of vaporization of water is represented in Figure 2 from triple point to critical point. A comparison of the literature data to the theoretical curves shows that the GEOS model is in excellent concordance with data, particularly for high temperatures and pressures. The PC-SAFT model over-estimates the critical point and consequently fails to correlate the properties of pure fluids in the vicinity of the critical region.
Substance (M)a |
m |
σ |
ε/k |
εAB/k |
κAB |
ΔP |
ΔρL |
ΔρV |
T range |
Ref. |
|---|---|---|---|---|---|---|---|---|---|---|
(Å) |
(K) |
(K) |
(%) |
(%) |
(%) |
(K) |
||||
water (4C) |
2.74675 |
2.02523 |
129.21 |
1758.9 |
0.329059 |
1.9 |
2.5 |
3.77 |
273.2−647.1 |
|
methylanine (2B) |
2.58863 |
2.84134 |
212.51 |
1023.6 |
0.009359 |
0.23 |
1.56 |
179.7−430.1 |
Table 2 Pure-component parameters for the PC-SAFT equation of state
Tc |
Pc |
ω |
ξc |
γ1 |
γ2 |
γ3 |
ΔP |
ΔρL |
ΔρV |
T range |
Ref. |
|
Substance |
(K) |
(bar) |
(%) |
(%) |
(%) |
(K) |
||||||
water |
647.09 |
220.64 |
0.3443 |
0.24745 |
0.40394 |
0.77444 |
-1.01883 |
0.58 |
1.68 |
1.42 |
273.2−647.1 |
|
methylanine |
430.05 |
74.2 |
0.2017 |
0.27273 |
0.34741 |
0.86109 |
0.00126 |
0.28 |
2.71 |
179.7−430.1 |
Table 3 Pure-component parameters for the GEOS equation of state
Vapor-liquid phase behavior of methylamine/water mixture
A bank of N = 183 bibliographical experimental vapor-liquid phase equilibria data for the methylamine/water (Temperature range: 251−423 K and pressure range: 0.009−28.72 bar) has been constituted and exploited to deduce the binary cross-interaction parameters in the PC-SAFT and GEOS equations of state. The same FORTRAN program is used for the calculation of the two-phase vapor-liquid equilibria and the regression of the adjustable binary cross-interaction parameters. For a binary mixture, at fixed values of temperature T and mole fraction of the liquid phase x (or the vapor phase y), the vapor pressure P and molar composition of the vapor phase y (or the liquid phase x), as well as the saturated liquid molar density and the saturated vapor molar density are computed by solving a set of 4 algebraic equations (2 chemical potential and 2 pressure equalities). The binary cross-interaction parameters are determined by the minimization of the relative difference between literature data and theoretical values of vapor pressure and vapor mole composition:
S2=∑Nj=1[(Pexpj−PcaljPexpj)2+wi(yexpj−ycaljyexpj)2]S2=∑Nj=1[(Pexpj−PcaljPexpj)2+wi(yexpj−ycaljyexpj)2] (44)
whereN is the number of experimental data used in the regression and wi is a weighting coefficient for the relative deviations of the molar vapor composition. Regardless of the type of the experimental data, wi = 0 when only (T,P,x) or (T,P,y) values are available and wi = 1 when (T,P,x,y) values are available.
The optimized values of the binary cross-interaction parameters along with the absolute average deviations AAD for (1) vapor pressures (ΔP) and (2) molar compositions of the vapor phase are given in Table 4 for both thermodynamic models. As can be observed, the two equations of state correlate similarly the vapor pressure data. However, the GEOS (Δy = 0.6%) reproduces more accurately the molar composition data of the vapor phase than the PC-SAFT (Δy = 1.2%). In Figure 3 & Figure 4 are depicted the P-T curves of methylamine/water system at different values of the molar and mass fractions (Oldham or Dühring diagrams), respectively. As can be noted, both equations of state correlate comparably well the experimental data. The partial pressures of methylamine are estimated by the two investigated equations of state and compared to the experimental counterpart,41 as illustrated in Figure 5. Both models give globally similar predictions of partial pressures with a slight superiority to the GEOS equation of state.
|
KijKij |
λijλij |
νijνij |
ΔP |
Δy |
T range |
N |
Ref. |
|
|---|---|---|---|---|---|---|---|---|---|
EoS |
K12K12 |
K21K21 |
|
|
(%) |
(%) |
(K) |
|
|
PC-SAFT |
-0.10765 |
-0.31874 |
|
|
9.08 |
1.22 |
256−423 |
183 |
40–51 |
GEOS |
0.08254 |
-0.20682 |
0.14827 |
-0.03583 |
9.38 |
0.60 |
256−423 |
183 |
40–51 |
Table 4 Binary cross-interaction parameters for the PC-SAFT and GEOS equations of state
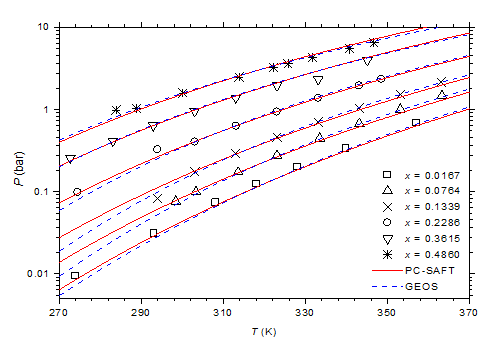
Figure 3 P-T-x diagram of methylamine/water mixture. Comparison of experimental data41 to calculated curves with GEOS and PC-SAFT models.
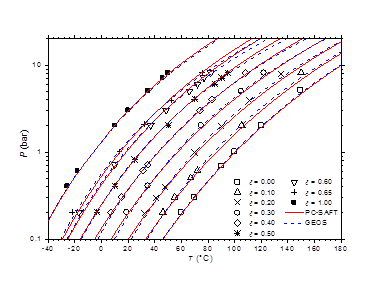
Figure 4 P-T-ξ diagram of methylamine/water mixture. Comparison of experimental data40 to calculated values with GEOS and PC-SAFT models.
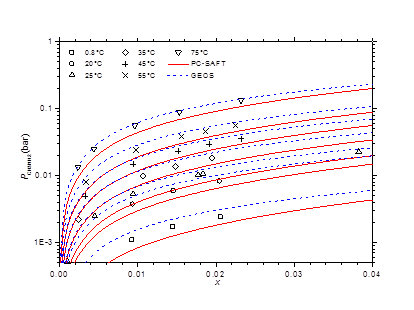
Figure 5 Partial pressures of methylamine via molar liquid fraction at different isotherms. Comparison of experimental data41 to theoretical values with GEOS and PC-SAFT.
The isobaric vapor-liquid phase equilibrium diagram at atmospheric pressure is illustrated in Figure 6. It is found that the theoretical curves of both EOS are very similar and reproduce with good accuracy the experimental dew point data in the entire composition range. However, the experimental bubble point data are offset from the calculated curves for molar liquid fractions lower than 0.2. The vapor-liquid phase equilibrium isotherms at different temperatures in the range of 303-383 K are illustrated in Figure 7-9. It can be concluded that the two models are similar and reproduce well the experimental data. A slight superiority is noted for the GEOS equation of state at high temperatures (near the critical temperature of methylamine) as can be seen for the isotherm 383.15 K for example. The enthalpy-composition-temperature (h-ξ-T) diagram of the saturated liquid phase of the methylamine/water system is represented in Figure 10. The predicted curves by the PC-SAFT and GEOS equations of state are confronted to literature data.40 It can be observed that the two investigated models reproduce satisfactorily well the available experimental data in the literature. Finally, it can be concluded that both investigated EOS, GEOS and PC-SAFT, are in general similar and correlate with the same order of precision the experimental data of the methylamine/water binary mixture. It should be noted however that the available bibliographical data contain only a few data in the vicinity of the critical region where the capacity of each model to correlate the vapor-liquid phase behavior can be appreciated.
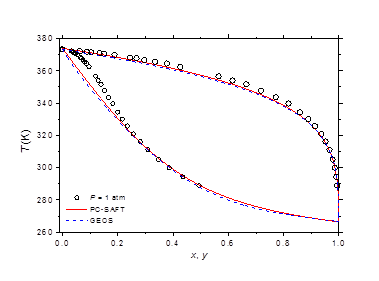
Figure 6 Vapor-liquid phase equilibria at atmospheric pressure of methylamine/water. Comparison of experimental data49 to theoretical curves with GEOS and PC-SAFT models.
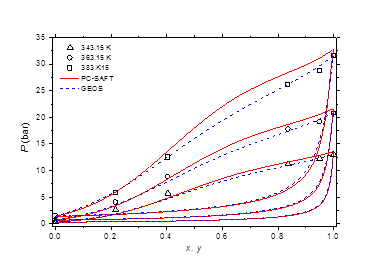
Figure 8 Phase equilibria of methylamine/water at 343.15, 363.15 and 383.15 K. Comparison of experimental data50 to calculated curves with GEOS and PC-SAFT.
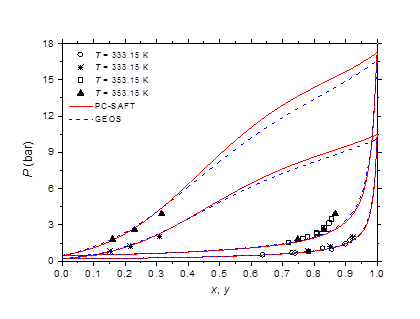
Figure 9 Phase behavior of methylamine/water at 333.15 and 353.15 K. Comparison of experimental data 51 to calculated curves with GEOS and PC-SAFT.
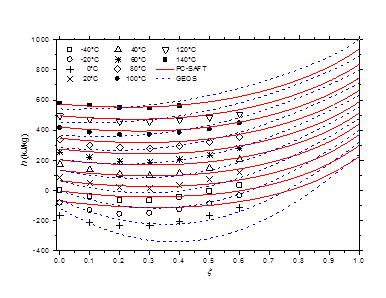
Figure 10 h-ξ-T diagram of saturated liquid phase for methylamine/water mixture. Comparison of literature data40 to calculated curves by GEOS and PC-SAFT.
When the two investigated thermodynamic models for water-methylamine system property and liquid-vapor phase calculations are compared, it is found that
For all these reasons, solely GEOS is retained in the following for the prediction of the properties of the binary mixtures of methylamine and water (Tables in Appendices C.1 and C2 and Figure 11 & Figure 12 representing the (h-T-ξ) and (s-T-ξ) diagrams of the saturated methylamine/water mixture up to very high temperature and pressure, respectively). It must be noted however that these curves and tables are deduced by extrapolation outside the domain of the available bibliographical data. Reasonable results are obtained, however the prediction accuracy in these areas is unknown. More experimental data are needed to assess the quality of the predicted properties, particularly in the critical and single-phase regions.
The vapor-liquid phase equilibria and thermodynamic properties of the methylamine/water binary mixture are modeled using two approaches, PC-SAFT equation of state and GEOS. A confrontation of the calculated and experimental data for pure fluids shows that the GEOS model is more accurate than the PC-SAFT equation in reproducing the vapor-liquid phase behavior and molar enthalpy of vaporization in the vicinity of the critical point of pure water. The binary cross-interaction parameters in the equations of state for the mixture are fitted from the few available vapor-liquid equilibria data. The comparison of the theoretical property predictions with experimental data leads to the conclusion that the two investigated equations of state are in general comparable in the calculation of the two-phase behavior of the methylamine/water system. However, the general cubic equation of state GEOS is more accurate in the neighborhood of the critical temperature of methylamine. This fact is probably due to the more accurate description of the vapor-liquid equilibrium of pure components near the critical region by GEOS. Further, a practical advantage of this equation of state is its simple mathematical structure, more tractable and easier to apply than the complex PC-SAFT EOS.
None.
The author declares that there is no conflict of interest.

©2018 Mejbri, et al. This is an open access article distributed under the terms of the, which permits unrestricted use, distribution, and build upon your work non-commercially.