International Journal of
eISSN: 2475-5559


Research Article Volume 5 Issue 2
1Islamic Azad University, Science and Research Branch, Tehran, Iran
2 PUT and PGPZ-International, Tehran, Iran
Correspondence: Mohammad Kamal Ghassem-Alaskari, PUT and PGPZ-International, Tehran, Iran
Received: August 27, 2020 | Published: October 26, 2020
Citation: Nik AAT, Ghassem-Alaskari MK. Experimental study of polar solvents effect on the structure of carbonate reservoir. Int J Petrochem Sci Eng 2020;5(2):56-60. DOI: DOI: 10.15406/ipcse.2020.05.00122
For routine and special core analysis, first we plugged cores for removing oil, water, evaporates, drilling mud and other contaminants and then washed with solvents and dried out. The common washing for some cores is that, they do not wash part of evaporates, asphaltenes, surfactants or drilling materials in the rock samples. Without removing these contaminants, the porosity and permeability calculated from these rock samples are not precise at all. In case of washing samples, there is always a problem in conducting tests on cores in laboratories. In this research, we tried to minimize the possible damages in this process by detecting a sample with predominant clay minerals based on X-Ray Diffraction (XRD) test and Cation Exchange Capacity (CEC) test of the samples, then washing with 3 different solvents by Soxhlet extractor. Finally, we, measured the strength of the wettability changes of each sample. This can be evaluated with Zeta potential test. After providing SEM and microscopic images, we compared the damages to each other. Then with the EDS test, we investigated the removal of the elements in the sample by its solvent. In this study, different solvents were tested on clay minerals with the aim of identifying the effect of these solvents and comparing the different effects on these samples. Pre- and post- analyzes were performed at optimal conditions for washing and drying.
Keywords: washing, solvent, damage, wettability-changes, zeta potential, XRD, SEM
EDS, elemental diffraction spectroscopy; CEC, cation exchange capacity; XRD, X-ray diffraction
Proper understanding of the type and properties of oil and gas reservoirs is critical in deciding how to drill, extract, and exploit these reservoirs, as well as protecting these reservoirs. In order to understand the patterns of reservoir rocks after drilling process and understanding the type and properties of oil and gas reservoirs, it is necessary to know how to perform drilling operations,1–13 extracting, exploiting and conservation of these vital resources.14 This process must be carried out in accordance with special rules for storing rocks.15 In special sample tests such as flooding, capillary pressure, relative permeability, change in the wettability, the computations based on experiments may not be correct. On the other hand, clay containing rocks, due to their capacity for cation exchange of ion in contact with water, absorb water and swell in the process of washing. These samples are also likely to collapse in the process of drying after washing, due to the evaporation of water having some minerals (transported water). In case of washing samples, there is always a problem in conducting tests on cores in laboratories.10 In order to carry out routine and special studies of oil saturated core samples, plugged specimens must first be washed with solvents and then dried to remove oil, water, evaporates and other sediments. After washing with solvents and drying the specimens, the experiments are done on the samples and the results are compared to the solvents' function.9
X-ray test
After sampling, some portion of the rock used as powder and prepared for the X-ray diffraction analysis. It used to find out the details of the rock-forming minerals and the accuracy of it.1 The X-ray diffraction spectrums are shown in Figure 1 and the result of this analysis is shown in Table 1.
|
Compound Name |
Formula |
S-Q% |
System |
|
Calcite |
CaCO3 |
39.9 |
Hexagonal (Rh) |
|
Quartz |
SiO2 |
11.3 |
Hexagonal |
|
Goethite |
FeO(OH) |
11 |
Orthorhombic |
|
Illite |
K-Na-Mg-Fe-Al-Si-O-H2O |
11 |
Monoclinic |
|
Kaolinite |
Al2Si2O5(OH)4 |
10.1 |
Monoclinic |
|
Montmorillonite |
AlSi2O6(OH)2 |
8.3 |
Monoclinic |
|
Gypsum |
CaSO4·2H2O |
5.7 |
Monoclinic |
|
Halite |
NaCl |
2.7 |
Cubic |
Table 1 X-ray diffraction analysis of the tested sample
Analysis of ion exchange capacity
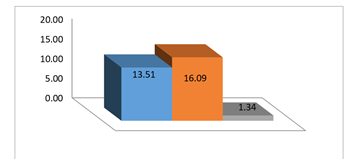
In this test, an oily method is used, which is the only method for crunching clay rocks. The core sample with a length of 3.778 and diameter of 3.776 and weight of 97.828 were taken. Subsequent tests were performed for this core. (Table 2). By comparing the weight of the specimens before and after washing, it is possible to find out which solvent has more damage to the samples and extracts more from the samples by washing.7 In this case more percentage of the sample is deducted and it means larger gaps and more damage to that sample (Figure 2). By comparing this difference in weights with pre-and post-washed photos and matching them, it is clear that propanol has better performance in case of polar solvents, and ethanol and methanol samples have high percentage of weight loss and are almost roughly dispersed samples (Figure 3).
Parameter |
Value |
Porosity |
5.56% |
Permeability |
0.106 m D |
P.V |
3.21% |
G.D |
2.771g/cubic cm |
1/P |
0.424PSI |
Table 2 Results of Sample routine analysis

Figure 2 Percentage of sample weight change after washing compared to pre-wash weight; From left to right:1_Methanol 2_Ethanol 3_Propanols.
As it is seen from the images taken, for methanol solvents polycrystalline solutions have created gaps in the direction of rock placement, but the layers have not been separated from each other, while for the ethanol solvent not only there are gaps in layering and clay minerals, but also the sheets after drying out. Many of the sample grains are washed in the washing steps, thus, the specimen weight is reduced significantly. As you can see, in the polar solvents propanol it is introduced without causing cracks and damage to the best solvent sample.
Microscopic image analysis3–6
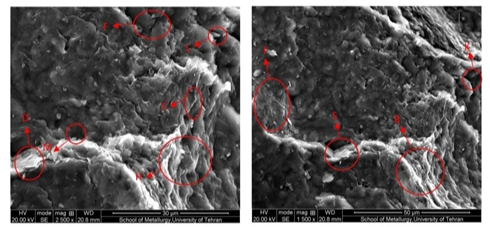
Figure 4 shows the microscopic image of the sample before the washing process. It should be noted that in subsequent sections, we have removed salt and hydrocarbon materials by the special solvents. In Figure 5, the microscopic images after the wash are shown in the second image (right image). In Figure 6, an electron microscope image of a raw sample with magnitudes of 1500 and 2500 is observed respectively (left to right): As shown in the red circles, there are hydrocarbon and salt materials on the surface of the rock, as well as in the gaps before testing (Figure 6).
In this figure, illite, chlorite and kaolinite minerals are present and the amount of illite and kaolinite minerals is higher than the remaining minerals. Chlorite is clustered, and Kaolinite is seen as sheets (quilted) and quartz in larger coniferous clay minerals. There is no particular gap in the image, because the specimen is not practically exposed to the solvent in which it is damaged, hence, in the specified part for grading, there are also relatively regular aggregates of minerals alongside, especially the kaolinite minerals are seen as side by side columns. In Figure 7, the image of the electron microscope from the sample after the test is shown with ethanol has magnitudes of 1500 and 2500 respectively (left to right).

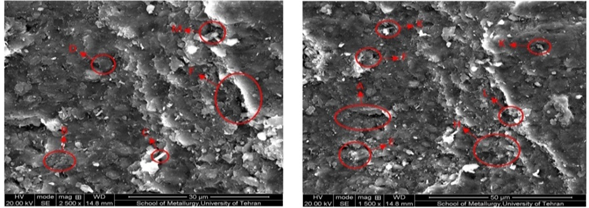
Figure 7 Microscopic pattern of the sample after washing with ethanol, magnitudes of 1500 (left) and 2500 (right).
As we see in Figure 7, after washing with ethanol there is a great deal of disturbance in the images, and the presence of minerals is uneven and irregular. There are no columns of kaolinite and chlorite clusters. The large pores seen in the pre-test sample are now shriveled and often filled with grains. In Figure 8, the image of the electron microscope from the sample after testing with methanol is shown has magnitudes of 1500 and 2500 respectively(left to right). In Figure 9, the image of an electron microscope from a prototype sample is shown with propanol has magnitudes of 1500 and 2500 respectively (left to right). For the sample shown in Figure 9, the least change in sample structure is observed. Seedling has the least disturbance and migration of seeds at its lowest level. The cracks created are very tiny and almost unfocused.15,16

Figure 8 Image of the electron microscope from the sample after washing with methanol, magnitudes of 1500 (left) and 2500 (right).

Figure 9 Scanning microscopy image of the sample after washing with propanol has magnitudes of 1500 (left) and 2500 (right).
Analysis of elemental diffraction spectroscopy (EDS)
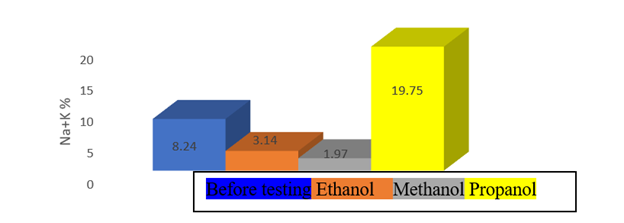
In Table 3, elemental analysis of the tested samples before and after the washing process is observed.6,8,17 In Figure10, the charts obtained from Table 3 are prepared and reviewed. As shown in these diagrams, ethanol has a very good performance in removing hydrocarbon materials as well as salts in the sample. Therefore, ethanol is a very good solvent for the removal of organic matter. In Figure 11, solvent of propanol, which is structurally like methanol and has a near-interactive dihedral electrode, and has both aprotic polar and the weakest performance.11 Also, methanol played a very good role in salt removal from the sample, but did not perform relatively well in organic matter removal than other solvents.
Sample |
Raw sample (%) |
Sample washed with ethanol (%) |
Sample washed with methanol (%) |
Sample washed with Propanol (%) |
Element |
||||
Cl |
6.19 |
19.8 |
||
Na |
6.14 |
18.27 |
||
O |
39.16 |
51.08 |
46.37 |
28.01 |
C |
5.1 |
9.69 |
10.86 |
|
Ca |
9.62 |
5.02 |
3.46 |
3.62 |
Fe |
6.31 |
7.92 |
3.93 |
2.21 |
Al |
7.15 |
11.64 |
13.56 |
5.84 |
Si |
11.46 |
20.34 |
19.27 |
8.92 |
K |
2.1 |
3.14 |
1.97 |
1.48 |
Mg |
0.85 |
0.84 |
1.74 |
1 |
Table 3 Analysis of EDS samples before and after the washing process

Figure 11 Analysis of the mineral elements present in the sample before and after the washing process.
Zeta potential analysis
The potential of Zeta in fact shows a high level of contact with its own fluid.12,13 The results of Zeta potential after washing with three solvents are shown in Figure12, which shows the results in Table below.
In this research, experiments on washing and drying methods are done. The optimum conditions for washing samples containing clay minerals in different conditions have been achieved. The highest removal of organic and inorganic materials resulted, while maintaining the structure of the rock. In this study, different solvents were tested on clay samples with the aim of identifying the effect of these solvents and comparing the different effects on these samples. Pre- and post- analyzes were performed at optimal conditions for washing and drying. Final results are mentioned in the results.
None.
There are no conflicts of interest.
None.

©2020 Nik, et al. This is an open access article distributed under the terms of the, which permits unrestricted use, distribution, and build upon your work non-commercially.