International Journal of
eISSN: 2475-5559


Research Article Volume 4 Issue 3
1Department of Petroleum Engineering, Omidiye Branch, Islamic Azad University, Omidiye, Iran
2National Iranian South Oil Company (NISOC), Petroleum University of Technology, Ahvaz, Iran
3Petroleum University of Technology (PUT) and PGPZ-International, Iran
Correspondence: Ghassem Alaskari MK, Petroleum University of Technology (PUT) and PGPZ-International, Iran
Received: March 01, 2019 | Published: June 20, 2019
Citation: Jaferi S, Ashoori S, Alaskari GMK. Determination of the minimum miscibility pressure using the eclipse 300 simulator and compare it with the laboratory results. Int J Petrochem Sci Eng. 2019;4(3):97-107. DOI: 10.15406/ipcse.2019.04.00109
Gas miscibility injection is one of the most effective ways to increase oil extraction. The Minimum miscibility pressure is an important parameter in the miscibility gas injection processes, which is very important for determining the type of injection gas and the design of injection facilities.1 In the industry, the minimum miscibility pressure is usually measured by slim tube, which is a relatively costly and time-consuming test, and may sometimes be counterproductive due to its specific problems, in spite of the high cost and time consuming costs. In this study, using the eclipse 300 simulator, the minimum miscibility pressure was calculated for 11 oil reservoirs with different injectable gases in the process of gas miscibility injection after simulation and compared with the experimental results of these 11 reservoirs and by calculating error percentage, the applicability of this method has been investigated.
Keywords: gas miscibility injection, minimum miscibility pressure, simulation, eclipse 300 simulator
In order to evaluate the accuracy of the software, several laboratory datasets including reservoir fluid, injection gas and minimum mixing pressure of gas injection into the reservoir fluid at the desired temperature were collected from the paper by jauber et al.1 Table 1 shows the composition of the 11 different fluid reservoirs. Also, the composition of different injectable gases is shown in Table 2.
Component |
F1 |
F2 |
F3 |
F4 |
F5 |
F6 |
F7 |
F8 |
F9 |
F10 |
F12 |
H2S |
0 |
0 |
0 |
0 |
0.383 |
0 |
0 |
0 |
2.32 |
0.355 |
1.49 |
N2 |
0.18 |
0.2 |
0.45 |
0.35 |
0.45 |
0 |
0 |
0.083 |
0.249 |
0.4 |
0.32 |
CO2 |
0.82 |
1.34 |
1.64 |
3.14 |
2.07 |
0.774 |
2.13 |
1.824 |
3.601 |
2.548 |
2.8 |
C1 |
22.92 |
23.64 |
45.85 |
54.26 |
26.576 |
36.203 |
31.28 |
32.165 |
47.642 |
47.244 |
45.29 |
C2 |
7.21 |
8.56 |
7.15 |
8.57 |
7.894 |
9.736 |
7.51 |
7.627 |
6.497 |
6.937 |
9.11 |
C3 |
7.37 |
6.68 |
6.74 |
5.72 |
6.73 |
6.745 |
6.93 |
7.221 |
4.5 |
4.805 |
5.5 |
IC4 |
1.58 |
1.25 |
0.84 |
0.76 |
1.485 |
1.287 |
0.27 |
1.894 |
1.169 |
1.19 |
1.06 |
NC4 |
5.23 |
4.05 |
3.11 |
2.45 |
3.899 |
3.672 |
5.99 |
4.613 |
2.866 |
3.063 |
3.07 |
IC5 |
2.25 |
1.78 |
1.03 |
0.75 |
1.937 |
1.557 |
0.97 |
2.132 |
1.4 |
1.441 |
1.24 |
NC5 |
3.6 |
2.67 |
1.65 |
1.2 |
2.505 |
2.337 |
3.77 |
2.886 |
1.899 |
1.964 |
1.82 |
C6 |
4.84 |
4.03 |
2.52 |
1.53 |
3.351 |
3.29 |
4.37 |
4.085 |
2.736 |
2.877 |
2.38 |
C7 |
4.72 |
4.57 |
3.77 |
2.6 |
4.311 |
3.508 |
4.5 |
4.209 |
2.917 |
3.001 |
2.84 |
C8 |
4.52 |
4.28 |
4.28 |
3.02 |
4.133 |
3.606 |
4.08 |
3.987 |
2.884 |
2.919 |
2.83 |
C9 |
4.07 |
3.88 |
2.7 |
2.1 |
3.051 |
3.334 |
3.96 |
3.762 |
2.351 |
2.454 |
2.49 |
C10 |
3.5 |
2.93 |
1.69 |
1.74 |
2.033 |
2.657 |
3.42 |
3.271 |
1.79 |
1.973 |
2.15 |
C11 |
2.91 |
3.15 |
1.81 |
1.36 |
2.635 |
2.481 |
2.79 |
2.78 |
1.78 |
2.022 |
1.74 |
C12 |
2.42 |
3.19 |
1.47 |
1.1 |
2.285 |
2.067 |
2.4 |
2.068 |
1.464 |
1.692 |
1.42 |
C13 |
1.99 |
3.05 |
1.45 |
1.11 |
2.364 |
1.917 |
2.04 |
1.751 |
1.275 |
1.501 |
1.31 |
C14 |
1.74 |
1.16 |
1.28 |
0.95 |
2.038 |
1.469 |
1.79 |
1.924 |
1.063 |
1.327 |
1.15 |
C15 |
2.02 |
1.98 |
1.15 |
0.86 |
1.752 |
1.215 |
1.46 |
1.233 |
0.994 |
1.162 |
1 |
C16 |
1.39 |
1.72 |
0.91 |
0.68 |
1.589 |
1.158 |
1.24 |
1.192 |
0.817 |
0.967 |
0.88 |
C17 |
1.21 |
1.6 |
0.82 |
0.6 |
1.492 |
0.985 |
1.04 |
0.962 |
0.666 |
0.765 |
0.76 |
C18 |
0.9 |
1.16 |
0.8 |
0.56 |
1.263 |
0.952 |
0.9 |
0.815 |
0.637 |
0.783 |
0.69 |
C19 |
1.17 |
1.1 |
0.71 |
0.51 |
0.812 |
0.903 |
0.83 |
0.814 |
0.498 |
0.605 |
0.62 |
C20+ |
11.44 |
12.03 |
6.18 |
4.08 |
12.962 |
8.147 |
6.33 |
6.702 |
6.021 |
6.005 |
6.04 |
Molar weight of C20+ |
560 |
530 |
474 |
418 |
450 |
442 |
455 |
455 |
411 |
434 |
460 |
Table 1 Combination of fluid reservoirs.1
Compound |
G1 |
G 2 |
G 3 |
G 4 |
G5 |
G6 |
G7 |
G8 |
G9 |
G10 |
G12 |
H2S |
0 |
0 |
0 |
0 |
0 |
0.25 |
0 |
0 |
2.35 |
2.72 |
3.81 |
N2 |
0.48 |
0.48 |
0.49 |
0.41 |
0 |
0.42 |
0 |
0 |
0.27 |
0.22 |
0.2 |
CO2 |
4.96 |
4.96 |
1.82 |
1.65 |
0 |
2.85 |
4.35 |
4.35 |
4.35 |
4.43 |
7.57 |
C1 |
58.05 |
58.05 |
81.39 |
81.71 |
88 |
75.55 |
81.14 |
81.14 |
73.09 |
66.1 |
64.9 |
C2 |
17.09 |
17.09 |
9.15 |
9.16 |
7 |
14.34 |
10.31 |
10.31 |
6 |
6.41 |
15.03 |
C3 |
11.97 |
11.97 |
4.67 |
4.54 |
3 |
5.52 |
3.32 |
3.32 |
3.48 |
12.04 |
5.76 |
IC4 |
1.23 |
1.23 |
0.5 |
0.48 |
0.5 |
0.37 |
0 |
0 |
0.81 |
0.5 |
0.63 |
NC4 |
3.73 |
3.73 |
1.24 |
1.21 |
0.5 |
0.59 |
0.88 |
0.88 |
1.76 |
6.93 |
1.29 |
IC5 |
0.75 |
0.75 |
0.2 |
0.19 |
0.5 |
0.05 |
0 |
0 |
0.73 |
0.24 |
0.25 |
NC5 |
0.91 |
0.91 |
0.26 |
0.26 |
0.5 |
0.05 |
0 |
0 |
0.92 |
0.23 |
0.28 |
C6 |
0.53 |
0.53 |
0.09 |
0.13 |
0 |
0.01 |
0 |
0 |
1.15 |
0.12 |
0.15 |
C7 |
0.19 |
0.19 |
0.06 |
0.12 |
0 |
0 |
0 |
0 |
1.1 |
0.03 |
0.1 |
C8 |
0.08 |
0.08 |
0.13 |
0.13 |
0 |
0 |
0 |
0 |
0.92 |
0.03 |
0.03 |
C9 |
0.03 |
0.03 |
0 |
0.01 |
0 |
0 |
0 |
0 |
0.73 |
0 |
0 |
C10 |
0 |
0 |
0 |
0 |
0 |
0 |
0 |
0 |
0.47 |
0 |
0 |
C11 |
0 |
0 |
0 |
0 |
0 |
0 |
0 |
0 |
1.87 |
0 |
0 |
Table 2 Molar composition of injected gases.1
A common method for numerical estimation of MMP is the simulation of displacement by a one-dimensional model of a slim tube using a state equation by a simulator with a composite model. Simulation of the slim tube is performed for different pressures, and the recovery is recorded after the injection of gas at 1.2 volumes of empty space for each run (for each pressure). Immiscibility displacement with Buckley-Levret's assumptions2 without any exchange of components between injecting gas and on-site oil, after of infusion gas, will have equal recovery (1-Sor). A complete miscible process, theoretically, should lead to the recovery of total inland oil. The yield is about 100% independent of the saturation endpoints or the relative permeability diagram form. Accordingly, a slim tube one-dimensional combination simulator was used to determine the minimum miscibility pressure (MMP), different gases with fluids of reservoirs. One-dimensional model of a 10 meter slim tube was constructed. Full implicit solving method was used and the miscible keyword was used to activate relative permeability and capillary pressure to surface tension. Due to the fact that the actual slim tube structure has a high porosity and permeability, porosity and permeability of the model were selected as 0.1 and 2,000 md respectively. In this model, two wells were used. The injection well was placed in the first grid of the model and the well in the last grid of the model to produce with constant pressure of the well. But the main problem with using this type of simulator is the severe effect of grading on the results, which results in a minimum miscibility pressure of the calculated value greater than the real value.3 In all the miscible displacement processes, the moving fluid and the displacing fluid are mixed, that is, between the different miscible fluids; there is a dispersion phenomenon.4 The dispersion creates a transient region in which the moving fluid dilutes the displacing fluid and affects the fuzzy behavior. According to the scientific hypothesis of Johns5 in the absence of insignificant permeability and insignificant capillary pressure, in the absence of dispersion, the length of this transient region should reach zero. As the number of grains increases, the length of this area becomes smaller, resulting in less scattering.
To solve this problem (removal of dispersion), the method proposed by Stalkup [6] is used as follows:
As a result, various simulations were carried out at various pressures of 100, 200 and 500 blocks to determine the minimum mixing pressure, injection of different gases (Table 2) with the reservoir fluids (Table 1). Subsequently, the recovery coefficient graph was drawn for an infinite number of degrees against the pressure to obtain the MMP for different injectable gases and reservoir fluids.
Determination of the minimum miscibility pressure to inject G1 gas into the fluid reservoir F1
Based on the results of a slim tube, the minimum miscibility pressure to inject G1 gas into the F1 reservoir fluid at 374K85 is 221bar. To calculate this, using a slim tube simulator, at first, different simulations were performed at different pressures with models of 100, 200 and 500grids. Figure 1 illustrates the oil recovery coefficient at different pressures for a model with 100 grid injecting G1 gas into the F1 reservoir fluid. At the end of the chart, the oil recovery coefficient was calculated for an infinite number of grids against the pressure to obtain the MMP value. As shown in Figure 2, the MMP value for injecting G1 gas into the F1 reservoir is 373.85 K at 223bar.
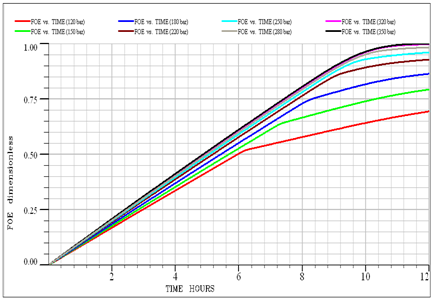
Figure 1 Oil recovery at various displacement pressures for a model with 100 grids injects G1 into F1 reservoir.
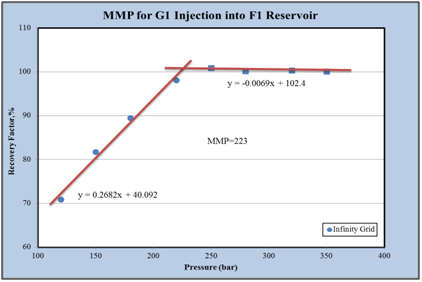
Figure 2 The final recovery coefficient of the oil in terms of pressure for the infinite grade in the F1 reservoir.
Determination of the minimum miscibility pressure to inject G2 gas into the fluid reservoir F2
Based on the results of a slim tube, the minimum miscibility pressure for the injection of G2 gas into the F2 reservoir at 372.05K is 235bar. To calculate it using a slim tube simulator, at first different simulations at different pressures was performed by models with 100, 200 and 500grids. Figure 3 shows the oil recovery coefficient at different pressures for a model with 100grid injecting G2 gas into the F2 reservoir fluid. In the end, the graph of the oil recovery coefficient was calculated for the infinite number of grids against the pressure to obtain the MMP value. As shown in Figure 4, the MMP value for injecting G2 gas into the F2 reservoir at 372.5K is 237bar.
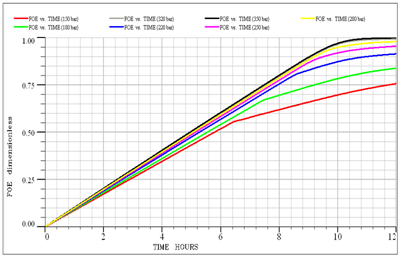
Figure 3 Oil recovery at different displacement pressures for a model with 200 grids in G2 injection into F2 reservoir.
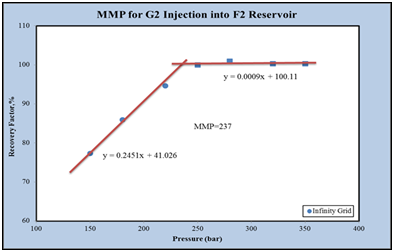
Figure 4 The final recovery coefficient of the oil in terms of the pressure for the infinite grade in the F2 reservoir.
Determination of the minimum miscibility pressure to inject G3 gas into the fluid reservoir F3
Based on the results of a slim tube, the minimum miscibility pressure for the injection of G3 gas into the F3 reservoir at 387.45K is 376bar. To calculate it using a slim tube simulator, at first different simulations at different pressures was performed by models with 100, 200 and 500grids. Figure 5 shows the oil recovery coefficient at different pressures for a model with 500 grid injecting G3 gas into the F3 reservoir fluid. In the end, the graph of the oil recovery coefficient was calculated for the infinite number of grids against the pressure to obtain the MMP value. As shown in Figure 6, the MMP value for injecting G3 gas into the F3 reservoir at 387.45 K is 386bar.
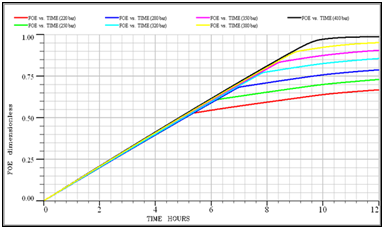
Figure 5 Oil recovery at different displacement pressures for a 500-grid model in a G3 injection to the F3 reservoir.
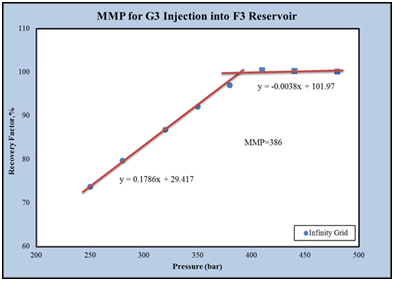
Figure 6 The final recovery coefficient of the oil in terms of the pressure for the infinite grid in the F3 reservoir.
Determination of the minimum miscibility pressure to inject G4 gas into the fluid reservoir F4
Based on the results of a slim tube, the minimum miscibility pressure for the injection of G4 gas into the F4 reservoir at 388.15K is 379bar. To calculate it using a slim tube simulator, at first different simulations at different pressures was performed by models with 100, 200 and 500grids. Figure 7 shows the oil recovery coefficient at different pressures for a model with 500 grid injecting G4 gas into the F4 reservoir fluid. In the end, the graph of the oil recovery coefficient was calculated for the infinite number of grids against the pressure to obtain the MMP value. As shown in Figure 8, the MMP value for injecting G4 gas into the F4 reservoir at 388.15 K is 384bar.
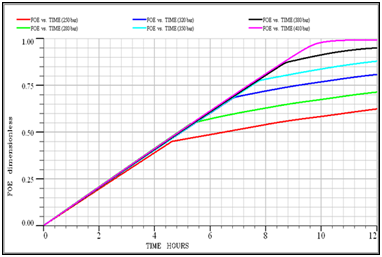
Figure 7 Oil recovery at various displacement pressures for a 500-grid model in a G4 injection to the F4 reservoir.
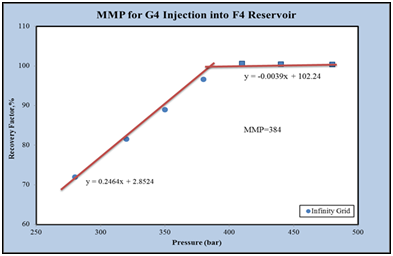
Figure 8 The final recovery coefficient of the oil in terms of pressure for the infinite grade in the F4 reservoir.
Determination of the minimum miscibility pressure to inject G5 gas into the fluid reservoir F5
Based on the results of a slim tube, the minimum miscibility pressure for the injection of G5 gas into the F5 reservoir at 394.25K is 366bar. To calculate it using a slim tube simulator, at first different simulations at different pressures was performed by models with 100, 200 and 500grids. Figure 9 shows the oil recovery coefficient at different pressures for a model with 200 grid injecting G5 gas into the F5 reservoir fluid. In the end, the graph of the oil recovery coefficient was calculated for the infinite number of grids against the pressure to obtain the MMP value. As shown in Figure 10, the MMP value for injecting G5 gas into the F5 reservoir at 388.15 K is 365bar.
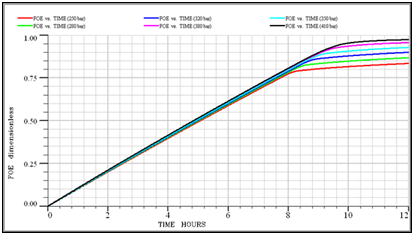
Figure 9 Oil recovery at different displacement pressures for a model with 200 grids in G5 injection into the F5 reservoir.
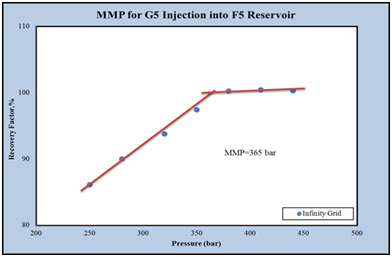
Figure 10 The final recovery coefficient of the oil in terms of the pressure for the infinite grade in the F5 reservoir.
Determination of the minimum miscibility pressure to inject G6 gas into the fluid reservoir F6
Based on the results of a slim tube, the minimum miscibility pressure for the injection of G6 gas into the F6 reservoir at 383.15K is 313bar. To calculate it using a slim tube simulator, at first different simulations at different pressures was performed by models with 100, 200 and 500grids. Figure 11 shows the oil recovery coefficient at different pressures for a model with 200 grid injecting G6 gas into the F6 reservoir fluid. In the end, the graph of the oil recovery coefficient was calculated for the infinite number of grids against the pressure to obtain the MMP value. As shown in Figure 12, the MMP value for injecting G6 gas into the F6 reservoir at 383.15 K is 311bar.
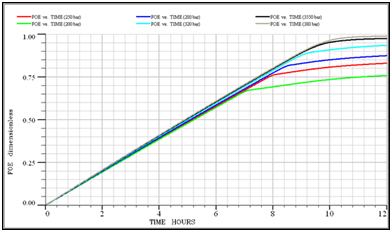
Figure 11 Oil recovery at various displacement pressures for a model with 200 grids in G6 injection into F6 reservoir.
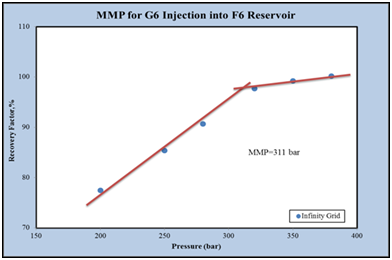
Figure 12 Oil recovery at various displacement pressures for a model with 200 grids in G6 injection into F6 reservoir.
Determination of the minimum mixing pressure to inject G10, G9, G8, G7 and G12 gases into the fluid reservoirs F10, F9, F8, F7, and F12
Based on the results of a slim tube, the minimum miscibility pressure for the injection of G10, G9, G8, G7 and G12 gases into the F10(394.25K), F9(394.25K), F8(393.15K), F7(393.15K), F12(376.45K) reservoirs is 296, 262.5, 359, 286.9 and 327bar. To calculate it using a slim tube simulator, at first, different simulations at different pressures were performed by models with 100, 200 and 500grids. Also, the final recovery changes curve in terms of pressure for obtaining the MMP for injection of various gases and reservoir fluids is presented in Figures 13 to 17.
As you can see, the amount of MMP for injection of G7 gas into the F7 reservoir fluid at a temperature of 393.15K is 325bar, Figure 13.
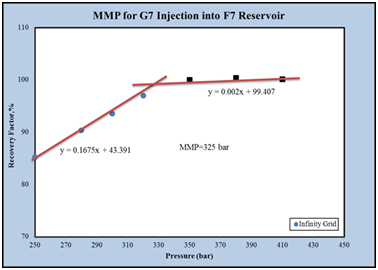
Figure 13 The final recovery rate of the oil in terms of pressure for an infinite grade in the F7 reservoir.
The amount of MMP for injection of G8 gas into the F8 reservoir fluid at a temperature of 393.15K is 340bar, Figure 14.
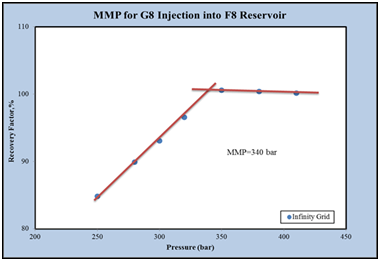
Figure 14 The final recovery coefficient of the oil in terms of pressure for an infinite grid in the F8 reservoir.
The amount of MMP for injection of G9 gas into the F9 reservoir fluid at a temperature of 394.25K is 350bar, Figure 15.
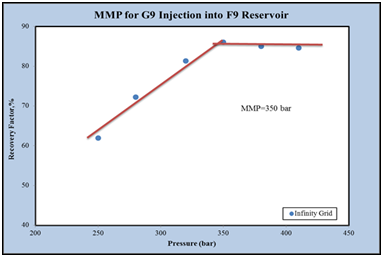
Figure 15 The final recovery coefficient of the oil in terms of the pressure for the infinite grade in the F9 reservoir.
The amount of MMP for injection of G10 gas into the F10 reservoir fluid at a temperature of 394.25K is 280bar, Figure 16.
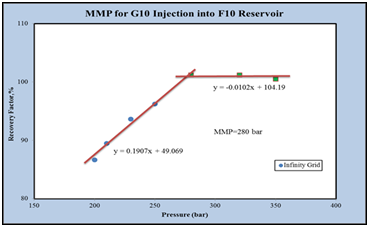
Figure 16 The final recovery coefficient of the oil in terms of the pressure for the infinite grid in the F10 reservoir.
The amount of MMP for injection of G12 gas into the F12 reservoir fluid at a temperature of 376.45K is 327.1bar, Figure 17.
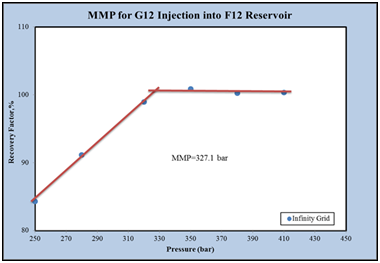
Figure 17 The final recovery coefficient of the oil in terms of pressure for the infinite grade in the F12 reservoir.
Using equation 1and Table 3, we obtain the error percentage between the experimental MMP and the simulated MMP And By averaging the results of Table 4, the average value of absolute error the Eclipse 300 software is 4.62%.
(1)
Reservoir |
F1 |
F2 |
F3 |
F4 |
F5 |
F6 |
F7 |
F8 |
F9 |
F10 |
F12 |
MMP)bar (simulator model results with Eclipse 300 software |
223 |
237 |
386 |
384 |
365 |
311 |
325 |
340 |
350 |
280 |
327.1 |
MMP)bar) lab results in slim tube |
221 |
235 |
376 |
379 |
366 |
313 |
296 |
262.5 |
359 |
286.9 |
327 |
Table 3 MMP results from eclipse 300 software.
Reservoir |
F1 |
F2 |
F3 |
F4 |
F5 |
F6 |
F7 |
F8 |
F9 |
F10 |
F12 |
ADD% Slim tube simulator model - Eclipse 300 software |
0.905 |
0.8511 |
2.6596 |
1.3193 |
0.2732 |
0.639 |
9.7973 |
29.5238 |
2.507 |
2.405 |
0.0306 |
Table 4 Eclipse 300 percentage error in MMP calculation.
None.
The author declares that there are no conflicts of interest.

©2019 Jaferi, et al. This is an open access article distributed under the terms of the, which permits unrestricted use, distribution, and build upon your work non-commercially.