International Journal of
eISSN: 2475-5559


Research Article Volume 2 Issue 3
1Department of Chemical Engineering, Arak University, Iran
1Department of Chemical Engineering, Arak University, Iran
Correspondence: E Bagheripour, Department of Chemical Engineering, Arak University, Iran
Received: October 24, 2016 | Published: April 21, 2017
Citation: Bagheripour E, Moradi ARS, Moghadassi SM, et al. CFD simulation of liquid dispersion in bubble column. Int J Petrochem Sci Eng. 2017;2(3):102-107. DOI: 10.15406/ipcse.2017.02.00040
In the current work, a modeling simulation based on the Computational Fluids Dynamic (CFD) method was done for two phase flow (gas-liquid) in two bubble columns. The effect of geometrical (two column diameters) and different gas velocity on the system hydrodynamics (gas hold up, mixing time) was investigated. Furthermore, the liquid circulation velocity in the columns was predicted. The simulated results were agreement with the experimental data reported in the literature. It was concluded that gas hold up was decreased while bubble column diameter increased from 15cm to 30cm in both experimental and CFD data’s. But gas hold up was increased by increasing superficial gas velocity. In addition, it was seen that increasing of bubble column diameter from 15 to 30 cm leads to decreasing of mixing time. also mixing time reduced when superficial gas velocity was increased from 1 to 10cm/s. Moreover, for more study on CFD simulation of bubble columns with different diameters, the effect of different superficial gas velocity on the liquid circulation velocity was predicted for two reactors. This prediction has shown increasing of liquid circulation velocity versus of increasing superficial gas velocity but it reduced when reactor diameter was increased.
Keywords: bubble column, superficial gas velocity, hold up, mixing time, liquid circulation velocity
Bubble columns are contactors in which discontinues gas phase in the form of bubbles moves relative to a continues phase. The continues phase can be liquid or homogeneous slurry.1 Bubble columns serve as multiphase contactors and reactors in the chemical, petrochemical, biochemical, and metallurgical industries. As reactors, bubble columns are used for chemical processes involving oxidation, chlorination, alkylation, polymerization, and hydrogenation reactions. Other processes that employ bubble columns include hydro treating and conversion of petroleum residues and direct and indirect liquefaction in the production of liquid fuels from coal.2 This reactors offer many advantages such as simple construction, no mechanically moving parts, good heat and mass transfer properties, high thermal stability, good mixing, low power requirements and hence low construction and operating cost.3
Recently, many studies have been conducted on the hydrodynamics of gas- liquid flow, in bubble columns, in fluidized beds and in spouted beds.4–24
Gas holdup is defined as the fraction occupied by the gas phase in the total volume of a two- or three-phase mixture in a bubble column. It is one of the most important parameters characterizing bubble column hydrodynamics because it not only gives the volume fraction of the gas phase, it is also needed to estimate the interfacial area and thus the mass transfer rate between the gas and liquid phases.25
Good bubble column design requires knowledge of the effects of geometrical and operating parameters on hydrodynamics and mass transfer. Liquid circulation velocity and gas hold-up are the major hydrodynamic parameters and their knowledge is essential for a reliable description of a gas-liquid reactor.26
Reported studies indicate that the accurate and successful design and scale-up of bubble-column reactors requires an improved understanding of the multiphase fluid dynamics and its influence on phase holdup distribution, mixing, and transport characteristics. In recent years considerable effort has been done toward fundamental fluid-dynamic modeling of two-phase flows in bubble columns with the focusing of using these models as tools in the design of bubble column reactors. This has resulted in a many computational fluid dynamics (CFD) Studies.27–30
In this research, the effect of bubble column diameter and superficial gas velocity on the hydro- dynamics of bubble column was theoretically studied. For this aim, the Computational Fluid Dynamics (CFD) software (Comsol 3.5) was applied to obtain gas hold-up and mixing time. These data’s were compared with the experimental data obtained from the literature.31 In addition for more study, a prediction of the effect of bubble column diameter and superficial gas velocity on the liquid circulation velocity on the column was done.
In this work, a time-dependent simulation with no turbulence by selecting of axial symmetry (2D), Chemical Engineering Module>Momentum Transport>Multiphase Flow >Bubbly Flow, Laminar >Transient analysis in the model navigator of Comsol 3.5 software was used. The Bubbly flow application mode makes it easy to set up a multiphase flow model for gas bubbles rising through a liquid. It solves for the liquid velocity, the pressure, and the volume fraction of the gas phase.
Continuity equation
The continuity equation for each phase is as follow equation:
∂(ρkαk)∂t+∇(αkρkuk) = Sk ……………….. (1)
Where, α, ρ and u are gas hold-up, density and velocity in both gas and liquid phases, respectively. K and Sk are phase type (for liquid phase: k = l and for gas phase: k = g) and source term of phase k in the domain, respectively.
Momentum transfer equation
The momentum transfer equation is derived as below expression:
∂(αkρkuk)∂t+∇(αkρkukuk)=−αk∇P+αkρkg+∇αkτk±Fint …………… (2)
Where the right hand of the above equation demonstrate pressure difference (the first term), gravity force (the second term), stress (third term) and the ensemble averaged momentum exchange between the intra-phase force (fourth term).32,33
The equations of state for both gas and liquid phases are defined as following:
ρ1 = const
………… (3)
ρg=PRT0
……… (4)
And
αl+αg= 1
………… (5)
Where
αl
and
αg
represent liquid and gas volume fractions, respectively.
The quantity
Fint
comes back to account the interaction forces (such as lift force, drag force and added mass force) between gas-liquid phases.34 The lift force, drag and turbulent stresses model supplied in the current work are described in the Moraveji et al. literature .35
The experimental data was supplied from a published experimental literature work.31 For the purpose, two bubble columns with the same geometrical properties but different diameter of column (15 and 30 cm) with different volumes containing of different superficial gas velocity were simulated by Comsol (version 3.5 a) as computational fluid dynamic instrument (CFD). The specification of these two bubble columns was shown in Table 1.
Ug (Air), cm/s |
1-10 |
Pressure = atm |
1 |
Liquid mode |
Batch |
Distilled water |
L = 1 g/cm3,
μ
L = 10-4 g/cm.s ,
σ
L = |
Temperature ˚C |
20 |
Initial Liquid height, Ho cm |
130 |
Table 1 Liquid-physical properties and selected operating conditions [31].
In this simulation, two phases were employed were air and water as gas and liquid phases respectively. The liquid phase height before gas sparging was fixed 1.3 m for both reactors in all experiments. In this situation, the gas volume fraction was equal to 0 before sparging gas in liquid.
The simulation of both columns became steady state after various times (5 to 23 s for different column diameter and different superficial gas velocity). According to the simulation, mesh consists of 4224 and 9984 elements respectively for column with 15 cm and 30 cm diameter. For slip model, the pressure drag balance with large bubbles was supplied. For inlet and outlet, the boundary condition was the gas flux and the gas outlet, respectively. The liquid phase was as primary phase and the gas phase was as dispersed phase.
Figure 1 shows meshes generation for the bubble column with diameter of 15 cm. Figure 2 shows the distribution of gas through the water from 0 s to reaching steady state after 16 seconds at superficial gas velocity of (Ug) 7 cm/s. These fig (Figure 2) shows that after passing time from 16 second, the volume fraction of gas in this column has became steady and increasing of time from 16 to 30 seconds has not resulted any changes in volume fraction of gas.
The effect of superficial gas velocity and column diameter on the gas hold up
The two reactors with different column diameters (15 and 30cm) with similar geometry were simulated at 20˚C under atmospheric pressure. The superficial gas velocity-hold up relation of the gas phase is the most important design parameter for two phase (gas-liquid) bubble column reactors for anticipating of heat and mass transfer coefficients and studies on hydrodynamic parameters. Gas hold up is an important parameter, because it estimates the amount of the gas phase reminded in the system at any time.
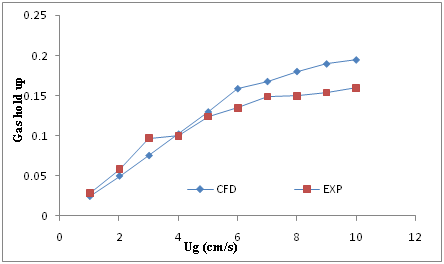
Figures 3 & 4 show the effect of superficial gas velocity on the volume fraction of gas (gas hold up) for both reactor scale (15 and 30 cm diameter) respectively. In these figs the experimental data31 and CFD results were compared. As shown in both figs, the gas hold up has increased by increasing the superficial gas velocity in two columns. In the Figure 3, gas hold up has increased from 0.0263 to 0.215 for CFD results and from 0.03 to 0.18 for experimental while superficial gas velocity (Ug) has increased from 1 to 10 cm/s in the reactor with 15 cm diameter. As it can be seen, the resulted data’s carried out of the CFD simulation are very similar to the experimental data’s and have good agreement together.

Figure 3 Comparison between the experimental data and CFD results for gas hold up in the reactor with 15 cm diameter versus superficial air velocity (Ug).

Figure 4 Comparison between the experimental data and CFD results for gas hold up in the reactor with 30 cm diameter versus superficial air velocity (Ug).
In addition in the Figure 4, the value of gas hold up has increased from 0.0245 to 0.195 for CFD and from 0.028 to 0.16 for experimental data’s in the column with 30 cm diameter. These results have a similar trend and good agreement together too.
Also the comprised results between experimental and CFD was briefly shown in Table 2.
Ug (cm/s) |
D=15cm |
D=30cm |
||||
|---|---|---|---|---|---|---|
EXP |
CFD |
Err% |
EXP |
CFD |
Err% |
|
1 |
0.03 |
0.02 |
33.3 |
0.02 |
0.02 |
0 |
2 |
0.06 |
0.06 |
0 |
0.05 |
0.05 |
0 |
3 |
0.09 |
0.07 |
22.2 |
0.09 |
0.07 |
22.2 |
4 |
0.11 |
0.1 |
9 |
0.1 |
0.1 |
0 |
5 |
0.12 |
0.14 |
16.6 |
0.12 |
0.13 |
8.3 |
6 |
0.13 |
0.16 |
23 |
0.13 |
0.15 |
15.3 |
7 |
0.15 |
0.17 |
13.3 |
0.14 |
0.16 |
14.2 |
8 |
0.15 |
0.18 |
20 |
0.15 |
0.18 |
20 |
9 |
0.16 |
0.21 |
31.2 |
0.15 |
0.19 |
26.6 |
10 |
0.18 |
0.21 |
16.6 |
0.16 |
0.19 |
18.7 |
Table 2 Experimental and CFD simulation results for both 15 and 30 reactor diameters.
Figure 5 shows the comparison of gas hold up in both reactor with diameters of 15 and 30 cm versus of different superficial gas velocity. As it can be seen in this fig, the gas holdup is found to reduce with increasing column diameter. The reduction of gas hold up by increasing of reactor diameter is more sensible in higher superficial gas velocity especially in Ug = 10 cm/s. This behavior of gas holdup is due to increase in liquid circulation with increasing column diameter, due to these strong circulations, the bubble will be accelerated and reduction in gas holdup occurred. There are the same results in the literatures.36-38
Effect of superficial gas velocity and column diameter on mixing time
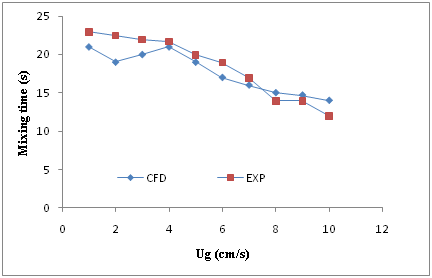
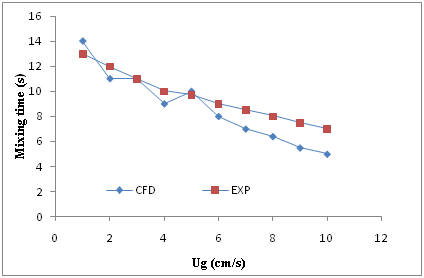
Mixing time is a direct indicator of the mixing capacity of a reactor. For measuring of mixing time, time of running increased for each reactor during simulation at different superficial gas velocity to reach the steady state condition. In this case increasing of more time has no effect on the volume fraction of air in the column. This time has expressed as mixing time. It means in this time the reactors have homogenous condition. The results of mixing time for both CFD simulation and experimental has reported in Figures 6 & 7 for reactors with 15 and 30 cm diameter respectively versus of different superficial gas velocity. As it is obvious, in these two reactors, mixing time values have reduced by increasing of superficial gas velocity dispersed in the columns. As shown in these two figures, there is a falling trend between increasing of superficial gas velocity and mixing time. In another word, it can be resulted from these two figs, that increasing of superficial gas velocity in the bubble columns leads to reducing of mixing time. This can be attributed to the average liquid circulation velocity (VC), which enhances with increase in Ug.31 The resulted of CFD simulation and experimental have a very good agreement as it is clearly seen in the Figures 6 & Figure 7.

Figure 6 Comparison between the experimental data and CFD results for mixing time in the reactor with 15 cm diameter versus superficial air velocity (Ug).

Figure 7 Comparison between the experimental data and CFD results for mixing time in the reactor with 30 cm diameter versus superficial air velocity (Ug).
Figure 8 shows the effect of column diameter on mixing time. As it is clearly seen, the mixing time decreases with increasing of bubble column diameter from 15 to 30 cm. this phenomenon is may be due to increasing of liquid circulation velocity with the increase in column diameter.31
Prediction of liquid circulation velocity in term of superficial gas velocity
After comparison of the CFD results and experimental data in previous sections for gas hold up and mixing time, it was found a very good agreement between CFD and experimental data. It was concluded that the CFD is a very useful and accurate tool for scaling-up and prediction as well. Thus in this section for more study on this type of reactors, a prediction of liquid circulation velocity was done by CFD.
The results for this prediction were shown in the Figure 9. It can be obviously concluded that while liquid circulation velocity (Vc) is low, the mixing time is high as it can be seen in the Figure 9. It means due to the relatively lower (VC) values than a lower energy is available for the liquid motion, which causes an increase in mixing time.
The results of comparison between predicted liquid circulation velocity for two reactors (15 and 30 cm diameter) versus of superficial gas velocity have came in the Figure 10. As shown in this fig, liquid circulation velocity approximately has increased by increasing the superficial gas velocity, although some deviations were observed for the reactor with diameter of 15 cm (in the Ug = 7, 9 and 10 cm/s) and for the reactor with 30 cm as diameter (in the Ug= 5, 8 and 10 cm/s). In the most of points, the simulated results followed the ascendant trends. There are the same results in the published literature.39
In this study, gas-liquid phase bubble column with the two various diameters were simulated by means of CFD instrument. The gas phase and liquid phase was air and water respectively. The effect of superficial gas velocity and reactor diameter on the some hydrodynamic parameters such as gas hold up and mixing time was investigated. The CFD results were supported by published experimental work. The results showed that the gas holdup is directly related to superficial gas velocity. It increased linearly with increasing of superficial gas velocity. But when reactor diameter was increased from 15 to 30 cm, gas hold up reduced. In addition it was resulted that increasing of superficial gas velocity and reactor diameter leads to decreasing of mixing time during the simulation and experimental. Moreover, a prediction was done for the effect of superficial gas velocity on the liquid circulation velocity. It was concluded that increasing of superficial gas velocity, leads to increasing overall liquid circulation velocity. It should be mentioned, the simulated results were in a very good agreement with the experimental results. Thus it was concluded that the CFD is a very useful instrument and accurate tool for scaling-up and prediction as well.
None.
The author declares no conflict of interest.

©2017 Bagheripour, et al. This is an open access article distributed under the terms of the, which permits unrestricted use, distribution, and build upon your work non-commercially.