International Journal of
eISSN: 2475-5559


Research Article Volume 4 Issue 3
1Aerospace Engineering, Indian Institute of Technology Kanpur, India
2HPCL Research Centre, Bangalore, India
Correspondence: Prof A Kushari, Department of Aerospace Engineering, Indian Institute of Technology Kanpur, Kanpur -208016, India, Tel 915122597126
Received: March 08, 2019 | Published: June 24, 2019
Citation: Kumar D, Sikroria T, Kushari A, et al. A twin-fluid injector for FCC feed injection. Int J Petrochem Sci Eng. 2019;4(3):109-115 DOI: 10.15406/ipcse.2019.04.00110
In Fluidized Bed Catalytic Cracking (FCC) process, hydrocarbon feed undergoes vapour phase cracking in presence of hot regenerated catalyst to produce valuable products like LPG, Gasoline and Diesel. FCC feed injection system is most critical hardware component of FCC unit in order to get desired product yield by minimizing the undesirable dry gas and coke yield. Typically, twin-fluid nozzles (hydrocarbon and stream) are used to atomize the feed. In the present study, a twin-fluid injector, with an internal impactor to minimize the droplet size and velocity, is designed, developed and characterized. The performance of the feeding injector was evaluated using water and air as operating fluids and the droplet size and velocity were measured 150 mm downstream of the injector tip using a PDPA system for different water and air flow rates. The average droplet size (D32) showed an increase while the droplet velocity remained almost constant with the increase in the liquid flow rate for a given flow rate of air, consistent with the increase in droplet size with decreasing air-liquid ratio for twin–fluid atomizers. But, for a given liquid flow rate, the droplet SMD decreased and the droplet velocity increased with increasing airflow rate, which can be attributed to the increase in overall kinetic energy due to the increase in air flow rate. The flow rate of liquid was seen to be independent of air flow rate unlike conventional twin-fluid atomizers. The droplet size was found to be a function of ALR and the local volume flux of the droplets was found to be a function of the liquid flow rate.
Keywords: fluidized bed catalytic cracking, twin fluid atomizer, internal impactor, PDPA measurement, drop size
Fluid catalytic cracking (FCC) is the primary conversion process in oil refining for a long time and is expected to remain so in the foreseeable future.1,2 In a typical FCC process, crude oil is atomized by an atomizer to form small droplets at the bottom of an FCC riser. The droplets, upon coming in contact with hot catalyst, are vaporized and subsequently cracked to lighter vapors and coke. The vaporized products rise through the riser. The catalyst and coke are separated from the hydrocarbon vapor in cyclone separators. The hydrocarbon vapor is sent to a distillation column for fractionation into selected products such as LPG, petrol, diesel, kerosene, etc. With today’s FCC technology, substantial amount of the cracking and coking occur close to the location of the feed injection. It is desirable to have faster vaporization of the fuel oil because vapor-phase cracking is faster and more selective than liquid-phase cracking. Many researchers3‒6 have studied FCC feed vaporization and have suggested that the process is essentially characterized by two stages, i.e., heat-up followed by evaporation. However, Huang et al.,7 have proposed an appreciable role of thermolysis through the cooling effect due to reaction endothermicity, particularly for heavy oils, which tend to form large drops because they are hard to atomize. Gupta et al.,8 have predicted an increase in overall conversion, gasoline yield and gas yield with decreasing drop size along with a decrease in the required regenerator temperatures for the catalyst. Need for smaller droplet sizes lead to the use of twin-fluid nozzles due to their inherent superiority over other atomizers9 for such applications involving heavy oils. Twin-fluid atomizers can be classified under two broad categories, i.e., gas-assisted and airblast.9 In gas assisted atomizers, a small amount of compressed gas is introduced into the liquid stream before its discharge from the nozzle orifice. Major portion of atomization energy is supplied by the compressed gas in gas-assisted atomizers through the interaction between the two-phases in the confines of the atomizer10‒15 resulting in fine atomization. Ferrira et al.,16 have successfully used twin-fluid atomizers to atomize heavy oils and have provided design guidelines for the same. Jolodar et al.,17 have conducted a detailed experimental study of a twin-fluid atomizer with a hard mixer consisting of a spiraling tube and a mixing chamber and have reported very good atomization quality. In the present study, a new concept for internally mixed twin-fluid atomizer is designed and developed, which is expected to improve the atomization process. Water and air were used as the two fluids to study the atomization process. Detailed measurement of the droplet size and velocity is carried out for a range of air-liquid ratio and the performance of the atomizer is quantified.
A schematic of the atomizer used in the present study is shown in Figure 1. It consists of a central tube of 6mm diameter through which water is supplied. The tip of this tube is blocked by a metal plate in which two 2mm holes are drilled so that the water jet can emerge out of the supply tube inside the atomizer assembly. Two holes of 2mm diameter is provided 18mm upstream from the exit of the central tube to allow a small amount of atomizing air to enter the liquid supply providing small acceleration to the liquid flow. Air is supplied into a hollow tube of 12mm diameter into which the liquid supply tube is inserted. A jet plate, with four 1.5mm diameter holes, is inserted into the air tube to allow acceleration of the air. An impactor plate is provided downstream of the liquid tube exit. The accelerated liquid jet impinges on this plate and breaks up into a multitude of droplets. The incoming air stream convects these droplets across the impactor plate through six rectangular slits of 4.5mm X 2mm. The spray is formed primarily inside the atomizer and is delivered out of the nozzle through four orifices of 3mm diameter located on a hemispherical tip. All the major components like the liquid supply tube, air supply tube, jet plate, impactor plate and nozzle tip are manufactured separately and are assembled through flanges provided with them.
Figure 2 shows a schematic of the experimental setup developed to investigate the performance of the injector. The injector was installed at the top of a spray chamber, which has the dimensions of 0.75m X 0.75m X 1.25m. The walls of the chamber are made of transparent glass that provided optical access to the spray. This spray left the system through a honeycomb structure downstream of the test section through a drain connected to an exhaust system. This arrangement was required to reduce the draft of mist generated in the process from contaminating the measurements. Droplet sizes and velocities were measured downstream of the injector exit, at a distance of 15cm, using a TSI® Phase Doppler Particle Analyzer (PDPA) system. A 5W argon-ion laser that provided a green light (i.e., 514.5mm) and blue light (i.e., 488mm) was used by the PDPA. A transmitting lens with a focal length of 500mm and a receiving lens with a focal length of 750mm were used in the optical path of the PDPA. The receiver was oriented at 30degrees forward scatter position with respect to the transmitter to gather light scattered by the droplets. Both the transmitter and receiver were mounted on a 3 axis traversing mechanism. This ensured that any point in the spray could be brought to the intersection of the laser beams. The droplet size and velocity data were collected and analyzed using Flowsizer software from TSI. On the average, the percentage of valid data ranged from 70 to 93% depending on the spray density and droplet sizes. The mass flow rates and supply pressures of both liquid and air were monitored using standard flow meters and pressure gauges (see Figure 2). The liquid and air supplies were controlled with a pressure regulating valve and a needle valve, respectively. All the results presented in this paper were obtained with water and room temperature compressed air from a laboratory compressor. The liquid was stored in a metallic container and was pressurized using compressed air to get the desired flow rate.
In the first set of experiments, the liquid flow rate was kept constant at a particular value and the airflow rate was varied from 2.6 X 10⁻³kg/s to 6.3 X 10⁻³kg/s. It was observed that the liquid flow rate is invariant with the airflow rate. This feature of the tested injector makes it different from conventional internally mixed injectors. In internally mixed injectors, the liquid flow rate decreases with an increase in airflow rate as more and more area inside the injector is occupied by air, “squeezing” the liquid to a smaller available area. In this process energy is transferred from the airflow to the liquid flow, which improves the atomization for the liquid.9‒16 Thus, invariance of liquid flow rate with an increase in airflow rate suggests a different mechanism for the droplet formation process. In order to understand the physics of the process, the liquid flow rate was varied between 0.5LPM (0.0085kg/s) to 1.5 LPM (0.0255kg/s), with a step of 0.1LPM, thus, covering a ratio of 3 for both mass and volume. For each liquid flow rate, the air flow rate was varied over the range mentioned above and the measurements of the droplet sizes, velocities (axial and radial) and the volume flux was taken at a distance of 150mm from the exit of the nozzle at the centerline of the spray. The data from these tests are presented in Figure 3–Figure 6.
Since, the injector is to be used to provide sprays for improved evaporation of the droplets that is best presented by the Sauter Mean Diameter (SMD),9 the variation of the Sauter Mean Diameter (D32) of the droplets with the variation in water flow rate for different air flow rates are presented in Figure 3. The data presented in Figure 3 show that the droplet SMD increases with an increase in water flow rate, with a variation of about 20mm for the range of liquid flow rates studied in this work, for a given air flow rate. However, for given water flow rate, the SMD decreases with an increase in air flow rate. But, the fractional decrease in droplet SMD with an increase in airflow rate reduces with an increase in air flow rate. On the other hand, the average axial velocity of the droplets at the measurement location, shown in Figure 4, remains almost constant over the range of liquid flow rates for a given air flow rate. However, a substantial increase in the droplet velocity is measured with an increase in the airflow rate for a given water flow rate. For example, the droplet velocity was about 20m/s for 2.6 X 10⁻³kg/s of airflow, which increased to about 40m/s when the air flow rate was increased to 6.3 X 10⁻³kg/s. The magnitude of mean radial velocity of the droplets, shown in Figure 5, is two orders of magnitude less than the axial velocity and the data for radial velocity is quite scattered, showing no specific trends. However, due to the low values of the radial velocity, the radial component can be neglected with respect to the axial component of the velocity. Therefore, it can be easily concluded that the droplet velocity is predominantly is the axial direction, which is expected as both the flows (i.e. water and air) are in axial direction without any swirler in the flow path of both the phases. The liquid volume flux through the measurement volume confirms the fact that the liquid flow rate is independent of the air flow rate as volume flux is seen to increase monotonically with the liquid flow rate but, it is almost invariant with the air flow rate. Since the local volume flux is a function of only the liquid volume flow rate, it can be represented in a functional form as:
Volume Flux = 106.23 (mw)0.3 (1)
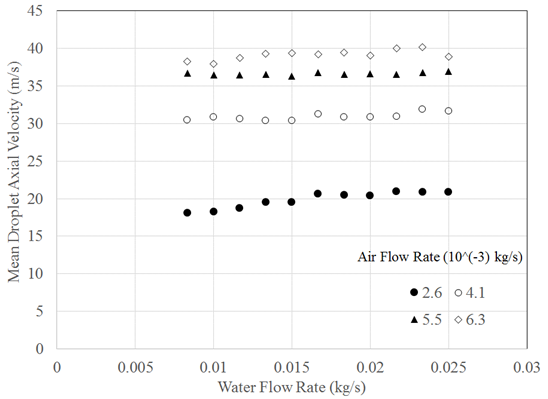
Figure 4 Variation of average droplet axial velocity with the water flow rate for different airflow rates.
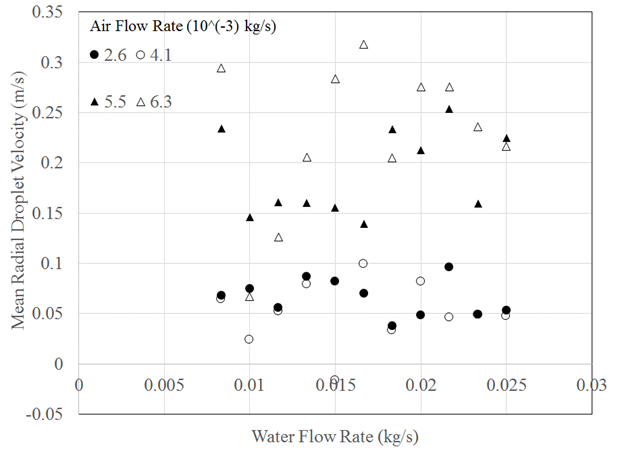
Figure 5 Variation of average droplet radial velocity with the water flow rate for different airflow rates.
Where; the Volume Flux is in (cc/cm2) and mw is the mass flow rate of water in kg/s.
Since the water flow rate was independent of the airflow rate, the air is not expected to participate in the primary atomization process. Therefore, arguably, the primary atomization is primarily due to the impingement of the liquid jet onto the impactor plate inside the atomizer. As the flow rate of water is increased for a given air flow rate, the kinetic energy of water increases, resulting in more energetic impingement with the impactor. However, due to the compact nature of the injector, the dispersion of the droplets is severely restricted inside the injector. Therefore, limited dispersion causes lack of acceleration of the droplets as can be seen in Figure 4, which shows that the droplet velocity is almost invariant with water flow rate for a given air flow rate. The function of the airflow is not to participate in the primary atomization process inside the atomizer but, in convecting the produced droplets out of the injector and into the test chamber. While doing so, the interaction of airflow and the droplets, within the confines of the injector, leads to secondary atomization. As the airflow rate is increased, the degree of secondary atomization also increases, resulting in the formation of smaller droplets as can be seen in Figure 3. Ferreira et al.,16 through their detailed parametric study, have established that the dominating parameter for atomization in twin-fluid nozzles in the momentum ration between the air and liquid flows. However, Lal et al.,18 have shown that the momentum ratio can be represented as a function of Air-Liquid mass ratio (ALR) for such atomizers. In the present study, the primary atomization is governed by the liquid flow rate and the secondary atomization is dictated by the airflow rate as discussed earlier. Therefore, ALR is expected to be the one parameter that will represent the process. Therefore, the data presented in Figure 3 is re-presented with ALR as the variable in Figure 7 and it is seen that the droplet size data for all the air flow rates and water flow rates converge onto a single curve. Through a simple power law curve fitting, the functional variation of droplet SMD as a function of ALR is given as:
SMD (mm) = 53.55 (ALR)−0.31 (2)
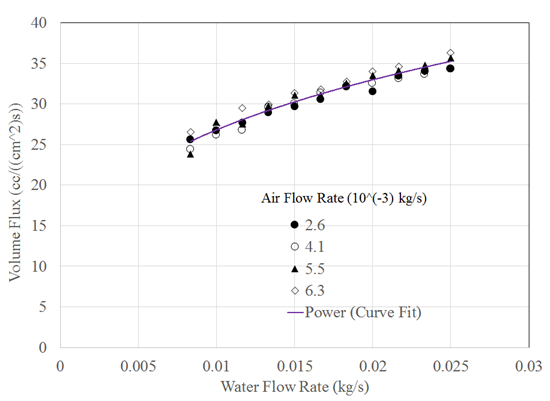
Figure 6 Variation of spray volume flux through the measurement volume with the water flow rate for different airflow rates.
The data presented so far were measured at a given point. In order to establish the representativeness of that point, measurements were taken along the X-Y plane at the same axial location (150mm) with a grid resolution of 1mm by traversing the PDPA system using the 3D traverse as mentioned earlier and the measured contours of the data rate, droplet axial velocity, droplet radial velocity and the SMD are presented in Figures 8–11.
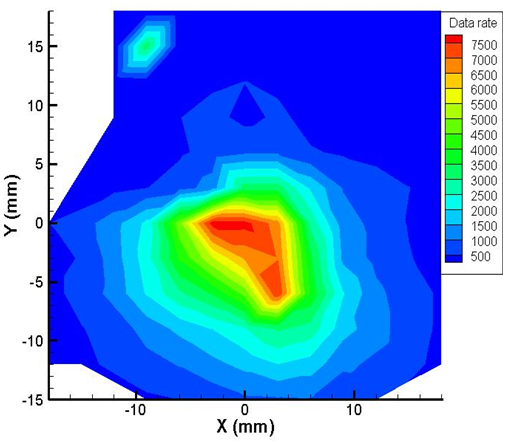
Figure 8 Data rate contour at 150mm downstream of the nozzle exit for water flow rate of 0.01kg/s and airflow rate of 4 X 10⁻³kg/s.
This set of measurements were taken for water flow rate of 0.01kg/s and the air flow rate of 4 X 10⁻³kg/s that corresponds to an ALR of 0.4. The measured data rate from the PDPA system along the X-Y plane at 150mm downstream from the nozzle exit is shown in Figure 8. The data presented in Figure 8 show that the data rate was maximum (order of 7500) at the center of the spray and reduces as one moves away from the center. A slight asymmetry along the Y direction is observed in the data rate contour presented in Fig. 8 with the data rate being higher in negative Y direction than that in the positive Y direction. However, higher data rate at the center, the point at which previous set of measurements were conducted, increases the confidence on the data presented in Figures 3‒7. Higher data rate at the center and reduces data rates away from the center suggests a solid cone spray having appropriate spray density and devoid of ligaments and non-spherical droplets.
The contour of the average axial velocities of the droplet along the X-Y plane at 150mm downstream of the nozzle exit is presented in Figure 9. The data in Figure 9 show that the droplet velocity was also maximum close to the center of the plane suggesting that the data presented in Figure 4 represented maximum velocity of the droplets in the measurement plane. Higher droplet velocities at the center also represent a solid cone spray. On the other hand, the radial velocity contour at the same plane presented in Figure 10 show that the radial velocity is almost zero at the center of the spray (similar to the data presented in Figure 5).
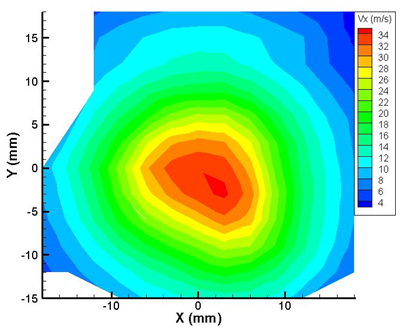
Figure 9 Mean droplet axial velocity contour at 150mm downstream of the nozzle exit for water flow rate of 0.01kg/s and airflow rate of 4 X 10⁻³kg/s.
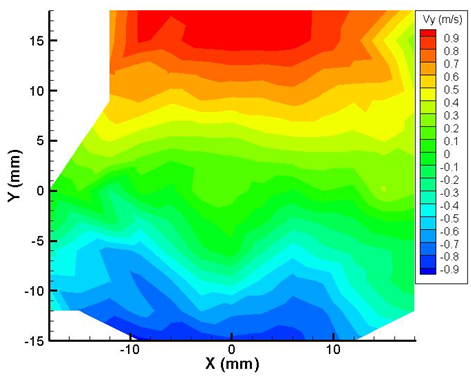
Figure 10 Mean droplet radial velocity at 150mm downstream of the nozzle exit for water flow rate of 0.01kg/s and airflow rate of 4 X 10⁻³kg/s.
However, the radial velocity is seen to increase towards the edges of the spray suggesting that the droplets have an outward velocity away from the center. But, in general the radial velocity was less than 1m/s in the entire plane, which suggests that the droplets are moving predominantly in the axial direction with very little radial dispersion. The planar spatial variation of droplet SMD at 150mm downstream of the nozzle exit for water flow rate of 0.01kg/s and airflow rate of 4 X 10⁻³kg/s is presented in Figure 11. The data in Figure 11 show that the droplet SMD at the central location of the spray is smaller with an increase in SMD as one move away from the center of the spray. Arguably, the smaller droplets have less mass and momentum associated with them and hence they are much easily convected downstream by the airflow. Furthermore, the smaller droplets attain the critical Weber number much faster and after that they flow with the air in their critical stage. On the other hand, the bigger droplets have higher momentum and energy after they are produced due to the impact of the liquid column on the impactor. Therefore, these droplets move towards the edges after impact as the axial flow passage is blocked at the impactor location. Due to this radial motion, the larger droplets have higher radial velocities as seen earlier in Figure 10 as compared to the smaller droplets at the central region of the spray. The air flow convect these droplets as well but due to their larger sizes, they slow down to a smaller axial velocity, as seen in Figure 9, due to higher aerodynamic drag acting on them. Further away from the centre of the spray, the droplets come in contact with the ambient air and due to the shearing forces between the moving droplets and still air, the droplets breakup into smaller sizes again as seen in Figure 11.
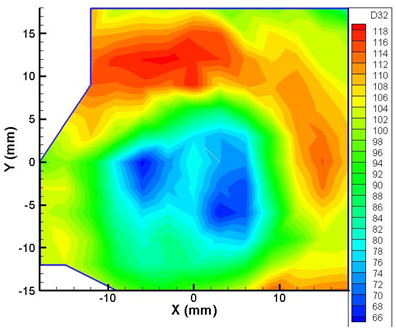
Figure 11 Sauter Mean Diameter of droplets at 150mm downstream of the nozzle exit for water flow rate of 0.01kg/s and airflow rate of 4 X 10⁻³kg/s.
The variation of droplet SMD in the Y direction along X=0 line and in the X direction along Y=0 line are shown in Figure 12. It can be seen that along both these lines the trend show similar patterns, i.e., the droplet size is minimum at the center of the spray, followed by an increase on both sides of the center. Further away from the center, the droplet size reaches a maximum at certain radial location and beyond that it starts to decrease again towards the edge of the spray due to the secondary breakup of droplets because of shearing with the ambient air. A slight asymmetry is observed in all the contour plots which can be attributed to the manufacturing defects as all the components and holes were quite small in size and hence small manufacturing errors can very easily lead to higher percentage deviations from the intended dimensions. In summary it can be said that the developed injector eliminates one of the shortcomings of conventional gas-assisted atomizers in which the liquid and gas flow rates are coupled. In such atomizers, a variation in the gas flow rate leads to a change in the liquid flow rate as well and hence, the liquid throughout and the atomization quality is inter-linked. But, in the present atomizer, the atomization quality depends only on ALR and required droplet size can be achieved for a given liquid flow rate by varying the amount of gas to be used for atomization. Therefore, the developed atomizer can be used for a wide range of conditions and can be a good candidate for the fuel feed system of an FCC process.
A new type of twin-fluid injector is designed and developed that incorporates an impactor plate with rectangular slots inside the injector. Primary atomization is due to the impingement of water jet onto the impactor plate. The droplets thus produced are convected downstream by the air, which does not take part directly in the primary atomization process. The water flow rate is independent of the airflow rate. This feature makes the developed injector unique among the twin-fluid atomizers. The droplet size is seen to be a function of ALR and is seen to decrease with an increase in ALR. The spray produced the atomizer is a solid cone spray with smaller droplets at the center and larger droplets away from the center followed by further reduction in the droplet size towards the edges of the spray. The droplets move predominantly in the axial direction with very smaller radial components of velocities.
ALR, Air-Liquid Mass Ratio; mw, Water mass flow rate (kg/s); PDPA, Phase Doppler Particle Analyzer; SMD, Sauter Mean Diameter (mm)
None.
Author declares that there are no conflicts of interest.

©2019 Kumar, et al. This is an open access article distributed under the terms of the, which permits unrestricted use, distribution, and build upon your work non-commercially.