International Journal of
eISSN: 2475-5559


Research Article Volume 1 Issue 4
1Faculty of Engineering Sirte University, Sirte-Libya
1Faculty of Engineering Sirte University, Sirte-Libya
2Department of Chemical and Biochemical Engineering, Missouri University of Science and Technology, USA
2Department of Chemical and Biochemical Engineering, Missouri University of Science and Technology, USA
Correspondence: Abdelsalam Efhaima, Department of Chemical and Biochemical Engineering, Missouri University of Science and Technology, USA, Tel 5732021860
Received: October 30, 2016 | Published: November 29, 2016
Citation: Efhaima A, Dahhan MHAl. Hydrodynamics study in a fluidized bed reactor using gamma ray computed tomography (CT) technique. Int J Petrochem Sci Eng . 2016;1(4):92-96. DOI: 10.15406/ipcse.2016.01.00017
The main goal of this study is to further understand the fluidized bed hydrodynamics by determining the effects of superficial gas velocity and bed density on the hydrodynamics of gas-solid fluidized beds by using a 14-cm-diameter Plexiglas cylindrical fluidized bed column, air at room temperature was used as the fluidizing gas, two different Geld art type-B particles were used glass bead and copper particle with material densities of 2500, 5300 Kg/m3 respectively with the same size particle 210 µm. Three different superficial gas velocities were investigated Ug=25, 30, and 35 cm/s. Non-invasive flow measurement technique gamma ray computed tomography (CT) has been used to measure the time-averaged cross-sectional and radial profiles of solids and gas holdups distribution. The results show that local time-averaged gas holdup is a function of bed material density, that as material density decreases, gas holdup increases, gas holdup increases with increasing superficial gas velocities.
Keywords: Fluidized beds hydrodynamics; Computed Tomography; Gas hold-up
Fluidization is a process in which solid particles become suspended and fluidized at a high enough gas velocity (higher than minimum fluidization velocity). Due to many advantages such as high rates of heat and mass transfer, low pressure drop, approximately uniform temperature distribution and the ability to fluidize many particle types of different densities and sizes. The gas-solid fluidized bed reactor (FB) employed as gas-solid reactor in many industrial applications like drying of granular materials, cooling of fertilizers, pharmaceutical industries, coal combustion and gasification, chemical process, petroleum, mineral, roasting, gas adsorption operations and gas phase polymerization.1
In spite of these advantages, lack of reliable knowledge about the hydrodynamics behaviour, has limited their application, therefore, any attempt for better understanding the fluidization phenomena, which would result in a more reliable design of fluidized reactors and efficient operation.
The prediction of performance of these systems when used as reactors or as contactors for heat and mass transfer depends on our ability to quantify the hydrodynamics in these systems. In addition, fluidized bed hydrodynamic behaviour is very complex. The performance of these multiphase fluidized bed reactors greatly depends on their hydrodynamic properties. Gas or solids holdup is important in understanding fluidization hydrodynamics. Gas holdup is also useful in finding the interfacial area between the dense and dilute phases that are used in heat and mass transfer calculation. To investigate the complex hydrodynamics in fluidized columns successfully, techniques that are capable of making local measurements over the entire column volume, with an extensive and non-intrusive data collection process, are the need of the hour.
A review of the literature reveals that the experimental techniques used thus far are either intrusive and provide only local measurements, which are limited to flow conditions that are characterized by low gas holdup, or yield only a global measurement. A technique which has none of the above shortcomings is x-ray or γ-ray tomography.
Efhaima & Al-Dahhan2 used gamma-ray computed tomography (CT) technique to investigate local time-averaged gas hold-up in 14 cm Plexiglas fluidized bed reactor.2 Found that the gas holdup increased with an increase in the superficial gas velocity. In addition, the local time-averaged gas holdup is a function of bed material density.
Franka & Heindel3 studied the effects of side air injection, superficial gas velocity, and bed material on the local time-average gas holdup of a 10.2 cm fluidized bed, using X-ray computed tomography. Using different materials (glass beads, ground corncob, and ground walnut shell), superficial gas velocities (Ug), and side air injection flow rates (Qside). They determined the variations on the fluidization hydrodynamics of the bed. They found that with side air injection, the side air flow rose near the wall but then expanded into the bed as height and Qside increased. As Ug increased the effects caused by the side air injection were less pronounced.
Hau & Banerjee4 used a densitometer (a source and a single detector) to get a set of 14 horizontal and vertical chordal attenuation measurements to obtain the gas distribution for a horizontal two-phase flow. These studies were preliminary in nature, demonstrating the applicability of tomography for studying two-phase flows.
De Vuono et al.5 made a parametric analysis for the design of a CT scanner for studying two-phase flow systems. They provided the criteria for the optimal choice of scanner parameters given some requirements, such as the size of the object to be scanned and the temporal resolution desired.
Seville et al.6 used a single-source single-detector arrangement capable of translation and rotation about the test section. They obtained the voidage structure in the jet region of a fluidized bed. The total time for scanning one section was 6-7 hours.
In this study the effects of gas velocity and material density on local time-averaged gas holdup in fluidized bed are investigated by using gamma ray computed tomography technique (CT). Therefore, our detailed local measurements of the cross-sectional distribution and radial pro-files of solids and gas holdups will be valuable benchmarking data to evaluate and validate these CFD.
The experimental works were carried out in 14 cm cold flow fluidized bed. A schematic diagram of the setup used in this study is illustrated in Figure 1. The 14 cm column was 1.68 m high connected from the top with an upper section that had a diameter of 42 cm and was 84 cm high; this upper section of the fluidized bed (the disengagement zone) had a larger diameter to reduce the superficial gas velocity of the gas phase to enhance the solids separation. The plenum was located at the bottom, which consisted of a sparger tube. The gas phase at ambient temperature was introduced through a distributor at the bottom after passing through the sparger. The gas distributor was made of a porous polyethylene sheet and had a pore size of 40 µm. The sparger was plugged at one end, and had 14 holes, all facing downward with respect to the column. The properties of solids, static bed height used in the experiments are listed in Table 1.
Properties |
Glass Beads |
Copper Particle |
Particle Diameter (µm) |
210 |
210 |
Static Bed Height ( H/D) |
2 |
2 |
Superficial Gas Velocities (cm/s) |
20,25,30,40 |
25,35,40 |
Particle Density ( Kg/m3) |
2500 |
5300 |
Minimum Fluidization velocity (m/s) |
0.12 |
0.2 |
Table 1 Summarizes the bed materials and their properties.
Dual Source Gamma Ray Computed Tomography (DSCT)
DSCT consists of two sealed sources (Cs-137 and Co-60) and two sets of 15 NaI detectors located in front on each sealed source as shown in Figure 2. In this work CT experiments were performed under two-phase conditions gas and solids, and hence a single sealed source (Cs-137) and its related 15 NaI scintillation detectors located opposite to the (Cs-137) sealed source has been used. As shown in Figure 2 the sources and detectors are built on a rotary plate to move together in 360˚ around the studied bed providing 197 views in each scan and 21 projections in each view. The entire assembly could be moved up and down by stepper motor along the bed height to scan the bed at different axial positions. Each detector consists of a 2-inch cylindrical NaI crystal, a photomultiplier and electronics. Each of these detectors was collimated with a lead collimator with an open aperture. The technique has been described in literature authored by, Efhaima & Al-Dahhan.2Furthermore, a detailed discussion of the CT technique, related mechanical assembly, electronics data acquisition, the operation, and the Alternative Minimization (AM) algorithm used for image reconstruction can be found elsewhere.7-13
All CT scans were acquired at one fixed axial position, H/D=1.7. CT measurements were repeated in the 14 cm diameter column with the glass bead-gas system on two successive days to demonstrate the reproducibility. The time-averaged cross-sectional gas holdup distributions and the radial gas holdup profiles exhibit good reproducibility Efhaima & Al-Dahhan.2
Effect of superficial gas velocity on phases holdup distribution
The reconstructed images which are processed using the data obtained through CT scans provide the time-averaged cross-sectional gas and solid holdups distribution at a given axial level. As mentioned earlier, CT experiments were performed under two-phase conditions, gas and solids, and hence (gas holdup + solid holdup =1). Figure 3 shows the time-averaged gas holdup distribution at 0.24 m (H/D =1.7) above the distributor for 14 cm fluidized bed using an air-solid system (glass beads, 210µm) at different superficial gas velocities. The gas holdup data were averaged over the cross-section by numerical integration based on the trapezoidal rule:
(1)
The cross-sectional averaged value was about 0.32 at superficial gas velocity 25 cm/s and the magnitude of the gas holdup increased by 42% and 56% when the superficial gas velocity increased from 25 to 30 cm/s and from 25 to 35 cm/s, respectively. Figure 3, shows that the local gas holdup was greater near the centre-line of the bed compared to that near the wall. It was observed that gas holdup increased as the superficial gas velocity increased; this was due to a higher volume of air passing through the bed, and confirms a trend identified by Mabrouk et al.14 In addition, increasing in superficial gas velocity enhances mixing throughout the bed, and increases the bed expansion and the overall gas holdup in the system. At Ug=25 cm/s, a high local gas holdup is concentrated in the center of the bed and extended to the region near the bed wall. This behavior indicates that the air is flowing throughout the bed. Increasing the superficial gas velocity to 30 cm/s enhances mixing throughout the bed, and higher gas holdup is located in the core of the bed, while lower solid holdup (solid concentration) are found along the bed walls. This behavior indicates that, the air is flowing mostly through the center of the bed; the local gas holdup is more symmetrically distributed through the bed. When the superficial gas velocity further increased, (Ug=35cm/s), large bubbles erupted from the bed near the center, throwing glass beads against the wall, which fell back into the bed, these hydrodynamics created a high gas holdup region in the center of the bed, while lower gas holdup regions (higher solids concentration) were found along the bed walls.
To examine further the relationship between the changes of local solids concentration changing and superficial gas velocity and spatial position, the representing probability density function (PDF). Figure 4 displays the probability density functions of the gas holdup distribution values in the pixel cells. PDF characterizes the gas holdup variation values along the pixel cells at different superficial gas velocities. The variation in the corresponding mean, variance and standard deviation, which were directly calculated by MATLAB functions, increased with an increase in superficial gas velocity. The maximum variance of gas holdup was found to be less than 1.4%, while the standard deviation varied less than 12%.
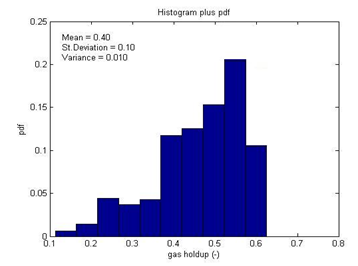
(a) Ug = 25 cm/s
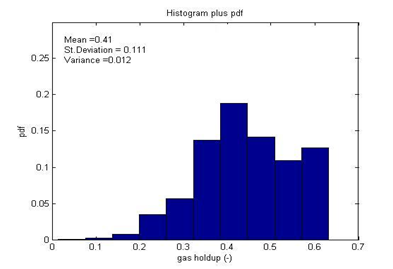
(b) Ug = 30 cm/s
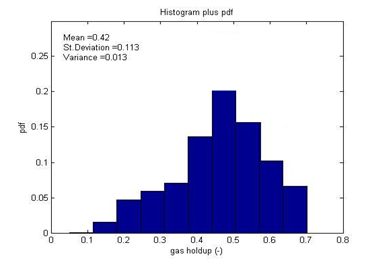
(c) Ug = 35 cm/s
Effects of particle density on Time-averaged solids holdup radial profiles
The time-averaged solid holdup radial profiles obtained by averaging of the data at H/D =1.7 for both glass bead-gas and copper particle-gas systems respectively at different superficial gas velocities 25 and 30 cm/s are depicted in Figure 5. It has been observed that the solid holdup radial profiles are similar in shape. As mentioned in the measurement technique section, CT experiments were performed under two-phase conditions, gas and solids, and hence (gas holdup + solid holdup =1). The gas holdup increases as the superficial gas velocity increases and this is primarily attributed to a higher volume of air passing through the bed, the variation of the averaged solid/gas holdup with gas superficial velocity is linear, and confirms a trend identified by Mabrouk et al.14 Figure 5a & 5b shows the time-averaged solid holdup radial profiles obtained for both glass beads-gas and copper particle-gas systems, respectively, at 25 and 30 cm/s, superficial gas velocities. It can be observed that the local time-averaged gas holdup is a function of the bed material density, as the material density decreased, gas holdup increased and solid holdup decreased. The bed with copper particles was shown to have higher sold holdup than the glass bead bed, which exhibited a lower solid holdup.
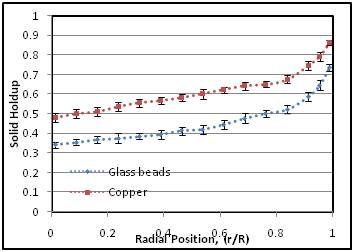
at Ug = 25 cm/s.
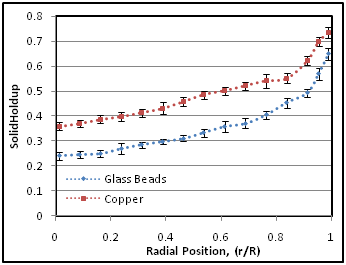
at Ug = 30cm/s.
In addition Figure 5 show that the general fluidization behaviour was similar for glass beads and copper particles, with a region of higher gas holdup in the center, and a region of low gas holdup (higher solids concentration) near the walls. Similar results were revealed by Franka et al.15 for two different 3D beds and Escudero et al.16
This study is part of much more extensive study and many lab experiments. The fluidization hydrodynamics of two bed materials were compared in this work. The time-averaged gas and solid holdup distributions were measured in a 14-cm fluidized bed column using the high resolution gamma-ray computed tomography (CT) scanner at fixed axial position, which is (H/D =1.7) with different superficial gas velocities 20, 25, 35 cm/s, which cover the fluidization and bubbly flow regimes. In order to investigate the effect of superficial gas velocity and particle density on gas and solid holdup distributions, glass bead and copper particle were used as the bed materials. Local time-averaged gas holdup is a function of bed material density that as material density decreases, solid holdup decreases. The bed with copper particles was shown to have higher solid holdup than the glass bead bed, which exhibited a lower solid holdup for all the three superficial gas velocities. In addition, the two materials exhibit a similar fluidization structure, with region of higher gas holdup in the centre, while region of low gas holdup (higher solids concentration) near the wall, confirming the results described by Escudero et al.16 Gas holdup increases as superficial gas velocity increases for both bed materials; this is primarily attributed to a higher volume of air passing through the bed. It also seems that while superficial gas velocity significantly affects fluidization hydrodynamics, it appears that changes in superficial gas velocity do not significantly affect fluidization symmetry as it can be seen in Figure 4.
The authors wish to acknowledge the Libyan Ministry of Education for sponsoring the primary author’s study within the Chemical Engineering Department at Missouri University of Science and Technology. The Gamma ray facility used in this research was funded by Dr. Al-Dahhan.
The author declares no conflict of interest.

©2016 Efhaima, et al. This is an open access article distributed under the terms of the, which permits unrestricted use, distribution, and build upon your work non-commercially.