International Journal of
eISSN: 2470-9980


Research Article Volume 5 Issue 2
Oromia Agricultural Research Institute, Bako Agricultural Research Center, Ethiopia
Correspondence: Tesfaye Mersha, Oromia Agricultural Research Institute, Bako Agricultural Research Center, Ethiopia
Received: January 11, 2018 | Published: September 4, 2018
Citation: Mersha T. Spatial distribution of blackleg outbreak in different regions of Ethiopia. Research Article. 2018;5(5):26-32. DOI: 10.15406/ijvv.2018.05.00098
In Ethiopia, cattle play an important role in the livestock industry through provision of meat, milk, manure, and row materials for the processing industries. However, diseases are an important bottle-neck for livestock productivity in our country. Among many livestock diseases, blackleg is one of particular interest in this disease outbreak and its spatial distribution report. The study was conducted on all cattle population of the country. The total cattle population for the country is estimated to be about 53.99 million. Out of this total cattle population, the female cattle constitute about 55.48 percent and the remaining 44.52 percent are male cattle. Regarding age groups, the majority of the cattle population (that is about 63.64 percent) is in the 3 years and less than 10 years age category, with about 27.5 percent male and 36.13 percent where female, moreover about 16.43 percent are between age one and three years. There is no any report on blackleg disease regarding its controlling strategies and economic importance in Ethiopia. Hence, all livestock population within the country is at risk from endemic strain of this bacterial disease. In addition, there is no clear picture regarding the distribution pattern and prevalence of the disease in different regions of the country. Therefore, the objective of the present report is to visualize the spatial distribution of blackleg disease outbreaks in different regional states of Ethiopia. As the result of spatial distributions of blackleg outbreak shows, all most all parts of livestock population of the country except Somali and Gambella regions, affected by blackleg disease. Especially, Amhara and Oromia were highly affected regions of the county. Generally, as the result confirmed that blackleg is an endemic disease in Ethiopia and can be considered as one of the bottleneck diseases in livestock industry of the country. Therefore based on above conclusions the following recommendations are forwarded; A regular and strategic vaccination should be given uniformly throughout the country. Further research should be done in line with the epidemiological situation of the disease and their controlling methods as general.
In Ethiopia, cattle play an important role in the livestock industry through provision of meat, milk, manure, and row materials for the processing industries. Despite its importance, cattle production is failing the local marketing demand, due to increased human population and growth income. Therefore, there is need to improve the productivity of cattle, which is relatively low at this moment to meet this demand. However, diseases are an important bottle-neck for livestock productivity in our country. Among many livestock diseases, blackleg is one of particular interest in the country. Blackleg is a highly fatal disease caused by the spore forming, rod shaped, gas producing bacteria Clostridium chauvoe and the spores of the organism can live in the soil for many years.1 It is disease of young cattle or sheep of any age. The disease is seen as acute, localized inflammation of muscle tissue due to growth of the blackleg organism. This is followed by generalized toxemia or poisoning of the animal causing rapid death.2 The bacteria enter the calf by ingestion and then gains entrance to the body through small punctures in the mucous membrane of the digestive tract. Cattle population that is on a high plane of nutrition, rapidly gaining weight and between 6 months and 2 years of age are the most susceptible to the disease.3
The disease is not transmitted directly from sick animals to healthy animals by mere contact. The first sign observed are usually lameness; loss of appetite, rapid breathing and the diseased animal is usually depressed and has a high fever. In addition, swelling characteristics develop in the hip, shoulder, chest, back, neck or elsewhere.4 First the swelling is small, hot and painful. As the disease progresses, the swelling enlarges and becomes spongy and gaseous. If you press the swelling, gas can be felt under the skin. The animal usually dies in 12 to 48 hours. In most cases the animal is found dead without being previously observed sick. The speed with which blackleg kills usually makes individual treatment useless.5 In some cases large doses of appropriate antibiotics can result in a cure. Veterinary attention in the early stages can therefore be considered. Treatment is generally unsuccessful. Blackleg is almost entirely preventable by vaccination. The most commonly used clostridia vaccination in cattle is the 7-way type which protects against Clostridium chauveoi (blackleg), Clostridium septicum and Clostridium sordelli (malignant edema), Clostridium novyi (black disease), and three types of Clostridium perfringens (enterotoxemia).6 Although many of the diseases could be controlled, available vaccine technology, timely recognition of the disease followed by acquisition of the pharmaceuticals are lacking due to the shortage of infrastructure facilities to support health services delivery in the country. Consequently, the majority of disease intervention consists of mass inoculations following outbreaks rather than preventive measures.7
There is no any report on blackleg disease regarding its controlling strategies and economic importance in Ethiopia. Hence, all livestock population within the country is at risk from endemic strain of this bacterial disease. In addition, there is no clear picture regarding the distribution pattern and prevalence of the disease in different regions of the country. Therefore, the objective of the present report is to visualize the spatial distribution of blackleg disease outbreaks in different regional states of Ethiopia.
Study area
Ethiopia is found in tropics and specifically located at 3 degree and 14.8 degree latitude, 32.5 degree and 48 degree longitude in the Eastern part of Africa lying between the Equator and the Tropic of Cancer. The total country area is about 1.4 million square kilometers and constitutes about 90 million human populations. The country has been divided into nine regional states which are called Tigray Region, Afar Region, Amhara Region, Oromia Region, Somali Region, Benishangul Region, Southern People nations and nationality (SNNP) Region, Gambella Region and Harari and further divided in to more than 689 districts. About 80% of the populations live in rural areas and their livelihood depend on agriculture (crop production, livestock production and/or mixed/crop-livestock).
Study population
The study was conducted on all cattle population of the country. The total cattle population for the country is estimated to be about 53.99 million. Out of this total cattle population, the female cattle constitute about 55.48 percent and the remaining 44.52 percent are male cattle. Regarding age groups, the majority of the cattle population (that is about 63.64 percent) is in the 3 years and less than 10 years age category, with about 27. 5 percent male and 36.13 percent where female, moreover about 16.43 percent are between age one and three years and those with age category 10 years and over took small portion i.e. 2.53 percent of the total estimated number of cattle population8 (Figure 1) (Figure 2).
Data collection methodologies
In Ethiopia if each regions and their respective zones and districts encountered different disease outbreaks they report to ministry of livestock and fisheries in order to get immediate response and notify the outbreak information to other partners of the country. Then the disease outbreaks data were stored in computers and utilized for further analysis and reports writing for the purpose of identify their economic impact and status of the diseases in general as a country and then planning, designing prevention and controlling strategies. Most of the time outbreak data is collected through mobile cell phone and/or through report papers from each respective districts of the country. So that, for this report writing blackleg outbreak data was obtained as soft copy form of excel spreadsheet, from ministry of livestock and fisheries. For this report paper, only 2012 and 2013 years blackleg outbreak data was utilized in order to visualize the spatial distribution of the disease among the Ethiopian administrative regions.
Data analysis
Analysis tools used: Q-GIS software used to manipulate and analyze excel spread sheet stored disease outbreak data. Then after by application of different Q-GIS tools such as Vector overlay operation tools (union and intersect), table joint and vector styling the spatial distribution of blackleg disease outbreak was mapped as a country.
Major steps followed are: Step 1: Excel data editing (making similar the name of districts of the outbreak area with that of the name of district on spatial data base) and saved as CSV delimited format.
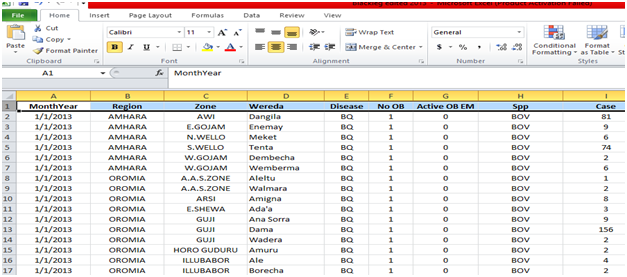
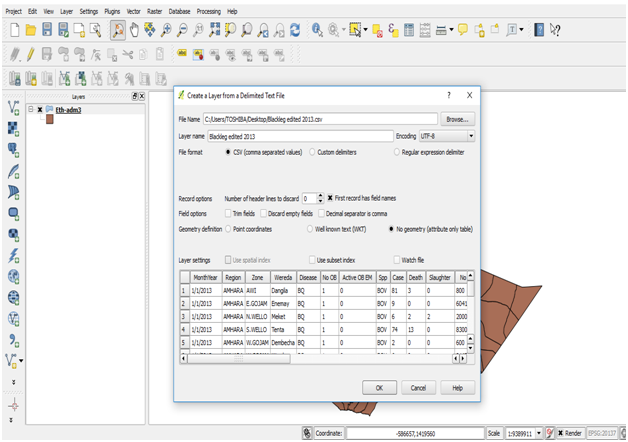
Step 2: Opening Q GIS software and importing Ethiopian Adm3 through add vector layer and excel CSV delimited format data through add delimited text layer.
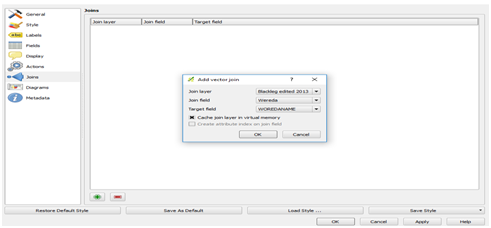
Step 3: Through the application of table joint the imported excel data was merged or joined with spatial data base.
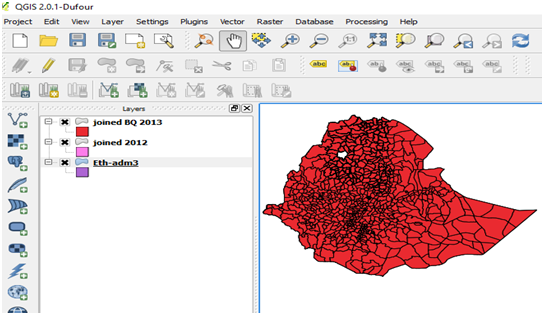
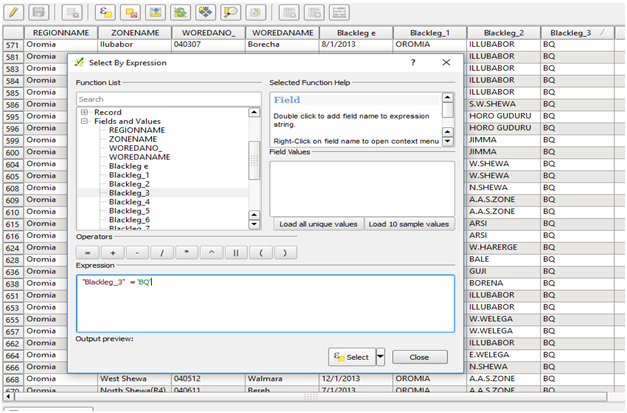
Step 4: Through opening working attribute and by application selection feature selected disease outbreak areas, accordingly.
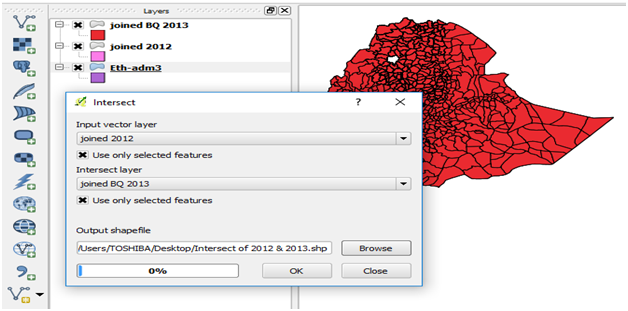
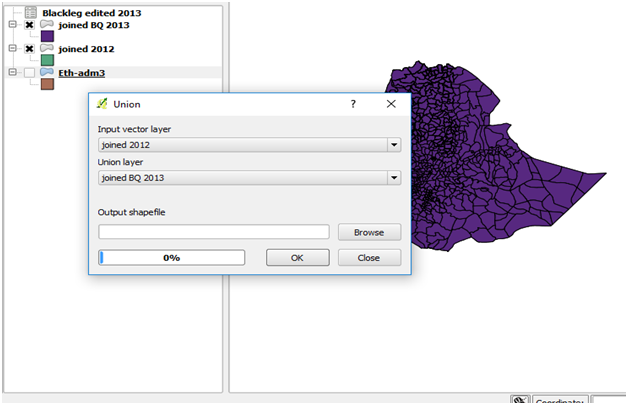
Step 5: Through vector overlay operations (intersect and union) finding each district that faced disease outbreaks for the consecutive two years (2012 and 2013) and total districts of blackleg outbreak occurred areas.
Spatial distribution of blackleg outbreak areas in 2012
The following map shows blackleg outbreak areas that occurred in 2012 throughout the country. As the map describes except two regions (Somali and Gambella) the outbreak of blackleg was occurred all most all parts of the country. However, regarding Somali and Gambella region there is no evidence whether the disease truly absent in the regions or the failure of outbreak report to the federal government. Particularly Amhara and Oromia regions were the most affected parts of the country. The spatial distribution of blackleg outbreak distribution in 2012 showed as follow (Figure 3).
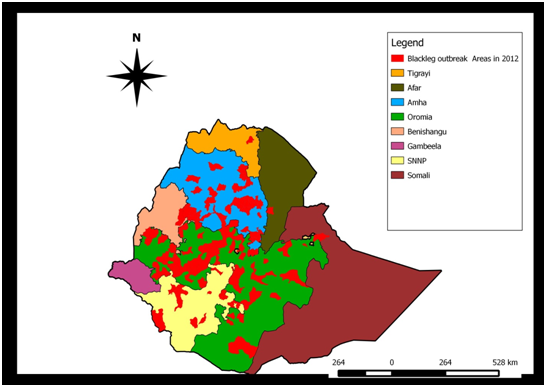
Figure 3 Map describes spatial distribution of blackleg outbreaks in 2012, across Ethiopian administrative regions.
Spatial distribution of blackleg outbreak areas in 2013
In 2013 unlike to that of 2012 the disease outbreak coverage somewhat decreased as the map shows. However, Tigray, Amhara, Oromia and SNNP regions where, still affected largely whereas Somali, Afar, Benishangul and Gambella regions where not reported blackleg outbreak. As the spatial distribution of the disease outbreak map revealed among affected regions Oromia and Amhara regions were highly affected parts of the country. The spatial distribution of blackleg outbreak distribution in 2013 showed as follow (Figure 4).
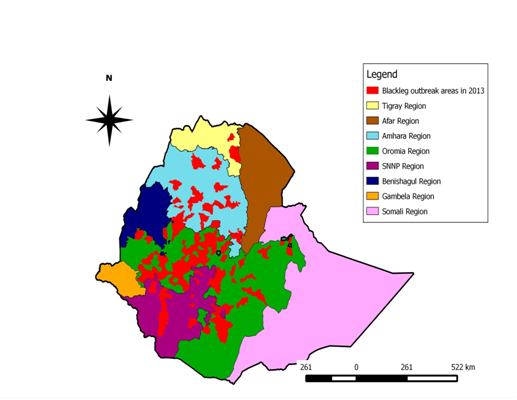
Figure 4 Map describes spatial distribution of blackleg outbreaks in 2013, across Ethiopian administrative regions.
The intersection of Blackleg outbreak areas in years 2012 and 2013
As the result of this spatial disease outbreak map describes all most all parts of blackleg outbreak reported areas of 2012 were also reported once again in 2013. It can be said that these areas as, repeatedly affected blackleg outbreak areas. Therefore, it can be concluded that these areas were the most affected parts of the country due to the disease. As the spatial disease map shows central parts of Amhara regions and central and western parts of Oromia regional state were highly affected. The spatial intersection of outbreak areas of year 2012 and year 2013 was described as follow (Figure 5).
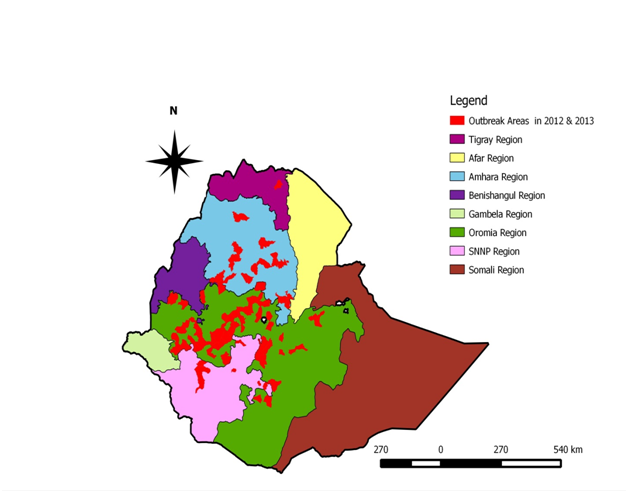
Figure 5 Map describes the intersection of spatial distribution of blackleg outbreak areas for years 2012 and 2013.
Total blackleg outbreak coverage in the consecutive two years (the union of outbreak areas of 2012 and 2013)
This was obtained by the union of the spatial distribution blackleg outbreak areas of 2012 and 2013. This spatial disease map used to visualize or appreciate the extent blackleg distribution within the country in relation to time period. And it can also use to predict how much the country affected due to this disease through visualizing total areas of outbreak coverage. As the result of spatial disease outbreak map revealed all most all parts of the country affected with the disease except Gambella and Somali regions which is unreported cases. Particularly, the three regions (Amhara, Oromia and SNNP) were largely affected parts of the country. The total coverage of blackleg outbreak area in year 2012 and year 2013 showed as follow (Figure 6).
The intensity or the severity of the outbreak was different area to area for instance some areas were encountered high disease fatality rate while other areas were low disease fatality rate. Therefore, without scientific evidence of classification mean with no reference of cutting point, the level of case fatality rate of the disease outbreak was categorized in to three (low, medium and high) based on personal judgment. Therefore, according to this classification most parts of outbreak areas were registered low case fatality rate where as other disease outbreak areas were encountered medium and low case fatality rate. The level of blackleg outbreak fatality rate observed as follow (Figure 7).
As the result of spatial distributions of blackleg outbreak shows, all most all parts of livestock population of the country except Somali and Gambella regions, affected by blackleg disease. Especially, Amhara and Oromia were highly affected regions of the county. Generally, as the result confirmed that blackleg is an endemic disease in Ethiopia and can be considered as one of the bottleneck diseases in livestock industry of the country. Therefore based on above conclusions the following recommendations are forwarded;
First of all would like to thank my Almighty of God whom helping me in order to successfully complete this Project Assignment, Then, I would like to forward my deepest thanks and appreciation to Dr. Samson Leta who was the reason to undergo this very interesting project.
None.

©2018 Mersha. This is an open access article distributed under the terms of the, which permits unrestricted use, distribution, and build upon your work non-commercially.