International Journal of
eISSN: 2573-2838


Research Article Volume 4 Issue 2
1Hirosaki University, Japan
2North Japan Research Institute for Sustainable Energy, Hirosaki University, Japan
Correspondence: Kenji Itaka, North Japan Research Institute for Sustainable Energy, Hirosaki University, 2-1-3 Matsubara, Aomori, 030-0813, Japan
Received: April 02, 2018 | Published: April 11, 2018
Citation: Chahtou A, Benioub R, Itaka K. Optimization of heating-temperature on carbothermal reduction of alumina for production of aluminum. Int J Biosen Bioelectron. 2018;4(2):67–72. DOI: 10.15406/ijbsbe.2018.04.00099
Recently the study of aluminum-based surface plasmon resonance sensors (SPR) for real-time, label-free, and multiplexed detections for chemical and biomedical applications have attracted a considerable attention due to the effective stability of aluminum compared to conventional noble metals such as Ag and Au. Currently, the electrolytic Hall-Heroult process represents the conventional and commercialized process for the production of aluminum from alumina. However, this process suffers from higher cost due to its immense energy requirements, and a number of by-processes implicated to reach the final product. In this paper, to overcome such advantages of the conventional process, the carbothermal reduction process of alumina using an induction heating furnace and carbon as a reductant agent were investigated to determine the optimum heating temperature condition for the achievement of a higher yield of the process. The phase diagram for the aluminum-oxygen-carbon represents quite a valuable asset. Therefore it was simulated and used to determine theoretically the temperature and gas conditions used for the experimental process. The optimum heating temperature of 1750ºC was determined based on the analyzing of the experimental results based on the comparison of the obtained Al yield for various heating temperature profiles.
Keywords: aluminum production, carbothermal reduction, heating temperature, mass balance
Real-time sensing for many application such as safety of food, medical diagnostic and monitoring of environment represents nowadays a requirement to maintain our daily life tasks.1–3 Surface plasmon resonance (SPR) sensing is label-free capable sensors to fulfill such tasks due to their simplicity and easy to use, their small detection volume and assurance of multiple detections.4–5 However, commercially, the majority of produced SPR sensors are made of noble metals such as Au and Ag due to their low optical losses in visible-infrared range and chemical stability.6 In the other side, Ag is known for its easy oxidation, which requires the deposition of a passivated dielectric film, which led to a high cost of SPR sensor production based on noble metals.7 Recently, SPR-based aluminum sensors technology has emerged due to the cost-effectivity and stability of aluminum metal.8–10 The current industrial production process of Aluminum (Al) is Hall-Heroult process which includes two sub-processes,11,12 starting by the dissolving of Alumina (Al2O3) infused Cryolite (NaF-AlF3), 13,14 and followed by electrolysis via direct current and in which Al will be deposited at the bottom of the cell and CO2 is released.15 However, this conventional process shows a colossal drawback represented in its second by-process.16–18 The electrolytic process is known to be a massive energy consuming process19,20 To overcome such drawback, the direct carbothermal reduction process represents a substitute route for the production of aluminum from a raw materials mixture of alumina and carbon.21,22 Although the concept of the carbothermal reduction has been around for at least 50 years, it has long been considered impractical due to the high temperature (2000ºC) and complex reactions during the reduction process.23–26 Several research groups obtained aluminum via carbothermal reduction of alumina using different types of furnaces such as the Advanced Reactor Process Furnace (ARP) developed in 2011 by Aloca Norway Carbothermic group, and it includes a diverting system for aluminum gas. The ARP furnace is big enough to produce several tons of aluminum. However, it stills a pilot test and is far away from commercialization.27–29 Other company known as ENEXAL used the carbothermal reduction under vacuum in an enhanced electric arc furnace including a dual condensation zone and modified form of supplied raw materials pellet, however, the process still under experimental research and is far away to see the light as an alternative for electrochemical process.30
Induction heating furnace has been quite a useful energy source for the carbothermal reduction of silica for production of solar-grade silicon in our group.31 Comparing aluminum to silicon, both materials requires a higher production temperature. Therefore, we opted for usage of induction heating as an energy source to reduce alumina to aluminum. Despite that the carbothermal reduction is a one-step process, the reactions occurring during the reduction are quite complicated.32 Although the extensive research concerning the development of an alternative carbothermal process for Hall-Heroult, no promising results have been reached due to several difficulties related to precise understanding of the overall reaction, temperature and heating time during the reduction process. Therefore, the stability phase diagram Al-O-C for the different element existing during the reduction process is essential to understand the behavior and direction of the solid, liquid and gas phases of the reduction materials.33 Aluminum materials are produced around 2100ºC which represents quite a high temperature requiring the consumption of higher electric sources for the necessary heating period.34 The lack of experimental background defining the optimum temperature and heating time represents a significant problem in order to enhance the carbothermal reduction process of alumina.35 In this research paper, the Al-O-C phase diagram was simulated and used for understanding theoretically the overall reaction during the reduction of alumina, and based on the discussed theory; the reduction process heating-temperature was investigated and optimized following the highest amount of alumina recovered in the product in the mean of a higher reduction yield.
1- thermodynamic of Al-O-C phase diagram
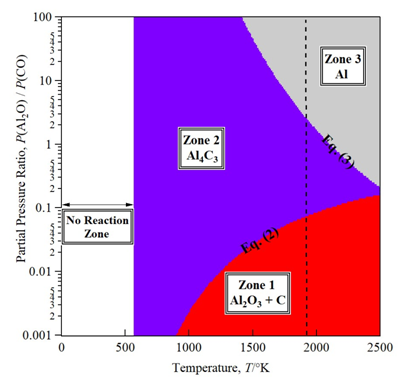
Under the carbothermal reduction process of alumina to produce aluminum, a higher number of overall reactions required to achieve the reduction. In recent years, the usage and enhancement of this process became the object of several studies of research groups. Such as the calculation of the different interaction between the existent sub-products during the reduction process,36 and the investigation of the phase-change occurring during the reduction.37 While other research groups focused on the optimization of the critical parameter such as the ratio of raw materials, reduction atmosphere (Ar, H2, and He) and the heating temperature to improve the process yield.38,39 However, until now, a lack of precise results defining the map for the optimization of the heating-temperature process represents a significant concern for the improvement of the process yield. A simplified route containing three equations chosen as overall reactions to reach the final product are illustrated bellow (1-3). Al-O-C phase diagram was calculated and simulated based on the three reactions above with data taken from MALT2.40 The relationship between the reacted raw materials (Al2O3 and C), the by-products in their solid form Aluminum oxy-carbide (Al4C3) and gaseous forms (Al2O and CO), and the final product (Al). The diagram exhibits the partial pressure ratio of the gaseous forms Al2O/CO in function of the temperature as shown in Figure 1. The standard Gibbs energy of each reaction and its dependency on the required threshold starting temperature, it’s shown above under each reaction in a way to express the importance of the threshold temperature definition thermodynamically via the phase diagram.
As mentioned the phase diagram of Al-O-C in Figure 1, is divided to three zones, Zone (I) where the raw materials including the mixture of Al2O3 and C start to react at a temperature of 1500ºC (1773.5K) to produce Al2O and CO gasses through reaction in equation (1). Moving from Zone (I) to Zone (II), Al2O generation from the zone (I) will increase by an increase of reaction temperature and will react with C in its solid form from Zone (I) to generate Al4C3 in its solid-liquid form and CO gas at 1700ºC (1973K) via reaction in equation (2). When reaching a higher partial pressure ratio between P(Al2O)/P(CO) and sufficient temperature of 1900 ºC (2173K), reaction in equation (3) will start for moving from Zone (II) to Zone (III) which will led to production of Al solid-liquid form via interaction between produced Al4C3 in Zone (II) and remained generating Al2O gas from Zone (I). The phase diagram discussion shows that the control of the produced Al yield depends on the partial pressure ratio (Al2O/CO) and reaction’s temperature. As a partial conclusion of the thermodynamic discussion, the control and optimization of two key parameters can lead to increase of the reduction process yield. In the next experimental part, the optimization of the heating temperature and its impact on the improvement of the final produced Al yield will experiment and the results discussed in details.

Figure 1 Al-O-C Phase diagram for the partial pressure ratio of gaseous species Al2O/CO. This diagram shows the variation of the partial pressure ratio Al2O/CO and temperature impact on the reduction of alumina to aluminum based on calculated data from MALT2.
Experimental setup
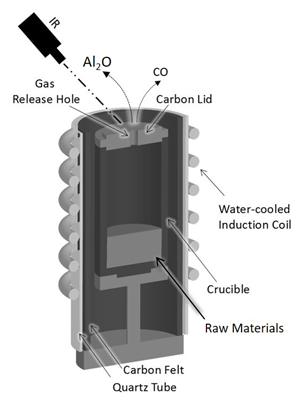
Figure 2 shows an illustration of the heated crucible via the induction furnace; the crucible is made of a high-purity graphite material with an inner diameter of 40 mm and a height of 70 mm. The induction heating furnace generates a power of 30kW (Toei Scientific Industrial CO, Ltd) containing a power supply and a vacuum chamber connected with a quadrupole mass spectrometry (Q-mass) to analyze the gas species generated during the reduction process. Six mixtures of alumina (diameter 20~100 um, Taiheiyo Cement Corporation Japan) and glassy carbon (diameter 20 um, Tokai Carbon Ltd), were prepared with same molar ratio of raw materials (Al2O3:C) = (1:2) and heated with different heating patterns to achieve a heating-temperature comparison between the six samples starting from 1350ºC with sample 1 with a 100ºC increasing step to finally reach sample 6 with l temperature of 1850º as shown in Table 1. The prepared raw material mixtures are shown in Table 2 in which the mass balance of the six experiments is illustrated.The six samples were installed in the graphite crucible, and it was placed at the center of the induction furnace heating coil. While as a protection of the crucible surrounding, it was covered with a thin layer of carbon felt and inserted into a quartz tube as insulation.
Sample number |
(1) |
(2) |
(3) |
(4) |
(5) |
(6) |
Heating-Temperature (ºC) |
1350 |
1450 |
1550 |
1650 |
1750 |
1850 |
Table 1 Experimental design of six heating-temperature profiles corresponding to each experimental sample
|
|
|
|
|
|
|
|
|
|
|
|
|
|
|---|---|---|---|---|---|---|---|---|---|---|---|---|---|
|
(1) |
|
(2) |
|
(3) |
|
(4) |
|
(5) |
|
(6) |
||
(g) |
(Al mol) |
(g) |
(Al mol) |
(g) |
(Al mol) |
(g) |
(Al mol) |
(g) |
(Al mol) |
(g) |
(Al mol) |
||
Al2O3 |
|
5.15 |
0.10 |
5.15 |
0.10 |
5.15 |
0.10 |
5.15 |
0.10 |
5.15 |
0.10 |
5.15 |
0.10 |
C |
|
1.83 |
|
1.83 |
|
1.83 |
|
1.83 |
|
1.83 |
|
1.83 |
|
Total input |
|
6.98 |
0.s10 |
6.98 |
0.10 |
6.98 |
0.10 |
6.98 |
0.10 |
6.98 |
0.10 |
6.98 |
0.10 |
total product |
|
6.69 |
0.10 |
6.51 |
0.10 |
4.6.5 |
0.10 |
0.74 |
0.03 |
1.08 |
0.03 |
0.55 |
0.02 |
|
Al2O3 |
4.75 |
0.09 |
3.35 |
0.07 |
2.61 |
0.05 |
0.00 |
0.00 |
0.00 |
0.00 |
0.00 |
0.00 |
|
C |
1.59 |
|
2.08 |
|
0.13 |
|
0.00 |
|
0.41 |
|
0.00 |
|
|
Al |
0.00 |
0.00 |
0.00 |
0.00 |
0.00 |
0.00 |
0.16 |
0.01 |
0.50 |
0.02 |
0.19 |
0.01 |
|
A14C3 |
0.36 |
0.01 |
1.08 |
0.03 |
1.91 |
0.05 |
0.57 |
0.02 |
0.17 |
0.01 |
0.36 |
0.01 |
Lost gas |
|
0.28 |
0.00 |
0.47 |
0.00 |
2.33 |
0.00 |
6.24 |
0.07 |
5.90 |
0.07 |
6.43 |
0.08 |
|
Al2O |
0.00 |
0.00 |
0.00 |
0.00 |
0.00 |
0.00 |
2.45 |
0.07 |
2.45 |
0.07 |
2.80 |
0.08 |
|
CO |
0.28 |
|
0.47 |
|
2.33 |
|
3.79 |
|
3.45 |
|
3.63 |
|
Total output |
|
6.98 |
0.10 |
6.98 |
0.10 |
6.98 |
0.10 |
6.98 |
0.10 |
6.98 |
0.10 |
6.98 |
0.10 |
Al Yield (%) |
|
|
0.00 |
|
0.00 |
|
0.00 |
|
6.01 |
|
18.35 |
|
6.97 |
Table 2 Mass balance comparison between the six heating-temperatures samples shows that the highest yield of Al obtained in the reduction process corresponding to a heating temperature profile of 1750 ºC and measured at the cap of the crucible with an estimated error of ±200 ºC with inside crucible temperature. In order to facilitate the calculation, other oxy-carbide materials appearing in the XRD analysis were gathered in Al4C3

Figure 2 Schematic figure of the crucible configuration during the reduction process. The crucible was covered with carbon felt and surrounded by a quartz tube as insulation. The crucible temperature measured from the crucible top via an infrared thermometer.
Moreover, as shown in Figure 2, the crucible temperatures were monitored by a high-sensitive single color-type infrared thermometer with a temperature detection range from 651ºC ~ 3500ºC, and it was measured at the top of the crucible (Cap) in each heating experiment. While the vacuum state of the chamber was achieved via a combination of a primary vacuum with a rotary pump and a secondary state vacuum assured with a diffusion pump. We carried out our experiments under argon gas atmosphere which is known to require a higher temperature to achieve the reduction process compare to other reaction atmosphere gasses such as He and . The argon supplied pressure was around 0.07 MPa, and its purpose is to avoid the leakage to outside the vacuum chamber of the lethal to health carbon monoxide gas. A secondary vacuum level of the chamber was achieved as mentioned above, to reach a precise detection of the overall gasses during the reduction process via Q-mass which is essential in this case for the detection of two gasses forms Al2O and CO. While Al2O cannot be detected via Q-mass due to its volatility under a specific temperature, CO can be detected. However, it requires a high vacuum to not override the position of N2 at (m/Z) = 28.
Analysis method
X-ray diffraction technic was chosen to be the analysis method for the obtained reduced product. The x-ray diffraction (XRD) with a Cu-K (λ = 1.5405 ) radiation source over the angular range of 2 2 8 , and a scan rate of 1 /min was employed by an x-ray diffractometer (SmartLab, Rigaku Corporation) to examine the phase composition. The system is equipped with a quadrupole mass spectrometer (Q-mass) to analyze the chamber gas spectrometer, and it can detect only CO gas because of the analysis in this study were performed at room temperature which is an impossible condition to detect Al2O gas phase due to its low stability below 1200 ºC (1473K). The gas phase of Al2O cannot reach the Q-mass analyzer because the Q-mass analyzer and the chamber are connected through a long metallic tube (inner diameter 0.711 mm) with an orifice. Therefore, the ratio of Al2O gas to CO was calculated using the following equations:
.................4
where k is the maximum quadrupole intensity ratio between CO and Ar and picked up from the Q-mass related data.
.............5
Heating-temperature analysis
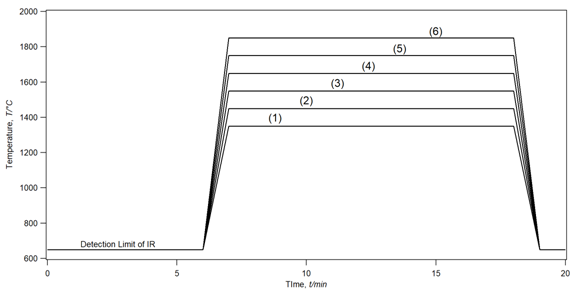
Figure 3 showed the different real-time temperature measured for the six samples during heating and compared to the same heating-time of 20 min. The temperature profile measured was quite stable for each sample and show a clear comparison of the heating-temperature variation. The heating-profile related to each temperature was pre-setup for each experiment before start heating while keeping the time lapse identical for all samples.

Figure 3 The heating temperature profiles recorded for different samples measured at the surface of the crucible cap via an infrared thermometer during the reduction process. The recording starts at 650°C (923K) due to the limit in the detection range of the infrared thermometer from 650°C to 3500°C.
Chamber gas analysis
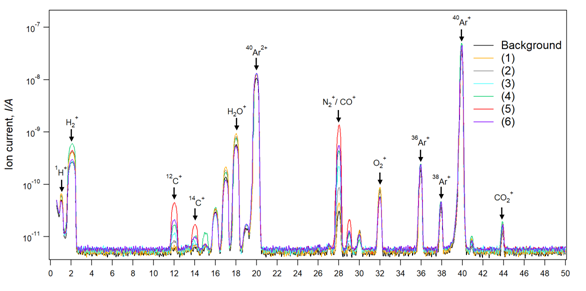
Figure 4 shows a comparison of the Q-mass spectra between the background spectra and the various heating-temperature samples spectra’s. The designated target for Q-mass spectra discussion, in this case, will be the mass peaks (m/Z=28) which correspond to the position of N2/CO gasses. Reaching a lower N2 background is crucial for a precise evaluation of CO gas evolution. N2/CO background is illustrated in Figure 4 with a value of ion current below 3e-11 A. CO mass peak temporal variation represents a sign of occurrence for the reduction reactions. Therefore, the CO mass spectra variation will be used as a comparison factor between the various heating-temperature samples. Sample (1-4) shows a step increasing amount of CO gas by an increase in temperature from (1350ºC to 1650ºC). CO gas generation can be explained by starting of reaction (1) and (2) based on thermodynamic and phase diagram above discussions which show that reaction (1) starts at 1500ºC, however, our measured temperature was at the top of crucible cap, while inside crucible temperature can be estimated by ± 200ºC which is quite sufficient for generation of CO gas from reaction (1). Sample 5 with heating-temperature of 1750ºC exhibits the highest generated amount of CO gas while such amount decreased when heating up to 1850ºC in sample 6. To determine the origin of this difference in CO gas generation which can be translated to reactions occurrence, product analysis will be discussed in mass balance analysis.

Figure 4 Mass spectra of the chamber gases during the heating in case of six heating temperature profile. The amount of CO gas increased with increasing the temperature. However, the highest produced amount was achieved for a heating temperature of 1750 ºC in the sample (5).
Mass balance analysis
Table 2 illustrates the mass balance of the six samples including the amount of the input raw material, the amount of the obtained product which was calculated based on XRD analysis presented in Figure 5, and the weight loss in the form of gas loss in our case. The yield of the produced Al material is defined as the molar ratio of the Al element in the product divided by the molar ratio of Al in the total input raw materials containing Al element. The input raw material consisted of Al2O3 and C with the ratio of (1:2) in all six samples. The analysis of table 2 indicates that in the sample (1-3) there was no production of Al due to the total conversion of the produced Al2O from reaction (1), reacted with carbon to fulfill reaction (2) to generate Al4C3. The lower heating-temperature can explain these results which led to the minimum generation of Al2O and Al4C3 via reactions (1) and (2) and not allowing the occurrence of the reaction (3) to produce Al. Furthermore, reaching a temperature of 1650ºC in sample allowed the generation of higher amount of Al2O which its excess was detected via Q-mass which means left the crucible and Al4C3, in which their interaction led to generation of Al even with a low yield of 6%. Further increase of the heating temperature to 1750 ºC, engender a smooth and total occurrence of the reactions (1-3) which was awarded by obtaining the highest Al yield of 18%. An additional increase of the temperature for sample 6 led to opposite effect of lowering the generation of Al, and it is due to evaporation of Al2O due to a higher temperature which means that 1750ºC represents the optimum heating temperature for obtaining a higher Al yield of the carbothermal reduction of alumina. Moreover, these results is backed up by the real images of the obtained product in the case of each sample as shown in Figure 6, in which sample (1) and (2) shows a light grey color due to remain of higher amount of unreacted Al2O3 compared to sample (3) and (4) that shows a darker grey color due to remain of unreacted carbon in the product and due to generation of sufficient amount of Al4C3 and Al in sample (4). While Al was generated with higher amount in the sample (5) which shows a metallic color corresponding to Al material presence. Sample (6) shows a darker grey color mainly due to uncreated carbon and generation of a higher amount of Al4C3 which couldn’t react to produce Al.
The thermodynamic understanding of the overall reaction in the carbothermal reduction of alumina represented quite a useful technic to calculate the phase diagram of Al-O-C to determine the optimum heating temperature for obtaining a higher yield of Al theoretically. The estimation of the by-products generated during the reduction process such as Al2O, CO, and Al4C3 is essential for the optimization and enhancement of the reduction process. The optimum heating temperature for a higher obtained yield of Al (18%) was determined to be around 1750ºC in an argon atmosphere.
This research was supported by JST-JICA, SATREPS. A.Chahtou, gratefully acknowledge the scholarship from Ministry of Education, Culture, Sport, Science, and Technology (MEXT) of Japan.
Authors declare that there is no conflict of interest.

©2018 Chahtou, et al. This is an open access article distributed under the terms of the, which permits unrestricted use, distribution, and build upon your work non-commercially.