eISSN: 2473-0815


Research Article Volume 10 Issue 2
Professor, Colleges of Medicine and Graduate Studies, University of Science Arts and Technology, Montserrat, British West Indies, USA
Correspondence: Orien L Tulp, Professor, Colleges of Medicine and Graduate Studies, University of Science Arts and Technology, Montserrat, British West Indies, USA
Received: November 15, 2022 | Published: November 23, 2022
Citation: Tulp OL. Effect of phenotype on thyroidal parameters and metabolic sequelae in Wistar fatty rats. Endocrinol Metab Int J. 2022;10(2):58-64 DOI: 10.15406/emij.2022.10.00320
To determine the effects of phenotype on parameters of peripheral thyroid hormone and actions, groups of adult male lean (LN) and obese (OB) Wistar Fatty Rats were fed a nutritionally adequate semisynthetic diet containing 54% carbohydrate, 16% mixed fats, 20% protein plus essential vitamins, minerals, and cellulose fiber for 8 weeks. Measures of weight gain (WG), feed efficiency ratio (FER), Resting (RMR) and norepinephrine (NE) stimulated VO2, serum triiodothyronine (T3), and in vitro T4-5’ deiodinase (5’DI) activity in liver (LVR), kidney (KID), gastrocnemius muscle (GNM) and interscapular brown adipose tissue (IBAT) were determined at baseline and after dithiothreitol (DTT) stimulation to optimize in vitro deiodination activity. The WG and FER of OB >> LN phenotype and FER increased over time in both phenotypes, with the greatest increase in the OB phenotype. The RMR of LN > OB, and NE-stimulation (200 µg/kg BW, sc) increased VO2 by 180% in LN but only ~30% in OB phenotype. Serum T3 of LN >> OB. Baseline 5’DI of OB > LN in LIV and KID and were of similar magnitude in both phenotypes in GNM and IBAT. After DTT stimulation, LIV increased ~200% in LN, ~30% in OB; In LN rats, KID +DTT increased ~200%, but only modest increases in OB phenotype, while in LN GNM, DTT resulted in 264% increase vs. +70% in OB rats. In IBAT, DTT resulted in ~ 30-fold increase in 5’DI in LN, and a 16-fold increase in 5’DI in the OB phenotype. These results indicate that parameters of thyroidal actions including circulating plasma levels of T3 and maximum capacity to generate T3 in peripheral tissues via 5’DI, although increased in the OB phenotype, were associated with decreases in RMR and NE-stimulated VO2. These observations occurred in association with an improved efficiency of FER and weight gain and dysregulation of intracellular T3 actions including parameters of T3 receptor affinity kinetics are likely to be among key contributors to the epigenetic expression of the OB+NIDDM phenotype in this strain and are consistent with a reduced affinity of T3-mediated cellular components of intermediary metabolism.
Keywords: obesity, wistar fatty rat, VO2, triiodothyronine (T3), T4-5’ deiodinase, thermogenesis, insulin resistance
A cardinal observation among the obese phenotypes of most if not all obese rodent strains is a decreased resting metabolic rate, often in association with multiple endocrinopathies including impaired thermogenic responses to diet, environment, and to exogenous norepinephrine administration.1–6 The Wistar Fatty Rat shares a similar genetic trait for obesity (-fa or -f) to that of the Zucker Fatty Rat, the Corpulent rat and others, reported to be linked to an epigenetic locus on chromosome 5 in the Koletsky rat, where the obesogenic trait was derived from the LA/N-cp (Corpulent) rat in the recent studies. The LA/N-cp strain was developed by Hansen at the NIH from the original Koletsky breeding stock.7–10 The Wistar Fatty Rat differs from other strains in that the lean background Wistar stain adopted by Ikeda et al11,12 was noted to develop glucose intolerance, and when cross bred with the 13M strain of Zucker rats containing the fatty trait (-fa) resulted in the development of an obese phenotype that was highly predisposed to develop obesity plus non-insulin dependent diabetes (NIDDM) by early adulthood.13 This is in contrast to the LA/N-cp strain, which develops insulin resistance but does not progress to NIDDM under typical laboratory conditions.2 The mechanism for expression of the obesity trait in the Wistar Fatty Rat is likely multifactorial involving thyroidal, sympathetic and other metabolic elements including hyperinsulinemia and hyperamylinemia, and the obese phenotype expresses characteristics of thermogenesis and enhanced efficiency of weight gain that are similar to that observed in other obese strains.1–6,14–16
The burgeoning incidence of obesity is approaching epidemic proportions in Western society, along with hypertension and non-insulin dependent diabetes (T2DM or NIDDM).17–19 Primary factors for the increased prevalence are changes in dietary preferences, nutrient composition, lifestyle, and environmental factors. The total caloric intake combined with physical inactivity of individuals, in addition to poor dietary selections often containing inappropriate proportions of dietary fats and sugars while appetizing, may alter metabolic pathways toward fat accretion when consumed in excess and exacerbate the progression of pathophysiologic symptoms of NIDDM, hypertension and cardiovascular disorders.17–19 The burden of obesity and its sequelae have placed significant strain on health care resources globally as once the disorders are diagnosed, they typically result in continued treatment throughout the remainder of a patient’s life.18–20
The role of thyroid hormones in human obesity remains controversial, as plasma hormone concentrations of both T4 and T3 in their protein-bound and free forms, and TSH are typically found to be within or close to clinically normal ranges, thereby suggestive of other non-thyroidal contributions to the obese syndrome.21 The disconnect occurs, however as plasma levels of a hormone such as thyroid hormones may not always accurately reflect intracellular events, where the cellular metabolic activity occurs. This is especially true for thyroid hormones, in that their actions are mediated following nuclear receptor affinity and occupancy, followed by epigenetic expression of metabolic sequelae.22–23 Thus, any failure of adequate cellular uptake, intracellular conversion to an active vs an inactive form, and nuclear receptor occupancy of an active form of the hormone all may contribute to alterations in thyroidally mediated genetic expression and its consequences on cellular metabolism/metabolic rates. The intracellular metabolism and actions of thyroid hormones in the obese phenotype of susceptible rodent models remains unclear, and in need of further exploration. Both insulin and glucocorticoid hormones contribute to substrate utilization and metabolic efficiency and exert influences on thyroidal actions in peripheral tissues including syndrome X in humans.24 In rodent studies, adrenalectomy of obese animals was found to reduce the magnitude of insulin resistance and subsequent adiposity and improve parameters of non-shivering thermogenesis toward those of similarly fed lean littermates.25 In studies of adrenalectomized obese corpulent rats, both the magnitude of insulin resistance and of progressive adiposity decreased in the obese phenotype following adrenalectomy.25 These results are consistent with adrenocorticoid-mediated insulin resistance likely due to a receptor level defect in insulin sensitivity via impaired intracellular translocation of GLUT-4 particles as a contributory factor in the impairment in oral glucose tolerance (OGT) and nonshivering thermogenesis (NST) in the obese phenotype of this strain.26,27
While the free form of both T4 and T3 (fT4, fT3) may undergo uptake in peripheral tissues, it is generally regarded that T4 is converted to T3, and T3 represents the physiologically active form of the hormone. Most of the intracellular T3 is generated via activity of T4-5’deiodinase in peripheral tissues in close proximity to its nuclear receptors, and only lesser quantities of T3 are released directly from thyroid tissue. Thus, it is of interest to examine the characteristics of T4 deiodination in selected peripheral tissues including liver, renal, skeletal muscle, and brown adipose tissue, all of which express T4 5’ deiodinase (5’DI) activity and which may contribute to circulating hormone levels.23 Plasma T3 concentrations and expression of parameters of nonshivering thermogenesis have been found to be lower in the obese phenotype of the LA/Ntul//-cp (Corpulent) rat throughout much of its lifespan,28,29and which strain shares the same or similar genetic locus for the expression of the obese trait as the Wistar Fatty Rats of the current investigation.7,8
A contributory role of insulin resistance in thyroid hormone activation had been noted by Kahn and others, who noted that peripheral deiodinase activity was decreased in tissues from NIDDM subjects.27–31 Coincidentally, all of the obese rodent studies where plasma T3 concentrations were found to be lower than those of their non-obese littermates also demonstrated hyperinsulinemia and varying magnitudes of insulin resistance.1–6,15,28In a study of obese nondiabetic LA/Ntul//-cp (corpulent) rats, Young discovered that liver T3 receptor density and occupancy were similar in both lean and obese phenotypes, but receptor affinity for T3 was decreased in the livers obtained from the obese phenotype.31 Paz Nava et al. observed that T4 disappearance rats were prolonged in the obese and obese+NIDDM corpulent rats, while T3 disappearance rates were similar in lean and obese phenotypes.21–23 The role of hyperinsulinemia on thyroidal kinetics on aspects of cellular energy metabolism also contribute to the decreased capacity for thermogenesis in obese rodents, as Bukowiecki et al and others have noted that isolated brown adipocytes from insulin resistant, obese+NIDDM SHR/Ntul//-cp rats were resistant to the β3-adrenergic thermogenic effects of norepinephrine32–34 and Tulp reported that the rate of protein synthesis and net turnover, major contributors to the metabolic rate, were significantly decreased in the obese LA/Ntul//-cp rat.2 Considering the protein synthesis theoretically consumes 4 high energy phosphate bonds per peptide bond formed, any decreases in protein synthesis could exert a major impact on the magnitude of energy expenditure, and the hyperinsulinemia could thereby bring about an overall conservation in energy expenditure. The insulinogenic effects of conserving protein degradation and protein turnover rates are recognized for many years.2 When obese Corpulent and Zucker rats were reared on protein deficient diets containing only 8% protein by weight, growth of the lean phenotype was markedly stunted, while linear and lean tissue growth in the obese phenotypes of these strains in spite of the lower plasma T3 concentrations. Thus it is of interest to determine the effects of phenotype on parameters of thyroid hormone generation and actions in the Wistar fatty Rat.
Groups of adult male lean and obese Wistar Fatty Rats (n= 8 rats/group) were obtained from the Diabetes Research Training Core Laboratories (DRTC), University of Indiana at 20 weeks of age, and placed in hanging steel cages by littermate pairs (1 lean +1 obese) with initial free access to Purina Chow #5012 for two weeks and house water during their adjustment period to decrease the potential effects of travel and related stressors on experimental outcomes. During the first week, environmental conditions were adjusted to a reverse light cycle (dark 0800-2000 hours) maintained at 20±1°C and 50% relative humidity thereafter. At 22 weeks age the diet was switched to a semisynthetic diet recommended by OE Michaelis et al of the USDA Carbohydrate Nutrition Research Laboratory, Beltsville, Maryland, USA.35 The USDA compounded Michaelis diet consisted of (w/w) 54% CHO as cooked cornstarch (ST), 16% mixed fats as equal parts lard, beef tallow, corn oil and coconut oil, 20% protein as equal parts casein and lactalbumin, 4% essential vitamins and minerals, and 5% cellulose, and were fed from 22 to 30 weeks of age. Body weights of rats and the amount of food consumed per day were weighed weekly to the nearest gram on an Ohaus animal balance as outlined by Vedula et al.36 At 30 weeks of age rats were sacrificed by decapitation, truncal bloods collected for determination of fasting levels of serum glucose, insulin. Glucose was measured via a glucose oxidase method and insulin and T3 via solid phase radioimmunoassay.37,38,2-6
Measures of resting and norepinephrine stimulated oxygen consumption were determined individually in fasting animals in a small animal metabolic apparatus as outlined previously.2-6 All VO2 measurements were obtained in quietly resting animals at thermal neutrality (30C) and expressed as ml. of VO2/minute0.75 as described by Kleiber and Wang et al to correct for differences in body surface area between lean and obese rats.39,40 The β3-agonist norepinephrine (NE, 200 µg/kg BW) was administered subcutaneously in an optimal thermogenic dosage in the interscapular region immediately following the resting VO2 determinations and the peak thermogenic responses taken 15-30 minutes post injection recorded.2-6
The tissue activity of T4-5’ deiodinase was determined ad outlined by Tulp and McKee.41,42 Weighed tissues (Liver, Kidney, Gastrocnemius muscle, and Interscapular brown adipose tissue) were homogenized individually with a polytron homogenizer in a phosphate buffer at pH 7.40, and 100 µl aliquots incubated with 1 µg of T4 substrate, ±10 mM of dithiothreitol (DTT) maintained at pH 7.40 for 30 minutes in a shaking water bath at 37°C. Incubations were terminated via addition of 2 ml. of cold (4°C) 95% ethanol, and aliquots assayed for T3 content via a solid phase radioimmunoassay procedure (ICN Biochemicals). Tissue protein content of the homogenates was determined vi the Lowry procedure43 as outlined above.42,43 Data were analyzed via standard statistical procedures including ANOVA and Student’s ‘T’ test. The Institutional Animal Care and Use Committee approved this study.
Body weights and net weight gain of rats are depicted in Figure 1 and indicate the obese rats weighed more and gained more weight throughout the study than their lean littermates. Measures of food intake, in grams diet consumed / day of obese were greater than in lean rats, and the feed efficiency ratio (FER) taken at 4 and 8 weeks into the study indicate that the FER of obese rats was greater than in lean rats at both ages studied and increased with advancing age, resulting in greater net weight gains in the obese than in the lean phenotype.(Figs 2 and 3) Measures of resting and norepinephrine stimulated oxygen consumption are depicted in Figure 4 and indicate that the resting VO2 of lean rats was approximately 30% greater than in obese rats, and that the norepinephrine stimulation of thermogenesis resulted in an approximate 80% increase in the lean phenotype, but only a 33% increase in the obese phenotype.
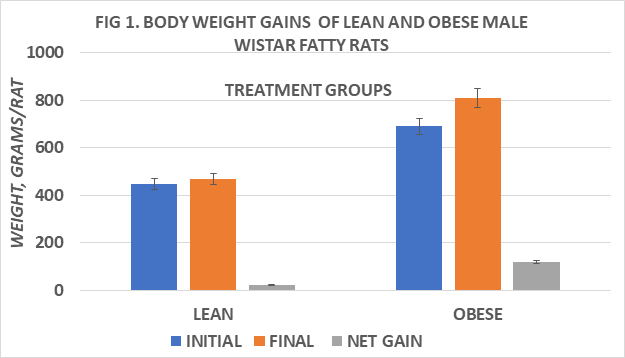
Figure 1 Body weight gain of lean and obese Wistar Fatty Rats. N=10-11 rats/phenotype. P=< 0.05 for phenotype body weights and weight gain.
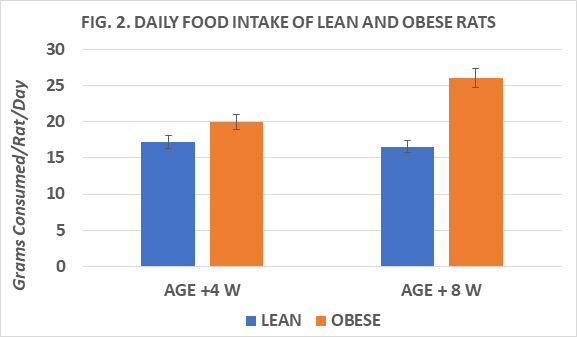
Figure 2 Daily food intake of lean and obese Wistar Fatty Rats. N=10-11 rats/phenotype. P=< 0.05 for phenotype body weights and weignt gain. Obese > Lean at +8 weeks (p=<0.05).
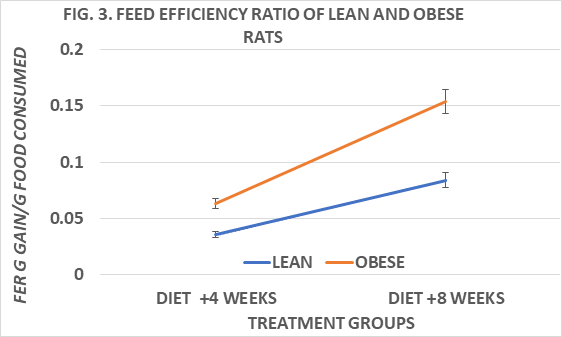
Figure 3 Feed efficiency ratios of lean and obese Wistar Fatty Rats. N=10-11 rats/phenotype. P=< 0.05 for phenotype at both 4 and 8 weeks of diet.
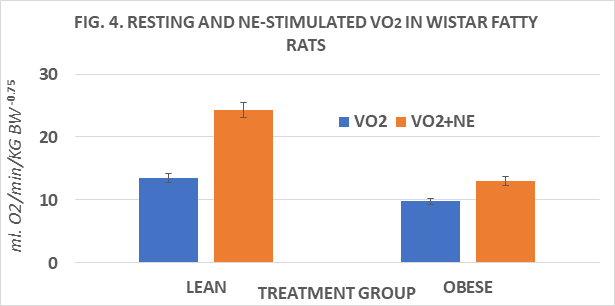
Figure 4 Resting and norepinephrine stimulated VO2 of lean and obese Wistar Fatty Rats. N=8 rats/phenotype P=< 0.05 for phenotype and for RMR vs +NE.
Measures of plasma T3 and of T3 generation from T4 in several tissues in vitro are depicted in Figures 5 to 9. Measures of plasma T3 concentrations of lean rats were greater than occurred in their obese littermates. In an attempt to gain insight into the mechanism of decreased plasma T3 in the obese phenotype, measures of baseline and DTT-stimulated T3 generation in the key peripheral tissues of liver, kidney, skeletal (gastrocnemius) muscle, and interscapular brown adipose tissue (IBAT) determined, and expressed per mg of tissue protein per hour. Serum T3 concentrations after 8 weeks of dietary study were greater in lean than in obese littermates when rats were at 30 weeks of age (Fig 5). The rate of baseline T3 generation in liver homogenates was greater in the obese than the lean phenotype and increased by ~2.4-fold in lean rats and ~1.8-fold in obese rats following DTT stimulation (Figure 6). In renal tissue, the baseline T3 generation of obese rats was also ~ 2-fold greater than in lean littermates at baseline and increased nearly 2-fold in lean rats but increased only 1.35-fold in obese rats following DTT addition (Figure 7). In gastrocnemius skeletal muscle, the baseline rates of T3 generation were similar in both phenotypes, and both increased ~ 2-fols following DTT stimulation (Figure 8). The rate of T3 generation averaged 15-fold increase in IBAT of obese rats with DTT stimulation, marking the highest recorded in his study, compared to only an average 2-fold increase in the rate of IBAT T3 generation in lean rats. (Figure 9). The highest overall rates of T3 generation were observed in homogenates from the obese rats. In obese rats, the baseline IBAT T3 generation was nearly 30-fold greater than was measured in IBAT homogenates from lean littermates and increased by an additional 17% with DTT stimulation. Thus overall, rates of baseline and DTT stimulated T3 generation in the four tissues studies were greater in the obese phenotype, despite having a plasma T3 concentration that averaged only 68% of that observed in the lean phenotype (Obese = 0.67 vs. Lean = 0.98 ng/ml). It is therefore apparent that the obese phenotype enjoys a disordered thyroidal regulation, and which may be a significant contributor to the improved metabolic economy of energy efficiency, a decreased basal and NE stimulated VO2, and to the expression and maintenance of the obese state in this strain.
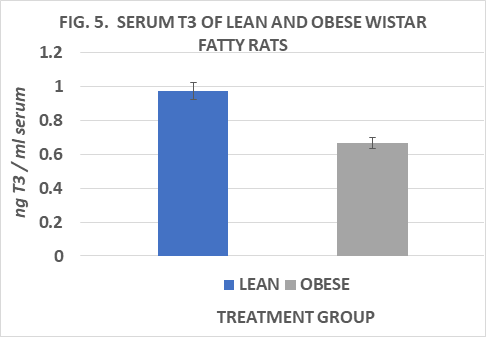
Figure 5 Serum T3 of lean and obese Wistar Fatty Rats. N=10-11 rats/phenotype. P=< 0.05 for phenotype.
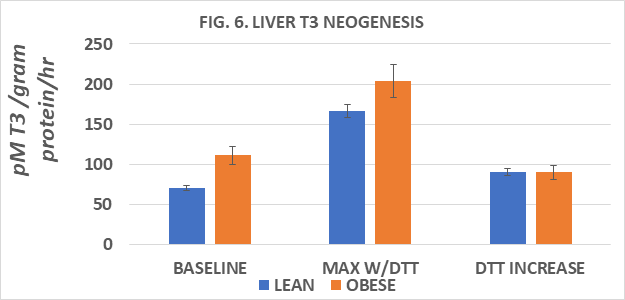
Figure 6 Liver T3 neogenesis of lean and obese Wistar Fatty Rats. N=6-8 rats/phenotype. P=< 0.05 for phenotype and DTT stimulation.
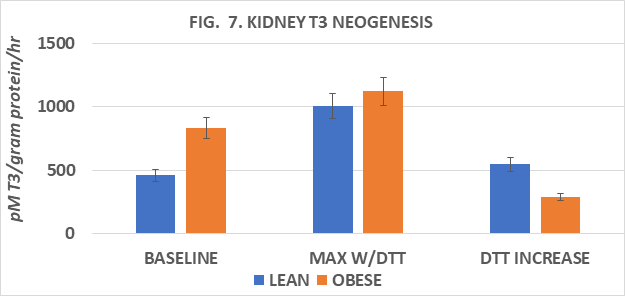
Figure 7 Kidney T3 neogenesis of lean and obese Wistar Fatty Rats. N=6-8 rats/phenotype. P=< 0.05 for phenotype and DTT stimulation in lean but not obese phenotype.
The results of this study confirm that multiple parameters of energy metabolism are decreased in the obese phenotype of the Wistar Fatty Rat and along with insulin resistance, are likely contributors to the expression and development of the obese state. Measures of the efficiency of weight gain and of resting and norepinephrine stimulated thermogenesis were similar to the magnitude of decreased thermogenesis and improved efficiency of weight gain in the obese phenotype of other obese rodent strains.1-6,45,46 In other studies, the obese phenotype of this strain exhibited impaired glycemic responses, in concert with significant insulin resistance when fed similar high glycemic index diets, which also likely play a contributory role in the expression of the obese stigmata.2 In other strains, the decreased magnitude of resting metabolic activities were associated with decreases in the rates of protein synthesis and turnover, one of the most energetically expensive cellular processes of many mammalian tissues.2
The hyperinsulinemia of NIDDM has been implicated in the peripheral activation of T4 via decreased generation of T3 and is likely to be one of several factors implicated in the decreased plasma T3 concentrations of the present study.48,49 Considering that the overall mechanism of T4 deiodination to T3 occurred similarly in both phenotypes. the expression of the deiodination enzyme is not the major flaw in the thyroidal mediated mechanisms as it demonstrated a level of activity that was observed to be equal to or greater than was observed in the lean phenotype in vitro. It could not be determined if the activity of the deiodinase enzyme may have performed similarly in both lean and obese phenotypes if measured in vivo, suggesting other relevant facets of its activity may be of importance and may include nuclear receptor actions. Additional factors of hormone kinetics, including T3 clearance, and T3 receptor affinity and binding kinetics may also be involved for the lower plasma T3 concentrations measured. It is tempting to speculate that a reduced nuclear receptor affinity for T3 could stimulate a compensatory feed forward regulation of the deiodinase activity, resulting in greater T3 generation in a physiologic attempt to overcome the reduced receptor affinity. The nuclear thyroid hormone binding sites are genetically determined, and their prevalence is not likely to be different in lean and obese littermates of the same breeding population in the absence of a specific error in DNA replication in early life.51
The lower serum T3 concentrations observed in the obese phenotype are physiologically consistent with the decreased capacity of basal and norepinephrine-stimulated nonshivering thermogenesis observed. Young demonstrated that hepatic tissues excised from the obese phenotype of the LA/Ntul//-cp rat which shares a similar trait for obesity as in the present study had a normal number of nuclear T3 binding sites, but that the T3 receptor affinity was decreased when compared to their lean littermates.31 It remains unknown of the T3 receptor binding sites of other tissues may have been similarly affected or if they were influenced by the concurrent magnitude of insulin resistance in those animals. The obese phenotype of the Wistar Fatty Rat develops significant insulin resistance, which alone or in concert with other factors have been shown to impede noradrenaline stimulated thermogenesis in vitro.48,49 In studies of adrenalectomized corpulent rats, insulin resistance was diminished within a few days, and the thermogenic responses completely returned to normal within a few weeks of the adrenal surgery49 In addition, the pharmacologic blockade of sympathetic activity in cafeteria overfed lean rats was found to deplete only about 50 % of the dietary-induced increases in nonshivering thermogenesis, suggesting that the thermic effects of thyroidal activity were associated with the remaining portion of the thermogenic response. (ref) Approximately 45 % of resting metabolic rate has been attributed to actions mediated by thyroid hormones (ref) as the Na-K ATPase cycle as well as the T3-regulated activity of hepatic cytoplasmic α-glycerophosphate dehydrogenase, and energy wasting process of glucose oxidation.50 Thus multiple aspects of intermediary metabolism can be correlated with the activity of thyroid hormones or lack therof.32 Thus, the hyperinsulinemia and the decreased plasma concentrations of T3, the most active of the thyroid hormones, are likely linked to the reduced resting and NE-stimulated metabolism in the present study.
The hormone insulin exerts numerous actions in peripheral tissues, including the facilitation of cellular glucose uptake via selected plasma membrane associated GLUT4 glucose transporters, which are dependent on the hormone including those transporters located in skeletal muscle and adipose tissue and the suppression of the protein degradation phase of protein turnover in those tissues, which extends the normal half-life of tissue proteins.2. As a consequence of these actions on elements of energy balance, uptake of glucose in insulin-dependent peripheral tissues can become compromised, resulting in a transition in cellular energy utilization toward non-glucose substrates including fatty acids. The shift toward oxidation of fatty acids as a back-up substrate enables the tissues the advantage of the greater metabolizable energy contained in lipids at 9 kcal/gram over non-lipid substrates at 4 kcal/g or less, and thus contributes to a greater efficiency of metabolism. Dietary lipids can be deposited in adipose storage depots with a minimum of energy expenditure, while the conversion of non-lipid substrates remains much more energy expensive. (ref) In addition, as a consequence of decreases in the rate and activity of protein turnover, the energy required for new peptide bond formation during de novo protein synthesis becomes decreased as well, thereby conserving 4 high energy phosphate bonds from ATP for each peptide bone that is conserved during the process.2 The specific roles of the different adipose tissue depots in concert with the magnitude of insulin resistance also contribute to the expression of the obesity related sequelae.51,52 The net result may contribute to the decreased resting and NE-stimulated metabolism observed in the present study. Regardless of the various contributors to overall energy metabolism that were likely acting in concert in the current study, the net result was the predictable epigenetic expression of obesity51 and NIDDM in the obese phenotype of the male Wistar Fatty Rat.
The effects of phenotype on parameters of thyroid hormone parameters, including resting and catecholamine stimulated thermogenesis, feed efficiency ratios, plasma T3 concentrations and T4-5’ deiodinase activity in selected peripheral tissues known to express the deiodinase activity were determined in male lean and obese Fatty Wistar Rat littermates. Measures of resting and of norepinephrine stimulated thermogenesis were significantly decreased in the obese phenotype, as were plasma concentrations of T3, the most metabolically active form of the thyroid hormones. Rates of baseline and DTT-stimulated T4-5’ deiodinase activity was generally similar in both phenotypes, although the enzymatic rates when expressed per mg of protein tended to be greater in the obese phenotype. The greatest activity of the T4-5’ deiodinase was observed in the interscapular brown fat deposits of both phenotypes, a major thermogenic tissue of mammalian species. The serum T3 reflects a combination of hormone generated in both thyroidal and extrathyroidal tissues, and the robust capacity of the interscapular brown fat in concert with other tissues to generate T3 suggests that the BAT and other tissues may be significant sources of T3 both in resting and in thermally stimulated environments. In other studies, the IBAT depots of the obese Wistar Fatty Rat were found to have a 5 to 8-fold greater mass than those of their lean littermates, but despite the abundance of brown fat in the obese phenotype, resting and adrenergic-stimulated VO2 were lower, thus consistent with an impairment in the thermogenic responses of brown fat in the obese, insulin resistant state common to the NIDDM stigmata. Regardless of the physiologic mechanism which resulted in the low T3 activities, these results indicate that parameters of thyroidal actions including circulating plasma levels of T3 and maximum capacity to generate T3 in peripheral tissues via 5’DI, although increased in the OB phenotype, were associated with decreases in RMR and NE-stimulated VO2. These observations occurred in association with an improved efficiency of FER and weight gain and are likely to be among key contributors to the epigenetic expression of the Obese+NIDDM phenotype in this strain and are consistent with an improved economy of energy expenditure and a reduced affinity of T3-mediated cellular components of intermediary metabolism.53,54
The author thanks Ms. Carole Stevens for assistance in data collection, and Mr. Huang Peisong for assistance in animal husbandry.
Author declares there are no conflicts of interests.

©2022 Tulp. This is an open access article distributed under the terms of the, which permits unrestricted use, distribution, and build upon your work non-commercially.