eISSN: 2473-0815


Research Article Volume 9 Issue 1
Santa Casa de Belo Horizonte Hospital - Ensino e Pesquisa (SCBH-EP), Brazil
Correspondence: Jose Augusto Nogueira-Machado, Núcleo de Pós-Graduação e Pesquisa, Hospital Santa Casa de Belo Horizonte, Rua Domingos Vieira 590, Santa Efigênia, 30150-240, Belo Horizonte, MG, Brazil
Received: February 18, 2021 | Published: March 3, 2021
Citation: Ferreira GR,Volpe CMO,Villar-Delfino PH, et al. Diabetes potentiates ROS production in granulocytes from patients with chronic kidney disease. Endocrinol Metab Int J. 2021;9(1):9-14 DOI: 10.15406/emij.2021.09.00301
Background: Type 2 diabetes (DM2) and chronic kidney disease (CKD) are inflammatory pathologies. Diabetes is characterized by hyperglycemia and CKD by the gradual and irreversible loss of kidney function. Both diseases develop oxidative stress, and reactive oxygen species (ROS) play a pivotal role in the pathogenesis. This study aimed to determine ROS production by granulocytes from renal patients (CKD) with or without diabetes.
Methods: Granulocytes from patients with DM2, CKD, CKD-DM2, and healthy controls were purified using the Ficoll-Hypaque gradient method. Granulocyte ROS generation in the absence or the presence of PDB (an activator of NADPH-oxidase) or Concanavalin A (Toll- receptor 3,9 activator) was evaluated in a luminol-dependent chemiluminescence method. The cell-free DNA in the serum of DM2, CKD, and CKD-DM2 patients was measured by the fluorescence method before and after hemodialysis.
Results: Our results show a significant increase in ROS production by granulocytes from patients with CKD, DM2, and CKD-DM2 compared to healthy control (p<0.05). CKD-DM2 group produced the most significant ROS levels with or without NADPH-oxidase activation. ROS production showed a significant increase in the presence of ConA. In contrast, mitochondrial (internal) ROS showed a different ROS response. DNA extrusion was higher in the CKD-DM2 group after hemodialysis suggesting cell death.
Conclusion: The results demonstrated that CKD-DM2 patients produced high ROS generation levels and increased DNA extrusion after hemodialysis. It may suggest that CKD-DM2 disease is more severe and has a worse clinical prognosis.
Keywords: type 2 diabetes mellitus, chronic kidney disease, innate immunity, reactive oxygen species, toll-like 9 receptor
AGE, advanced glycation end product; AKD, acute kidney disease; cfDNA, cell-free DNA; CKD, chronic kidney disease; ConA, concanavalin A; DAG, diacylglycerol; DAMP, damage‐associated molecular pattern molecules; DCFH-DA, Dichlorofluorescein; DM2, Type 2 diabetes mellitus; dsDNA, double stranded DNA; IL, interleukin; PAMP, pathogen-associated molecular pattern molecules; PBS, phosphate buffered saline; PDB, phorbol ester; PKC, protein kinase C; RLU, relative light units; RNS, reactive nitrogen species; ROS, reactive oxygen species; TLR, toll-like receptors; TNF-α, tumor necrosis fator alpha
The inflammatory process and oxidative stress are present in several pathologies, such as sepsis, arthritis, cancer, diabetes, and kidney diseases. Diabetes is a disease with systemic vascular effects. In contrast, chronic kidney disease (CKD) can have several causes and has the kidney as a target leading to nephron dysfunction, reducing glomerular filtration, and compromising all renal functions promoting the body's intoxication.1–3 The progression of both diabetes and CKD disease is associated with several signaling pathways and activation of Toll-like receptors (TLR), leading to an increase of ROS production.4–7 Hyperglycemia of diabetes leads to chronic low-grade inflammation, stress in the endoplasmic reticulum (ER), apoptosis of cardiomyocytes, and beta cells' apoptosis involving increases ROS production.1,2 The rise of ROS depends on NOX2 and 4 subunits of NADPH-oxidase activation.1,2 Both diabetic and non-diabetic nephropathies are inflammatory-based pathologies involving cellular activation by DAMP and PAMPs and producing pro-inflammatory cytokines and oxidative stress.8,9 Studies suggest that ROS affects podocytes, inducing apoptosis during CKD associated with type 2 diabetes mellitus (DM2).10 It is known that the activation of TLR2, TLR4 and TLR9 increase cytokine production and acting as biomarkers in the progression of kidney disease.11–13 A similar immunologic response has been seen in diabetic complications.11,14–16 It is well-known that granulocytes are the first cells to reach the inflammatory site, producing high ROS generation levels. The granulocyte metabolic status has been suggested as a possible biomarker for evaluating the intensity and severity of inflammation.17,18 The present manuscript aimed to study ROS generation's profile by granulocytes from patients with DM2, CKD, and CKD-DM2, comparatively. The role of hemodialysis treatment is discussed.
Study population
The Ethical Committee from Santa Casa Hospital of Belo Horizonte–Brazil approved this study, and the informed consent was obtained from all participants included in the study. Patients were recruited from the Nephrology service/Hemodialysis Center of Santa Casa Hospital (Belo Horizonte, Minas Gerais, Brazil). Volunteers (n=285) aged 40-70years, female or male, diagnosed with type 2 diabetes under hemodialysis (CKD-DM2, n=81)), non-diabetic under hemodialysis (CKD, n=80), type 2 diabetic without kidney disease (DM2, n=58) and healthy control (control group, normoglycemic subjects without diagnosed diabetes and kidney disease, n=66) were selected. Subjects suffering from autoimmune diseases, cancer, dementia, clinically diagnosable inflammatory process, pregnant women, and smokers were excluded.
Cell separation
Granulocytes were obtained according to Bicalho et al.,19 by using Ficoll-Hypaque density gradient method, with some modifications. Briefly, blood samples (10 mL) were subjected to double-gradient density (1.08 and 1.12) centrifugation, and the middle interface was collected to yield fraction rich granulocytes. Cell viability was determined in each of the samples using the Trypan Blue dye exclusion test and was established at >90% in all cases.
Quantification of reactive oxygen species (ROS) production
A luminol-based chemiluminescence method was employed to assess the oxidative responses of granulocytes. An aliquot (200μL) of luminol (10-4M) was mixed with a 100μL of granulocytes suspension (1×10⁶/mL) in phosphate-buffered saline (PBS). The chemiluminescence assay was performed on the Turner BioSystems model 20/20n luminometer (Promega, Sunnyvale, CA, USA) for 30min (control without stimulation), following which the PKC activator PBD (Phorbol 12,13-dibutyrate -1x10⁻⁴M, Sigma Aldrich, Germany or TLR9 activator Concanavalin A (ConA-10μg/mL, Sigma Aldrich, Germany) was added to the reaction mixture and chemiluminescence measured for further 30 minutes.
Intracellular ROS was measured by fluorescence assay using dichlorofluorescein diacetate (DCFH-DA) (Sigma Aldrich, Germany) as a probe, as proposed by Keller et al.20 In each assay, 100μM of DCFH-DA was added to granulocytes suspension (5×10⁵ cells) in saline, and the reaction mixture was incubated for 1 hour at 37˚C. Then, the cells were washed with saline, and the fluorescence intensity was recorded with excitation and emission wavelength at 485 and 530nm, respectively, in a Spectrofluorometer (Victor X3 Multilabel Plate Readers, PerkinElmer, Boston, MA, USA).
Cell-free DNA (cfDNA) in serum
The peripheral venous blood sample was collected in Vacutainer® tubes before and after hemodialysis. The serum was obtained through centrifugation (200g for 15min, at room temperature). The amount of total cf-DNA was determined directly in serum without any purification step, using the Quant-iT™ high-sensitivity DNA assay kit and a Qubit® fluorometer (Invitrogen, Carlsbad, CA, USA) following the manufacturer's instructions.
Statistical analysis
The Shapiro-Wilk test was used to evaluate sample normality. Comparisons between groups were performed using unpaired Student's “t” test, Mann-Whitney test, chi-square (X2) test, One-Way ANOVA test, and Dunnet’s post-test. All analyses were considered significant at values <0.05.
Clinical and biochemical parameters of the studied population appear in Table 1. Creatinine from control group is similar to that observed for the DM2 group (p>0.05) but differs from those studied for CKD and CKD-DM2 groups (p<0.05). Creatinine of patients with CKD-DM2 individuals was higher than CKD and DM2 groups, separately (p<0.05).
|
Parameters |
Control |
DM2 |
CKD |
CKD-DM2 |
|
N |
66 |
58 |
80 |
81 |
|
Gender (F/M) |
35/33 |
27/29 |
42/38 |
45/36 |
|
Age (years)1 |
55±9.5 |
60±9 |
51±7 |
56±9 |
|
Hemodialysis time |
N.A. |
N.A. |
7.9±5.3 |
5.6±3.9 |
|
DM2 time1 |
N.A. |
7.3±4.2 |
N.A. |
6.5±4.6 |
|
Glucose fasting (mg/dL)2 |
92(81-95) |
198(100-397)a |
111(62-99)a |
185(81-397)a |
|
Urea Pre (mg/dL)2 |
N.A. |
N.A. |
136(11-226) |
140(70-218) |
|
Urea Post (mg/dL)2 |
N.A. |
N.A. |
39(19-118) |
43(17-99) |
|
Creatinine (mg/dL)2 |
0.8(0.5-1.9) |
0.8(0.5-1.9) |
12.7(6.8-18)a |
10.5(4.8-15)a,b,c |
|
Total Cholesterol (mg/dL)2 |
164(82-300) |
127(94-223)a |
159(82-252) |
127(94-223)a,c |
|
Cholesterol LDL (mg/dL)2 |
80(31-167) |
68(29-147)a |
83(31-167) |
68(29-147)a,c |
|
Cholesterol HDL (mg/dL)2 |
49.5(21-69) |
38(21-65)a |
45(21-66) |
37(21-65)a |
|
Triglycerides (mg/dL)2 |
137(58-359) |
119(52-1050) |
127(37-359) |
124(52-1050) |
|
Albumin (g/dL) |
4(3.4-4.4) |
3.8(3.2-4.4) |
3.8(3.4-4.4) |
3.6(3-4.2) |
Table 1 Clinical and biochemical characteristics of the study population
1Data expressed as mean±standard deviation
2Data expressed in median (minimum and maximum)
ap<0.05 vs control; bp <0.05 vs DM2; cp <0.05 vs CKD. Analyzes determined by the One-Way ANOVA followed by Dunnett’s test. N.A.: not applicable
DM2, type 2 diabetes mellitus; CKD, chronic kidney disease; CKD-DM2, chronic kidney disease with Type 2 diabetes mellitus patients; n, sample number; F, Female; M, Male; LDL, low density lipoprotein; HDL, high density lipoprotein
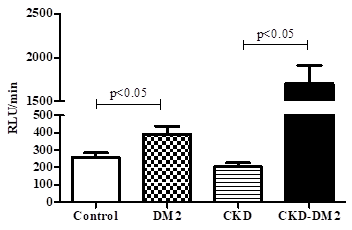
The ROS production for each studied group is shown in Figure 1. The results expressed as RLU/min (Relative Light Units/minute) were higher in DM2 than that observed in the control group (p<0.05) and chronic kidney disease patients (CKD) (p<0.05). ROS production by granulocytes in DM2 and CKD-DM2 groups was higher than that observed in healthy control and CKD groups (p<0.05). A significant difference (p<0.05) was also observed for healthy control compared to the CKD group.

Figure 1 Production of reactive oxygen species by granulocytes in the studied groups.
Values expressed as mean±standard error. Analysis determined by Student´s t test.
RLU/min, relative light unit/minute; DM2, type 2 diabetes mellitus; CKD, chronic kidney disease; CKD-DM2, chronic kidney disease with Type 2 diabetes mellitus patients.
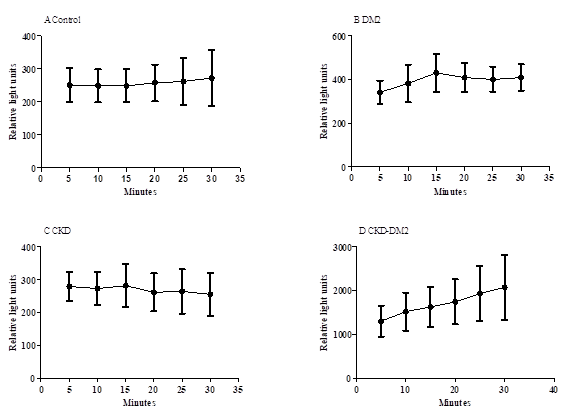
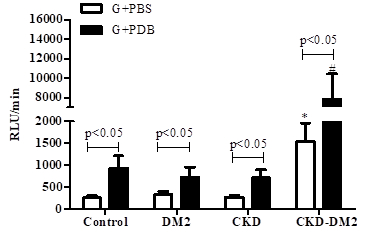
Figure 2 shows the kinetics studies on ROS generation by granulocytes without activation for each one of the studied groups. After five 5 minutes reaction, there is an increase of ROS in un-stimulated granulocytes followed by a plateau. Control group shows a plateau starting at around 200RLU/min for healthy control (Panel A); 300RLU/min for DM2 (Panel B); 300RLU/min for CKD (panel C) and 1000RLU/min for CKD-DM2 group (panel D). Granulocytes in the presence of PDB (Figure 3) produced a higher ROS level than that evaluated in the absence of phorbol ester (p<0.05). Granulocytes from patients with either CKD, DM2, or CKD-DM2 showed similar results. In contrast, granulocytes' mitochondrial ROS production from control group was higher (p>0.05) than cells from DM2, CKD, and CKD-DM2 (Figure 4). The results with mitochondrial ROS generation before and after hemodialysis are shown in Figure 5. No significant difference (p>0.05) was observed for intracellular ROS production for CKD patients before and after hemodialysis. Interestingly, in patients CKD-DM2 the intracellular ROS generation was significantly greater after hemodialysis (p<0.05). It reinforces the idea that diabetes hyperglycemia aggravates CKD worsening the progression of the disease.

Figure 2 Typical curve of kinetic study of unstimulated reactive oxygen species production by granulocytes from Control group (A), Type 2 diabetes mellitus patients (B), chronic kidney disease (C) and chronic kidney disease with type 2 diabetes mellitus (D). Values expressed as mean±standard error.
DM2, type 2 diabetes mellitus; CKD, chronic kidney disease; CKD-DM2, chronic kidney disease with Type 2 diabetes mellitus patients.

Figure 3 Production of reactive oxygen species in PDB-stimulated granulocytes (G) from controls, type 2 diabetes mellitus patients (DM2), chronic kidney disease patients (CKD) and chronic kidney disease patients with type 2 diabetes mellitus (CKD-DM2).
*p<0.05 vs Control, DM2 and CKD. #p<0.05 vs Control, DM2 and CKD. Values expressed as mean±standard error. Analysis determined by Student´s t test.
RLU/min, relative light unit/minute; PBS, phosphate buffered saline; PDB, phorbol 12,13-dibutyrate. n: 8 for each group.

Figure 4 Intracellular reactive oxygen species (ROS) production.
Values expressed as mean±standard error. #p<0.05 vs Control; *p<0.05 vs DM2. Analysis determined by Student´s t test. DM2, type 2 diabetes mellitus; CKD, chronic kidney disease; CKD-DM2, chronic kidney disease with Type 2 diabetes mellitus patients. n, = 20 for each group.

Figure 5 Intracellular reactive oxygen species (ROS) production pre and post hemodialysis (HD) in CKD patients in the absence (A) and presence (B) of type 2 diabetes.
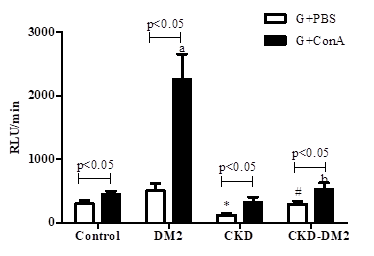
It is suggested that during hemodialysis, some cells (granulocytes), more fragile, could die and release products in the serum such as DNA. DNA, a DAMP is accepted to be a TLR9 activator, similar to ConA, a PAMP. ROS production in the presence of ConA was increased (p<0.05) in all groups (DM2, CKD, and CKD-DM2) compared to the granulocytes from healthy control in the absence of ConA (Figure 6). However, its effect is evident in cells from diabetic patients (DM2). These results suggest that a pro-inflammatory state mediated by hyperglycemia and possibly associated with endothelial dysfunction could be potentiated by TLR9 activation. Thus, it is possible to suggest a similar mechanism "in vivo" DNA-induced. To test this suggestion, serum DNA was quantified, and the results appear in Table 2. Serum DNA concentration, expressed as ng/mL, in the healthy control, CKD, and CKD-DM2 groups were similar (p>0.05). Before and after hemodialysis, serum DNA from CKD and CKD-DM2 groups were quantified to evaluate the dialysis membrane's effect on DNA extrusion. The concentration of DNA in the serum of patients in the CKD group before and after hemodialysis showed a slight but not significant increase (p>0.05). However, after hemodialysis, serum DNA from the CKD-DM2 group was significantly increased (p<0.05). It may suggest that cell death or extrusion, possibly induced by the contact between phagocyting cells and dialysis membranes (Table 3).

Figure 6 Production of reactive oxygen species in Concanavalin A (ConA)-stimulated granulocytes (G) from controls, type 2 diabetic patients (DM2), chronic kidney disease patients (CKD) and chronic kidney disease patients with type 2 diabetes (CKD-DM2).
Values expressed as mean±standard error. n = 10 for each group.
*p<0.05 vs Control; #p<0.05 vs CKD; ap<0.05 vs control. bp<0.05 vs CKD-DM2. Analysis determined by Student´s t test.
RLU/min, relative light unit/minute; PBS, phosphate buffered saline.
|
Groups |
Mean±standard error (ng/ml) |
|
Control |
0.57±0.07 |
|
CKD |
0.62±0.04 |
|
CKD-DM2 |
0.58±0.03 |
Table 2 Evaluation of serum DNA extrusion
Analysis determined by One-Way ANOVA test. n= 8 for each group
CKD, chronic kidney disease; CKD-DM2, chronic kidney disease with Type 2 diabetes mellitus patients
|
Groups |
Mean±standard error (ng/mL) |
p |
|
|
Pre-hemodialysis |
Post-hemodialysis |
||
|
CKD |
1.01±0.04 |
1.07±0.04 |
>0.05 |
|
CKD-DM2 |
0.79±0.05 |
1.06±0.09 |
<0.05 |
Table 3 DNA extrusion in serum from chronic kidney disease patients with or without diabetes pre- and post-hemodialysis
Analysis determined by Student´s t test. n = 10 for each group
CKD, chronic kidney disease; CKD-DM2, chronic kidney disease with Type 2 diabetes mellitus patients
Uncontrolled hypertension, misuse of medication, glomerulonephritis, polycystic kidney disease, urinary reflux, autoimmune disease, repeated infections, urinary obstruction besides diabetes can induce CKD. Our results suggest that non-diabetic CKD could be worsening by the association with hyperglycemia of diabetes (CKD-DM2). It is accepted that the inflammatory process's intensity defines the speed of evolution of both DM2 and CKD.4,6 The results showed in the Figures 1–4 demonstrate that ROS production by granulocytes was higher in patients with CKD-DM2 than that in patients with only CKD or healthy control. This difference was not observed with mitochondrial ROS generation (Figure 5). It may suggest that protein kinase C (PKC)-NADPH-oxidase signaling pathway ROS-producing is predominant in relation to mitochondrial ROS production in these pathologies. The intracellular or mitochondrial ROS after hemodialysis was significantly greater for CKD-DM2 in comparison to CKD patients. No difference was observed for CKD and CKD-DM2 patients before blood filtration procedure (Figure 6). Similar results were observed for DNA extrusion (Table 2). Therefore, patients with CKD acquiring diabetes can accelerate the kidney injury process leading to a worse prognostic. DNA could act like a DAMP on TLR9 activation in a similar action to ConA. The results with ConA demonstrate that DM2 without CKD produced greater ROS than CKD-DM2. Both DNA and ConA can activate TLR9 and we suggest that in vivo DNA can act like ConA in vitro, increasing the production of ROS and other inflammatory effectors. This comparison can be extended for the use of phorbol ester in vitro and hyperglycemia in vivo. PDB significantly activated the ROS production in CKD-DM2 and the hyperglycemia in vivo may act in similar away aggravating the kidney disease (Figure 3).
Both hyperglycemia and DNA (DAMP) could worsening the inflammatory process in kidney. These results corroborate other studies that describe several mechanisms of vascular damage hyperglycemia-induced, including ROS, cytokines, and the generation of advanced glycation end products (AGEs).21–28 Our experiments reinforce this suggestion (Figures 1-6, Tables 2 and 3). Some authors suggest that contact of the neutrophil with the dialysis membrane could induce ROS production, cell death, and DNA extrusion.29–34 Thus, the effect of the dialysis membrane needs to be considered in evaluating the cellular function. Tovbin et al.35 and Moreira et al.36 report a greater possibility of complications and less survival of patients with a high level of serum DNA levels, which determines a poor prognosis for this population. The DNA levels were greater in CKD-DM2 after hemodialysis (Table 3). It may be associated with blood filtration and hyperglycemia of diabetes.
The results of this study demonstrate that the inflammatory mechanisms are similar in both pathologies. Thus, hyperglycemia makes patients with CKD-DM2 are most affected. The role of ROS on DM2 and CKD pathologies may allow new therapeutic targets. Our results taken together will enable us to suggest that a CKD patient, when acquiring diabetes, even in its onset and still without known complications, may have aggravated its renal condition and accelerating the development.
The authors wish to thank Coordenação de Aperfeiçoamento de Pessoal de Nível Superior (CAPES), Conselho Nacional de Desenvolvimento Científico e Tecnológico (CNPq), Fundação de Amparo à pesquisa do Estado de Minas Gerais (FAPEMIG) and Rede Mineira de Toxina Terapêutica 26/12 for financial support. The funding bodies played no role in study design, data collection and analysis, or preparation /publication of the manuscript.
None.
The authors declare that they have no competing interests.

©2021 Ferreira, et al. This is an open access article distributed under the terms of the, which permits unrestricted use, distribution, and build upon your work non-commercially.