eISSN: 2575-906X


Mini Review Volume 1 Issue 4
Department of Botany and Microbiology, King Saud University, Kingdom of Saudi Arabia
Correspondence: Hanan Fahad Al Harbi, Department of Botany and Microbiology, College of Science, King Saud University, Kingdom of Saudi Arabia
Received: September 30, 2017 | Published: November 7, 2017
Citation: Al Harbi HF. Using remote sensing techniques and GIS in studying plant biodiversity. Biodiversity Int J. 2017;1(4):134-135. DOI: 10.15406/bij.2017.01.00019
Biodiversity plays an important role in many aspects of life, including food, medicine, economy and tourism. It also plays a role in renewal and stability of ecosystem; and in order to maintain these ecosystems, it is imperative to conduct research to preserve biodiversity and serve ways of preserving and protecting ecosystems from all forms of tampering. Remote sensing techniques and geographic information systems are examples of the modern methods that were used in plant environmental studies and actively help in conducting research which contributes in protecting the environment and biodiversity in general.
One of the most beneficial areas of remote sensing is studying vegetation cover by using satellite imagery and digital maps which could recognize the status of vegetation cover, and diagnose the condition of plants. Satellite imagery helps to monitor vegetation cover, estimate its area, classify it, predict its productivity and diseases that vegetation cover might have, estimate vegetation density and changes in plant biomass; and distinguish between different vegetation covers. Therefore, suggesting solutions to protect vegetation cover, contributes to the process of natural resources management and preserves forests from deterioration. Forests are an important source of biodiversity on earth; however, recently many of the world's forests suffer from diseases, resulting in the death of large numbers of trees. Many developed countries resort to a variety of measures and methods in order to reduce this.
These modern methods include the use of remote sensing techniques, which are used to identify diseased parts of the forest by Aerospace Survey, as well as in studies to combat desertification and land reclamation. Remote sensing techniques are also used to identify suitable areas for tourism that are characterized by biodiversity. In addition, they help in city planning processes and clarify the potential environmental impacts of expanding population and industrial areas at the expense of natural ecosystems.
Remote sensing techniques can be used to build a database on plant biodiversity for any area of interest. One of the programs used for analysis and interpretation of biodiversity is Super GIS Biodiversity Analyst, which integrates the GIS properties of exploring, displaying, querying, and spatial analysis and attributes data and biodiversity properties of species richness, diversity and evenness.
The program features are as follows:
Normalized Difference Vegetation Index (NDVI) is also one of the most well-known remote sensing techniques used in plant studies. The first to develop this Index is Rouse et al.1 based on the absorption estimation of red and infrared spectroscopy and is therefore a means of monitoring changes in vegetation cover. It is also related to the type and intensity of plant cover and the difference in the absorption of plants to red and infrared radiation compared to soil, so areas with dense vegetation cover differ in spectral characteristics from those shown in the short infrared range. This can be done by using the Normalized Difference Vegetation Index (NDVI) equation.2 The relative relationship between the third and the fourth domains is applied to the following equation: NDVI = (band 4 – band 3) / (band 4 + band 3).
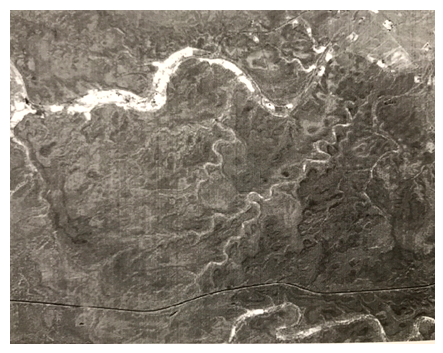
The third band represents red rays along a wavelength of light ranging from 0.63-0.69 micrometers, which can distinguish between dry areas and green areas. The fourth band represents Near Infrared with a wavelength of light ranging from 0.76-0.90 micrometers, which can also monitor the density and distribution of vegetation and can distinguish between plants, soil and water (Figure 1).

Figure 1 Normalized Difference Vegetation Index (NDVI), larger brightness elements represent greater vegetal content 4.
Currently, one of the most important vegetation Index is Tasseled Cap transformation - (TCT) which was developed by researchers Kauth & Thomas.3 This index is orthogonal transformation for space of the original ranges of image MSS into a new four-dimensional space which can be interpreted as Vegetation components. It has been tested intensively and proved effective. It is widely used today in agricultural research.4
Several studies have benefited from the use of remote sensing and GIS techniques in environmental studies and comparative studies of vegetation cover over a number of years, which have enabled to infer degradation or improvement of plant coverings. Finally, studies on plant biodiversity should be supported by remote sensing techniques and geographic information systems since they have a great benefit and high accuracy that serve this important field for all human aspects.5
None.
Author declares that there is no conflict of interest.

©2017 Al. This is an open access article distributed under the terms of the, which permits unrestricted use, distribution, and build upon your work non-commercially.