eISSN: 2378-315X


Research Article Volume 5 Issue 6
1Department of Epidemiology and Biostatistics, University of South Carolina, USA
2Department of Ophthalmology, University of North Carolina, USA
Correspondence: Xin Tong, Department of Epidemiology and Biostatistics, Norman J. Arnold School of Public Health, University of South Carolina, 915 Greene Street, Columbia, USA, Tel 8037775053
Received: March 09, 2017 | Published: May 5, 2017
Citation: Tong X, Zhang H, Bao W, et al. Cluster analysis of patients evaluated in laser refractive surgery. Biom Biostat Int J. 2017;5(6):223?230. DOI: 10.15406/bbij.2017.05.00151
Purpose: To investigate ocular Higher Order Aberrations (HOA) by examining Zernike polynomials with a novel application of clustering analysis adjusted for age, refractive error and pupil size.
Methods: Wavefront aberrations were measured with wavefront aberrometry (ZyWave, Technolas Perfect Vision) on 1509 patients (57.9% females) with a mean age of 43.1 ± 12.0 years (range 18 to 71). We modeled the association of 15 pupil size adjusted (PSA) Zernike polynomials (3rd to 5th order) with age and refractive error using linear regression. A statistical method called clustering of linear models (CLM) was used to identify the clusters of Zernike polynomials.
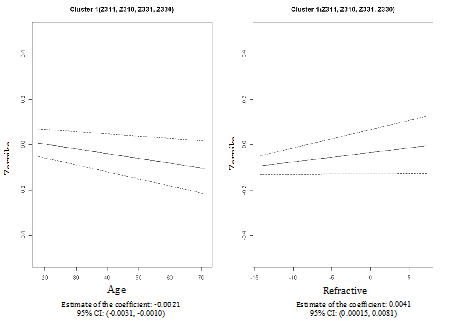
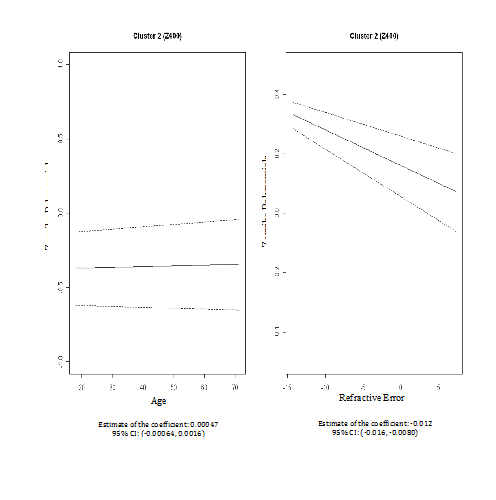
Results: Fifteen Zernike polynomials were grouped into four clusters through CLM adjusting for age and refractive error. In the first cluster (Z311, Z310, Z331 and Z330), the PSA Zernike polynomials increased with refractive error (regression coefficient, 0.0041; 95% empirical confidence interval [CI]: 0.00015 to 0.0081) but significantly decreased with age (coefficient, -0.0021; 95% CI: -0.0031to-0.0010). In the second cluster (Z400), the PSA Zernike polynomials decreased with refractive error (coefficient, -0.0065; 95% CI: -0.010 to -0.0029) but increased with age (coefficient, 0.004; 95% CI: 0.0031 to 0.0049). No significant associations were detected in the remaining two clusters (secondary astigmatism and secondary coma).
Conclusion: Taking advantages of regression model that accounts for pupil size, these results provide a better understanding of HOA in a more population-based perspective. Our clustering approach has the functional capacity to predict the values of Zernike polynomials that are relevant for clinical and commercial use.
Keywords: wavefront, zernike polynomials, aberrometry
HOA, higher order aberrations; PSA, pupil size adjusted; RMS, root mean square; SD, standard deviations; CLM, clustering of regression models; EM, expectation-maximization; BMV, boots trapped maximum volume; BIC, bayesian information criterion
Higher Order Aberrations (HOA) is distortions in light that result from physical alterations of the optical pathway. The primary ocular factors that contribute to HOA are the tear film, cornea and lens. Wavefront assessment instruments such as the Hartmann-Shack Sensor provide data from which the aberrations of the human’s eye are estimated. The understanding of HOA as applied to the visual system and the commercialization of devices that measure HOA has greatly expanded the use of these methods in the clinical setting. Zernike polynomials have been commonly used as the standard method for describing the shape of an aberrated wavefront.1
Zernike polynomials are an orthogonal series of basic functions normalized over a unit circle. They provide a precise mathematical model that has the ability to capture global shape. An important characteristic of Zernike polynomials is that lower order polynomials approximate the overall features of the anatomic shape of the eye very well, while the higher ordered polynomial terms capture local surface features only. A second important property of Zernike polynomials is that they have a direct relationship to optical function. These optical and geometric properties make Zernike polynomials particularly useful for study of the cornea and the optical systems of the eye.2
Many previous studies on HOA have reported associations with pupil size, age or refractive error,3-8 while only a weak correlation with age and little or no correlation with refractive error have also been demonstrated.9,10 In most of these studies, total higher order aberrations are measured by root mean square (RMS), a measure of the magnitude of the Zernike polynomials. RMS, as a summary statistic, does not allow us to evaluate the effects of individual Zernike polynomials and their associations with normal ocular characteristics (refractive error or pupil size) or in disease states.
Translational research on the role of HOA in normal and diseased states is difficult due to the complexity of HOA and associated variable conditions such as refractive error, age, pupil size and other tissue factors related to the tear film, cornea, lens, aqueous and vitreous. Most existing studies control certain factors such as pupil size by categorizing pupil diameters when analyzing HOA in order to avoid confounding effects. However, pupil size is a continuous measure and the arbitrary grouping of pupil size into discreet categories may cause biased inferences and loss of statistical power due to possible misclassification.12-15
Other studies that examine the pattern of Zernike polynomials usually focus on individual orders of aberration,16 such as studies that estimate associations between refractive error and age.17 These studies were mainly based on descriptive statistics, which did not allow for a quantitative systematic pattern on the associations. Furthermore, no studies have examined whether Zernike polynomials have similar associations with age and refractive error using a quantitative analysis that includes multiple orders of HOA. These findings have led us to ask, do Zernike polynomials representing multiple orders have unique profiles of specific HOA when analyzed together? Given the relatively large number of Zernike polynomials used to describe HOA, identification of similar behaviors (i.e., features) among Zernike polynomials has the potential to develop and improve aberrometry as a descriptive and diagnostic tool.
In this work, we first evaluate the association of Zernike polynomials for their association with age and refractive error and then identify features of HOA by summarizing the inferred associations via cluster analyses described by Qin and Self.18 Zernike polynomials in the analyses will be adjusted for pupil sizes. Previous studies adjust for pupil sizes by stratification (dividing patients into different groups according to their pupil sizes),11,19 such as rescaling pupil sizes into different groups, 6.00 mm, 5.00 mm, etc [8]. Individual pupil sizes are thus not used in the analysis, which potentially result in information loss. This exploratory study aims to identify groups of Zernike polynomials and evaluate their association with age and refractive error.
Data
A retrospective analysis of 1559 subjects was conducted in patients who were evaluated for laser refractive surgery at the Ophthalmology Clinic of the University of South Carolina School of Medicine. Wavefront aberrometry (ZyWave, Technolas Perfect Vision) was performed on subjects aged 18 and above as part of the preoperative evaluation process. To improve overall data quality, six eyes were excluded from the analysis, due to severe dry eye disease or grossly abnormal topography identified by Orbs can II, for a total of 1553 observations.20,21 Data were extracted to an excel file and then imported to statistical package for the analysis. Data were collected on race, age, refractive error, pupil size and the positive and negative values of each Zernike coefficient representing third, fourth and fifth order HOA. Among these 1553 participants, 44 had missing values in Zernike polynomials. The size of the sample used in the analysis was 1509. The study was approved by Institutional Review Board and in adherence with the Declaration of Helsinki guidelines regarding ethical principles for medical research involving human subjects.
Statistical methods
We utilized four analytical methods each with different goals. First, descriptive statistics (mean and standard deviations (SD) on age, refractive error and Zernike polynomials were calculated to describe the characteristics of our data and compare the subsample (n=1509) with the complete sample (n=1553) to check for consistency. Second, simple linear regression analyses were conducted to estimate the association between each Zernike polynomial and the covariates age and refractive error. Third, we employed methods of Qin and Self,16 who proposed a model-based clustering method called clustering of regression models (CLM), to group Zernike polynomials that share a similar relationship to the covariates, age and refractive error. Zernike polynomials vary from subject to subject and its variation is partially due to subjects’ pupil sizes. To adjust for this, we performed linear regression analysis on Zernike polynomials with pupil size as the independent variable. The residuals from this regression analysis were pupil-size-adjusted Zernike polynomials and were used in the remaining analyses. We designate, “PSA”, or pupil sized adjusted, throughout the manuscript to remind the reader that pupil size was included in the analyses. This approach represents a commonly used statistical method for adjusting the effect of a variable (i.e., pupil size in our application).22
Let y be the values of a PSA Zernike polynomial, e.g., horizontal coma. We model the association of y with age and refractive error using a linear regression, which is the essential modeling underlying the CLM method.
(1)
For a PSA Zernike polynomial Y in cluster k, the effect of age on this polynomial is and the effect of refractive error is . They describes, on average, how this Zernike polynomial changes with age and how it changes with refractive errors. Equation (1) can also be used to predict or estimate Zernike polynomials of a subject by plugging in the subject’s age and refractive error into (1).
To estimate the coefficients, the expectation-maximization (EM) algorithm was used to infer the cluster assignment of each PSA Zernike polynomial. The number of clusters is determined based on the Bayesian information criterion (BIC) and bootstrapped maximum volume (BMV) aiming to achieve the best and most stable clusters.18 The number of clusters is expected to have a large BIC value and a small BMV. Bootstrapping method is used to validate the number of clusters.
Fourth, in addition to CLM, we explored the possibility of using quantile regressions as the basis of clustering to improve the quality of clustering. Quantile regressions are suitable to describe heterogeneous associations, in which case linear regressions may produce biased inferences.
There were no statistically significant differences in characteristics between the subsample (n=1509) used in the analyses and the complete sample (n=1553) with respect to age, gender and refractive error (Table 1).
Whole data (n=1553) |
Data analyzed (n=1509) |
p-value* |
|
Female (%, n) |
58.14, n=903 |
57.92, n=874 |
0.88 |
Mean ± SD |
|||
Age (18 to 71 years) |
43.28 ± 12.05 |
43.12 ± 12.01 |
0.6 |
Refractive error |
-2.72 ± 3.12 |
-2.73 ± 3.12 |
0.90 |
Table 1 Assessment of selection bias. A comparison between the data used in the analysis and the complete data
*p-value is for the tests that the summary statistics (means or percentages) from the data analyzed are the same as those in the whole data.
Descriptive statistics for Zernike polynomials are shown in Figure 1 including the mean values and standard deviations of fifteen Zernike polynomials, denoted by Znmf. The first subscript n in the notation denotes the order of aberration, m is the magnitude of the angular frequency and f gives the direction of the angular frequency with 1 being positive and 0 being negative. As indicated by the horizontal zero line, most Zernike polynomials are centered at zero, except for Z310 (horizontal coma), Z330 (oblique trefoil) and Z400 (spherical). The mean of oblique trefoil aberrations is negative and the mean of spherical aberrations is positive, which is consistent with the literature.9,11,23,24 Furthermore, except for Z400, the variations in coma and trefoil aberrations are much higher than in the aberrations at higher levels.
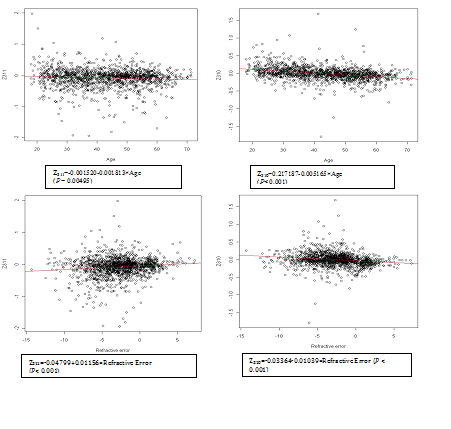
We applied simple linear regressions to each Zernike polynomial to examine its association with age and refractive error, respectively. Through these univariate analyses, some interesting patterns were noteworthy. For instance, both Z311 (vertical coma) and Z310 (horizontal coma) decreased with increasing age (Figure 2), but their associations with refractive error were opposite. Specifically, Z311 increased with refractive error, whereas Z310 decreased with increasing refractive error. Without further analysis, it’s unclear whether the coma aberrations (Z311 and Z310) shared a similar association with age after we adjusted for refractive error and pupil size. Furthermore, as shown in (Figure 2), positive and negative Zernike polynomials are consistent in terms of their association with age and refractive error. Thus in our subsequent analyses, we keep the positive and negative sign of each Zernike polynomial.
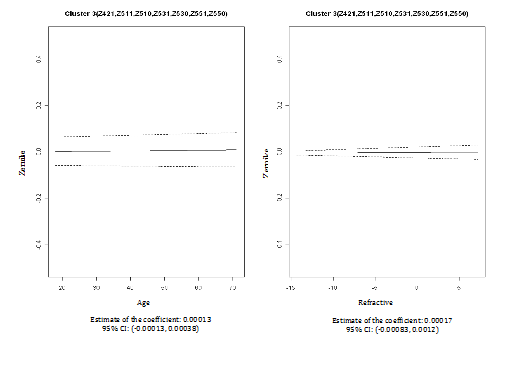
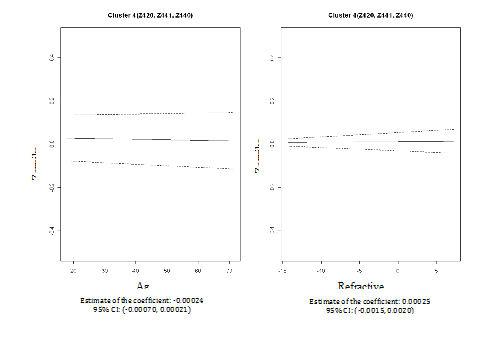
We then performed cluster analyses using the CLM method to examine the pattern similarity between the fifteen PSA Zernike polynomials based on their associations with age and refractive error. Based on the BIC/BMV method, four clusters were identified; and the number of cluster 4 is later confirmed by bootstrapped samples. In the first cluster (Z311, Z310, Z331 and Z330), the PSA Zernike polynomials increase with refractive error but decreased with age after adjusting for each other and both patterns were statistically significant (column 2 in Table 2 & Figure 3). The second cluster only includedZ400. In this cluster, statistic relationships opposite to that in cluster one were observed; PSA Zernike polynomials were negatively associated (statistically significant) with refractive error, but tend to be positively associated with age (column 3 in Table 2 & Figure 4). In the remaining two clusters, although the patterns were not statistically significant, the PSA Zernike polynomials (secondary astigmatism and secondary coma) in the 3rd cluster tended to increase with both refractive error and age and in cluster 4, it suggested that PSA Zernike polynomials decrease with age but increase with refractive error (columns 4 & 5 in Table 2, Figures 5 & 6). These features in general were consistent with the findings from a preliminary study.25
Covariates |
Cluster 1 |
Cluster 2 |
Cluster 3 |
Cluster 4 |
Refractive error |
0.0041 (0.00015, 0.0081) |
-0.012 (-0.016, -0.0080) |
0.00017 (-0.00083, 0.0012) |
0.00025 (-0.0015, 0.0020) |
Age |
-0.0021 (-0.0031, -0.0010) |
0.00047 (-0.00064, 0.0016) |
0.00013 (-0.00013, 0.00038) |
-0.00024 (-0.00070, 0.00021) |
Cluster assignment |
Z311, Z310, Z331, Z330 |
Z400 |
Z421, Z511, Z510, Z531, Z530, Z551, Z550 |
Z420, Z441, Z440 |
Table 2 The effects of refractive error and age on Zernike polynomials (95% empirical intervals are included in the parentheses)
In this article, linear regressions were applied in the cluster analysis. However, some interesting patterns observed in our data are noteworthy. We used the association of Z311 with refractive error as an example to illustrate our observation (Figure 7). We fitted the data with regression lines using two different methods. The solid black line was the linear regression line drawn by regression toward the mean, which is the basis of the clustering method used in our work. The other dashed lines were from quantile regressions. As shown in the Figure 7, the linear regression line (solid black line) roughly overlapped with the median regression line (dashed black line). However, it was clear to see that the associations of Z311 with refractive error were different at different quantiles i.e., different for different populations, which required further investigation.
In this study, fifteen pupil-size-adjusted (PSA) Zernike polynomials were grouped into four clusters via the method of clustering through regression. PSA Zernike polynomials within each cluster shared the same patterns with respect to age and refractive error. Significant associations of Zernike polynomials with age and refractive were only observed in the clusters formed by the third order (coma Z311, Z310 and trefoil Z331 and Z330) and fourth order polynomials (spherical aberration Z400).The study population included in this study was normative without evidence of ocular diseases.
Understanding the complexity of the individual Zernike polynomials by disentangling them in clusters using the analytical methods applied herein may help to clarify the associations of HOA with age and refractive error and more broadly, may lead to a deeper understanding of the effect of ocular conditions and diseases that affect the visual pathway. Compared to other HOA studies, the advantage of this work is 1) the relatively large sample in which cluster analysis is used to describe HOA in a normative population, 2) a systematic analysis on the associations of HOA with age and refractive error that provides more detail than an assessment using the summary statistic, RMS and 3) the ability to identify cluster patterns to estimate and predict Zernike polynomials for an individual patient representative of a normative database and to utilize clustering analysis to better describe ocular pathological conditions that affect HOA. This may lead to greater relevance of aberrometry in the early diagnosis and improved quantification of pathological conditions, such as keratoconus, dry eye disease, or cataract.
Other pattern analyses have been applied to understand Zernike polynomials for different populations such as neural network decision trees and classification decision trees.2 These decision trees classify subjects into different groups based on their Zernike polynomials with each group representing a specific disease status, e.g., keratoconus. However, age, refractive error and pupil size are confounded and not adjusted in the process of tree constructions, which can possibly result in misleading conclusions. Our proposed clustering methods, on the other hand, estimate the effects of age and refractive error with pupil size adjusted while identifying the patterns. Future work may be to introduce the clustering process into the neural network decision trees or classification trees to more effectively and meaningfully group subjects according to disease-specific HOA.
Via a new application of a model-based clustering method, we were able to examine the features of HOAs at different orders on their relationships with age and refractive error adjusted for pupil size. Significant associations of Zernike polynomials with age and refractive were observed in two clusters formed by the third order polynomials (Z311, Z310, Z331 and Z330) and spherical aberration Z400. However, in terms of relationships of Zernike polynomials with age and refractive error, the features of HOA in these two clusters were completely different. Among the clustered third order polynomials, a negative association with age and a positive association with refractive error were observed. In the cluster that only included Z400, opposite associations were detected. The other two clusters, although the findings were not statistically significant, suggest some interesting HOA features as well; for instance, all fifth order Zernike polynomials tended to be positively associated with both age and refractive error. These summarizing findings on HOA features would not be achieved through classical regression analyses applied to each individual Zernike polynomials. It is worth to note that these findings represent a presumably normal population evaluated for vision correction surgery. The methods described herein may lead to greater relevance of aberrometry in the early diagnosis and improved quantification of pathological conditions, such as keratoconus, dry eye disease, or cataract.
The authors thank Dr. Cheeseman and his group in the Department of Ophthalmology at the University of South Carolina in the data collection process. The project is supported by the Promising Investigator Research Award granted by the Office or Research at the University of South Carolina.
None.

©2017 Tong, et al. This is an open access article distributed under the terms of the, which permits unrestricted use, distribution, and build upon your work non-commercially.
2 7