eISSN: 2378-315X


Research Article Volume 3 Issue 2
Regret for the inconvenience: we are taking measures to prevent fraudulent form submissions by extractors and page crawlers. Please type the correct Captcha word to see email ID.
1School of Business, Uttara University, Bangladesh
2Department of Statistics, Hajee Mohammad Danesh Science & Technology University, Bangladesh
Correspondence: Md. Mohsan Khudri, School of Business, Uttara University, Uttara, Dhaka-1230, Bangladesh
Received: November 29, 2015 | Published: January 19, 2016
Citation: Khudri M. Assessing the role of age specific fertility rate on downturn in maternal mortality ratio in bangladesh. Biom Biostat Int J. 2016;3(2):37-42. DOI: 10.15406/bbij.2016.03.00059
Specific mechanism needs to be developed for proper monitoring of maternal mortality with a view to advocating for policy making and tracking progresses. Prior to meeting this need, impact of factors associated with maternal mortality ratio (MMR) needs to be evaluated. Hence, this article endeavors to decompose the overall decline in the MMR in Bangladesh observed between 1991 and 2011 into two components which are namely decline attributable to fertility decline and decline attributable to safe motherhood programs. In this study, age specific fertility rate (ASFR) has been employed as fertility indicator. The results disclose that fertility decline in Bangladesh between 1991 and 2011 has played vital role in reducing MMR. About 44 percent of the estimated number of maternal lives saved in 2011 was attributable to safe motherhood programs. The estimates also show that the MMR in Bangladesh was declined by 53.81% in the last 20 years (1991-2011) on account of fertility reduction merely during the given period. About 41 percent decline was observed in actual birth from projected births owing to fertility decline. Fertility rate decline caused about 49 percent decline in actual maternal deaths (AMD) observed between 1991 and 2011 whereas the remaining portion of decline in AMD was attributed to safe motherhood programs.
Keywords: maternal mortality ratio, fertility, age specific fertility rate, maternal deaths
MMR, maternal mortality ratio; ASFR, age specific fertility rate; AMD, actual maternal deaths; MDG 5, millennium development goal 5; CBR, crude birth rate
The death of a woman during or after (within 42 days) pregnancy or childbirth caused by severe bleeding, infections, high blood pressure during pregnancy (pre-eclampsia and eclampsia), complications from delivery or unsafe abortion is termed as maternal death. It poses a great challenge to global health systems. Albeit several measures have been taken to control but these are not supposed to be sufficient to intensify policy intervention for maternal mortality. An International Conference held in 1994 on Population and Development bolstered international commitment to reproductive health.1 Facts regarding rates and trends in maternal mortality are imperative for achieving Millennium Development Goal 5 (MDG 5) since its target is 75% reduction in maternal mortality ratio (MMR) from 1990 to 2015.2
MMR refers to the number of maternal deaths per 100,000 live births.3 It is the ratio of maternal deaths and live births during a year reflecting the probability of death resulting from causes associated with pregnancy or childbirth among those who became pregnant. The global average MMR is 226 per 100,000 live births4 which is still lower than the proposed annual decline of 5.5% required to achieve the Millennium Development Goal 5.5 In accordance with regional-level analysis of trends in MMR decline, progress in sub-Saharan Africa has been relatively slow in comparison with that in South America and Asia.5,6 Three South Asian countries-India, Pakistan and Bangladesh -accounted for 64% of the global decline of 188,000 annual maternal deaths between 1990 and 2008.3 Unfortunately, in Bangladesh, almost 71% of total births are delivered at home while twenty-nine percent of births are delivered at a health facility including 15 percent in a private facility, 12 percent in a public facility, and 2 percent in an NGO facility.7 Therefore a large proportion of births in Bangladesh cannot recognize these obstetric complications and thus may not refer mother in time to health facilities that provide comprehensive emergency obstetric-care services. MMR can decline when fewer women die because of causes related to pregnancy.
Safe motherhood programs comprising several initiatives were introduced in 1987 with a view to declining maternal mortality ratio.8 The main objective of these programs is to make childbirth safer. As part of that these programs paid heed to decline MMR by ensuring healthcare facilities at the time of delivery or involving adroit birth attendants if deliveries take place at home or laying on improved obstetric care facilities.
Albeit all these initiatives have performed reasonably well, nevertheless the progress in maternal mortality has not been found or it has been slow either in many places.9,10 The proxy indicators of the effects of safe motherhood programs indicate progress over time; nevertheless it is not to able to explain decline in MMR altogether. Hence, in this study we have deemed another component of MMR, i.e. fertility decline along with safe motherhood programs. It is playing role efficaciously in declining MMR. It also helps reduce the number of annual maternal deaths, expected lifetime risk of women’s death resulting from pregnancy, childbirth associated causes. A study conducted by Jain3 revealed that around 39 percent decline in MMR between 1990 and 2008 is attributable to fertility reduction while about 61 percent attributable to safe motherhoods program. In that study, crude birth rate (CBR) was used as an indicator of fertility and latter it was used to calculate annual number of live births.
The objective of this study is to measure the effect of fertility decline mainly on overall decline in MMR between 1991 and 2011. We have employed the method proposed by Jain3 and considered age specific fertility rate (ASFR) as an indicator of fertility to calculate annual number of live births.
Data used in this study were collected from the Population and Housing Census 2011. The decomposition method used in this includes four steps:
Calculation of projected and actual births in 2011
In this study we have used ASFR as a fertility indicator. To estimate the projected births in 2011 assuming constant fertility since 1991, we have proceeded to the following approach. Firstly, we have calculated women population in the ith reproductive age group at 2011 with constant annual growth since 1991
where, = women population in the ith reproductive age group at 1991
= Average annual growth rate for female at ith age group, 1991-2001
Secondly, using ASFR of the women in the ith reproductive age at 1991 we have calculated projected births for the women belong to that age group at 2011 assuming constant fertility since 1991 .
Total Number of projected births,
We also calculated the actual number of births for the women belong to ith reproductive age group at 2011 using ASFR of the women in the ith reproductive age at 2011 .
where, = women population in the ith reproductive age group at 2011.
Total Number of Actual births at 2011,
Estimation of the potential number of maternal deaths in 2011
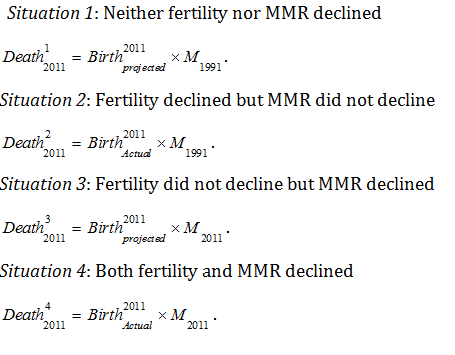
To estimate the number of maternal deaths that were averted in 2011, the actual number of maternal deaths occurred in 2011 is first estimated by using the levels of fertility and the MMR observed in 2011, factoring in the decline observed between 1991 and 2011 in both MMR and fertility. The age specific fertility is used as an indicator of fertility. The annual number of live births given by mothers of a certain age group within reproductive period calculated by multiplying the ASFR of that age group by the total number of female at the age group. Four counterfactual exercises are then conducted to estimate the potential number of maternal deaths expected in 2011 under four situations regarding changes in fertility and the MMR (M) between 1991 and 2011:
Decomposition of potential number of maternal lives saved in 2011
Using potential number of maternal deaths in 2011 estimated under different situations regarding changes of fertility and MMR we have decomposed the potential number of maternal lives saved in 2011.
The Gross effect of MMR decline on maternal lives saved,
The Gross effect of Fertility decline on maternal lives saved,
The Gross effect of decline in both Fertility and MMR on maternal lives saved,
The Joint effect of decline in both Fertility and MMR on maternal lives saved,
This joint effect calculation allows us to estimate the net effect of fertility decline and the net effect of MMR decline on the potential number of maternal lives saved in 2011. The net effect of fertility decline would reflect the proportion of potential number of maternal lives saved through such safe motherhood initiatives as institutional deliveries, skilled birth attendants, and comprehensive emergency obstetric-care services. It can be estimated as follows,
The Net effect of decline in MMR,
The net effect of fertility decline would reflect the proportion of potential number of maternal lives saved through a reduction in the annual number of live births.
The Net effect of decline in Fertility,
Now the percent of the potential number of maternal lives saved in 2011 due to safe motherhood programs, decrease in live births and fertility reduction realized through its effect on MMR reduction can be estimated as
Effect of safe motherhood =
Effect of decrease in live births =
Effect of fertility reduction realized through its effect on MMR reduction =
Estimation of the level of MMR implied by fertility decline between 1991 and 2011
Maternal Deaths in 2011 implied by fertility reduction observed during 1991-2011,
Decomposition of MMR decline observed between 1991 and 2011
The total maternal mortality ratio decline observed between 1991 and 2011 is decomposed into two components: MMR decline attributable to fertility decline and MMR decline attributable to safe motherhood initiatives.
Decline in MMR attributable to fertility reduction =
Decline in MMR attributable to safe motherhood initiatives =
Similarly, the annual number of actual maternal lives saved between 1991 and 2011 is decomposed into these two components.
Decline in actual maternal deaths attributable to fertility reduction =
Decline in actual maternal deaths attributable to safe motherhood initiatives =
Table 2 shows the potential number of maternal lives saved in 2011 because of fertility and MMR reductions that occurred between 1991 and 2011. The age specific fertility rate (ASFR) is used as an indicator of fertility. Apparently 22097 maternal deaths would have occurred in 2011 in Bangladesh if neither fertility nor the MMR declined during this period. In comparison, about 6025 maternal deaths actually occurred with the declines in fertility and the MMR observed during this period. Reductions in both fertility and the MMR observed during this period thus potentially saved close to 16072 maternal lives in Bangladesh. About 44 percent of the estimated number of maternal lives saved in 2011 is attributable to safe motherhood programs. The remaining 56 percent of the estimated number of maternal lives saved in 2011 can be attributed to fertility reduction: 26 percent attributable to the decrease in the number of live births and 30 percent attributable to changes in the age–parity composition of births.
Decomposition of MMR decline observed between 1991 and 2011
Table 3 shows the estimated decline in the MMR in 2011 attributable to fertility decline observed between 1991 and 2011. The estimates show that the MMR in Bangladesh would have declined from 472 in 1991 to 218 in 2011 because of fertility reduction alone during this period. This means that 104 points, or about 41 percent of the total decline of 254 points in the MMR in Bangladesh, can be attributed to fertility reduction. The remaining decline of about 59 percent can thus be attributed to safe motherhood programs.
Decomposition of maternal deaths decline observed between 1991 and 2011
Table 4 shows the estimated decline in the maternal deaths in 2011 attributable to fertility decline observed between 1991 and 2011. Number of actual maternal deaths in 1991 was around 1418388 and it was dropped more than 50 percent in the year 2011. In Bangladesh about 815853 fewer women died in 2011 from childbirth-related complications than in 1991. About 401399 (49 percent) of these actual maternal lives saved in Bangladesh can be attributed to fertility decline observed between 1991 and 2011.
Reproductive age group of women |
Population at 1991 (in '000) |
Average annual growth rate for female at reproductive age, 1991-2001 |
Estimated population at 2011 with constant annual growth since 1991 |
Population at 2011 |
ASFR in 1991 |
ASFR in 2011 |
Projected births in 2011 assuming constant fertility |
Actual births in 2011 |
15-19 |
4681 |
0.0204744 |
7049810.92 |
6352398 |
80 |
50 |
563984.87 |
317619.9 |
20-24 |
5009 |
0.0216127 |
7717507.56 |
7522419 |
200 |
140 |
1543501.51 |
1053138.66 |
25-29 |
4934 |
0.0199549 |
7354039.15 |
7254256 |
180 |
110 |
1323727.04 |
797968.16 |
30-34 |
3301 |
0.026433 |
5600668.6 |
5420659 |
120 |
70 |
672080.23 |
379446.13 |
35-39 |
2782 |
0.0273169 |
4804286.26 |
4859079 |
80 |
30 |
384342.9 |
145772.37 |
40-44 |
2215 |
0.0240648 |
3584249.24 |
3980739 |
40 |
10 |
143369.9 |
39807.39 |
45-49 |
1669 |
0.0209429 |
2537256 |
3016800 |
20 |
10 |
50745.1 |
30168 |
Total |
24591 |
45902074 |
38406350 |
4681751.6 |
2763921 |
Table 1 Birth calculation
Parameter |
Estimated figure |
Estimated number of maternal deaths in 2011 |
|
No change in ASFR and no change in MMR |
22097.87 |
No change in ASFR and MMR declined |
10206.22 |
ASFR declined but no change in MMR |
13045.7 |
Both ASFR and MMR declined |
6025.35 |
Potential number of maternal lives saved in 2011 from |
|
Total effect of decline in MMR |
11891.65 |
Total effect of decline in Fertility decline |
9052.16 |
Total effect of decline in both |
16072.52 |
Overlap between the effect of declines in fertility and in MMR |
4871.29 |
Net effect of decline in MMR |
7020.35 |
Net effect of decline in Fertility |
4180.87 |
Percent distribution of the potential number of maternal lives saved in 2011 |
(%) |
Effect of safe motherhood |
43.68 |
Effect of safe decrease in live births |
26.01 |
Effect of fertility reduction realized through its effect on MMR reduction |
30.3 |
Table 2 Effect of declines in MMR and fertility on estimated number of maternal deaths
Parameter |
Estimated Figure |
Proportionate decline in actual births from projected births in 2011 |
0.41 |
Total decline in MMR between 1991 and 2011 |
254 |
MMR in 2011 implied by fertility reduction observed during 1991-2011 |
367.95 |
Decline in MMR attributable to fertility reduction |
104.04 |
Decline in MMR attributable to safe motherhood initiatives |
149.95 |
% decline in MMR attributable to fertility reduction |
40.96 |
% decline in MMR attributable to safe motherhood initiatives |
59.04 |
Table 3 MMR in 2011 Implied by Fertility Decline Observed Between 1991 and 2011
Parameter |
Estimated Figure |
Actual Births in 1991 |
3005060 |
Actual Births in 2011 |
2763920.61 |
MMR in 1991 |
472 |
MMR in 2011 |
218 |
Total decline in MMR between 1991 and 2011 |
254 |
MMR in 2011 implied by fertility reduction observed during 1991-2011 |
367.95 |
Maternal Deaths in 1991 |
1418388.32 |
Maternal Deaths in 2011 |
602534.69 |
Maternal Deaths in 2011 implied by fertility reduction observed during 1991-2011 |
1016988.82 |
Decline in actual maternal deaths between 1991 to 2011 |
|
Total |
815853.6 |
Attributable to Fertility Decline |
401399.5 |
Attributable to Safe Motherhood |
414454.13 |
Percent decline in actual maternal deaths between 1991 to 2011 |
|
Attributable to Fertility Decline |
49.2 |
Attributable to Safe Motherhood |
50.8 |
Table 4 Actual maternal deaths in 2011 implied by fertility decline observed between 1991 and 2011
Maternal mortality ratio (MMR) is defined as the number of maternal deaths per 100,000 live births. There are various causes of maternal deaths, mainly by four causes namely hemorrhage, sepsis, hypertensive disorders, and obstructed labor. Usually, three indicators are used to measure maternal mortality. These are the maternal mortality rate, women’s average lifetime risk of death due to pregnancy-related causes, and the annual number of maternal fatalities which can be easily derived mathematically. The calculation of these indicators depend on the proportion of women becoming pregnant in a year, the average number of pregnancies per woman, and the product of population size and crude birth rate. The relationship between fertility decline and MMR is not so easily derived. Since millennium development goal 5 uses MMR as its indicator, and prevailing attributions of declines in maternal mortality entirely to the achievements of safe motherhood, therefore studying such relationship is crucial.3 In this article we have used a simple method proposed in3 to decompose the overall decline in the MMR in Bangladesh observed between 1991 and 2011 into two components: decline attributable to fertility decline and decline attributable to safe motherhood programs. They have used crude birth rate as fertility indicator. However, this study used age specific fertility rate as fertility indicator. The results show that fertility decline in Bangladesh between 1991 and 2011 has made a substantial contribution to the reduction of the MMR. About 44 percent of the estimated number of maternal lives saved in 2011 is attributable to safe motherhood programs. The estimates show that the MMR in Bangladesh would have declined from 472 in 1991 to 218 in 2011 because of fertility reduction alone during this period. About 41 percent of the total decline of 254 points in the MMR in Bangladesh can be attributed to fertility reduction. About 401399 (or about 49 percent) of actual maternal lives saved can be attributed to fertility decline observed between 1991 and 2011.
None.
None.

©2016 Khudri, et al. This is an open access article distributed under the terms of the, which permits unrestricted use, distribution, and build upon your work non-commercially.
2 7