eISSN: 2378-315X


Mini Review Volume 2 Issue 4
1Department of Statistics, Rajshahi University, Bangladesh
2Department of Statistics, Bangabandhu Sheikh Mujibur Rahman Science and Technology University, Bangladesh
Correspondence: Md. Tofazzal Hossain, Department of Statistics, Bangabandhu Sheikh Mujibur Rahman Science and Technology University, Gopalganj, Bangladesh
Received: March 23, 2015 | Published: April 9, 2015
Citation: Haque A, Hossain T, Nasser M. Predicting the number of children ever born using logistic regression model. Biom Biostat Int J. 2015;2(4):96-99. DOI: 10.15406/bbij.2015.02.00034
Modeling total children ever born is very crucial since Bangladesh is going under a rapid growth of population. We use logistic regression model, a well-known technique for categorical data analysis, to predict the number of children ever born using BDHS (2011) data. BDHS data is not random, since two stages stratified sampling is conducted to collect the data. Cluster correction and weight adjustment is necessary for analyzing this data. An extensive literature search fails to find any work which uses these adjustments for predicting the number of children ever born. In this paper these two adjustments have been used for predicting the number of children ever born. The prediction performance has been measured by training and test error.
Keywords: logistic regression model, Weight adjustment, cluster correction
BDHS, bangladesh demographic and health survey; NIPORT, national institute for population research and training; EA, enumeration areas
The density of population in our country is 13th in the world where 1118.65 persons live per square km.1 As a result, we face several crises such as poor economic condition, lack of quality education, lack of good medical facilities, lack of improved accommodation, poverty etc. The Government of Bangladesh has coined two popular family planning slogans: Two is good enough-boy or girl and one child are good, but no more than two. We should control the population increase throw controlling the variable that influence growth rate. So it is important to model ’Total Children Ever Born’ which represent potentiality of population growth.
Several works have been done using the variable ’Total Children Ever Born’. In,2 Negative Binomial Regression model and Generalized Poisson Regression model is compared for this variable.3 Shows the Effects of socio-demographic factors on children ever born for domestic and non-domestic violence.4 Examines the patterns and differentials of birth intervals of ever married women in Bangladesh. In the above mentioned articles, cluster correction and weight adjustment have not been adopted, although the data is collected under two stage stratified sampling. In this paper, we use logistic regression model making these adjustments for predicted the number of Children Ever Born and measure the prediction performance.
There are four sections in this paper. Section one introduces the problem whereas section two discusses data source, data nature, statistical technique that is used in this article. Section three presents results and discussion. Finally, section four concludes the findings.
Data description
The study is based on secondary data. The sources of data are the Bangladesh Demographic and Health Survey (BDHS) - 2011. The BDHS-2011 data was conducted under the authority of the National Institute for Population Research and Training (NIPORT) of the Ministry of Health and Family Welfare. It was implemented by Mitra and Associates, a Bangladeshi research firm located in Dhaka. The BDHS-2011 sample was stratified and selected in two stages. Each division was stratified into urban and rural areas. The urban areas of each division are further stratified into two strata: city corporations and other than city corporations. In the first stage, 600 Enumeration Areas (EA) were selected, with probability proportional to the EA size and with independent selection in each sampling stratum. In the second stage of selection, a fixed number 30 household per cluster was selected with an equal probability systematic selection from the newly created household listing.
With this design, the survey selected 18,000 residential households, and was expected to result in completed interviews with about 18,000 ever married women. In addition, ever-married men age 15-54 in every third household were eligible for the male survey. But for the sake of computational advantage without losing much information required to meet our objectives we consider women (40-49 years old) who reached the last stage of reproductive period in their lives. In this stage there were 2979 women with average (Median) 4 children ever born, which indicates that there is much need to decrease the target variable.
Variables under study
In the 2011 BDHS, a number of socio-economic and demographic variables are available. With help of descriptive plots of the data set as well as previous studies,5 we considered only seven explanatory variables namely fertility preference, same sex of first two children, age at first cohabitation, education of couple, religion, respondent currently working and food security which are found highly related to the response variable. The response variable ‘Total Children Ever Born’ has 22 categories which are 0, 1… 21. For our study purposes, we make only two categories 0 for the number of children two or less and 1 for more than two children. In the original data, there are variables for the sex of the children. Using this information we make the variable ‘same sex of first two children’ which has only two categories 0 for sex of first two children is not same and 1 for sex of first two children is same. The original data set has the variables husband’s education and wife’s education but the two variables are tending to collinear. To avoid multi collinearity problem, we make the variable ‘education of couple’ combining the two variables which has three categories 0 for at least one (husband or wife) is below SSC, 1 for both completed SSC and 2 for both completed HSC or above. No previous studies used the variable food security but we use here because this variable is highly related to the response variable.
Logistic regression
In logistic regression model, the dependent variable is categorical and the independent variable may either be categorical or continuous.6 The binary logistic regression model for the binary dependent variable ![]() and the independent variables
and the independent variables ![]() is given by
is given by
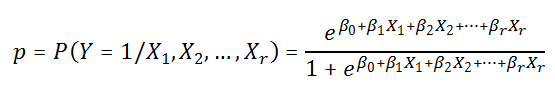
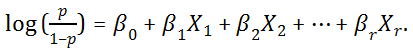
The above relationship can be expressed alternatively in terms of log odds associated with as follows:
First we show the proportions for our categorical study variables which are risk factors for the large family for all the BDHS data in Table 1.
|
Variables |
1993-94 |
1996-97 |
1999-00 |
2004 |
2007 |
2011 |
|
Number of children >2 |
94.53 |
92.56 |
89.63 |
88.87 |
84.4 |
80.08 |
|
Fertility preference |
||||||
|
Have another |
2.51 |
2.34 |
2.26 |
2.36 |
2.9 |
3.44 |
|
Undecided |
0.76 |
1.01 |
0.24 |
0.26 |
0.21 |
0.19 |
|
No more |
61.63 |
55.92 |
65.77 |
61.88 |
69.01 |
82.54 |
|
Sterilized (respondent or partner) |
18.92 |
22.27 |
21.19 |
18.22 |
15.21 |
13.83 |
|
Declared in fecund |
16.19 |
18.46 |
10.54 |
17.28 |
12.67 |
|
|
Same sex of first two children |
48.47 |
44.71 |
47.79 |
47.22 |
46.81 |
45.03 |
|
Couples education |
||||||
|
at least one is below SSC |
95.44 |
95.31 |
91.19 |
91.45 |
90.35 |
87.48 |
|
Both are SSC Complete |
3.17 |
3.23 |
5.09 |
5.58 |
5.7 |
8.27 |
|
Both are HSC Complete and above |
1.39 |
1.45 |
3.73 |
2.97 |
3.95 |
4.25 |
|
Religion (Islam) |
84.87 |
86.74 |
82.75 |
87.57 |
89.7 |
86.82 |
|
Respondent currently working (yes) |
15.52 |
39.25 |
23.79 |
24.91 |
31.64 |
14.63 |
|
Food Security |
||||||
|
Secure |
62.75 |
|||||
|
Insecure |
|
|
|
|
|
37.25 |
Table 1 Proportions of our categorical study variables for different BDHS data
From Table 1, we observed that the families with greater than two children are decreasing over time. For the fertility preference variable the proportion of the category ‘no more’ is highest and increasing day by day. That is people are being aware of keeping family size small. For the variable ‘couples education’, the proportion of the categories ‘both completed SSC’ and ‘both completed HSC’ are increasing over time. Which indicates that the education rate is increasing over time? For the variable ‘respondent currently working’, the proportion is sometimes increasing and sometimes decreasing and in 2011 it has fallen down. One of the reasons may be that people are being educated but they are not getting jobs. The results of the logistic regression model for predicting the total children ever born are given in Table 2.
|
Predictor variables |
Odds ratio |
Std. Err. |
t-test |
p-value |
95% CI of OR |
|
Fertility preference |
|||||
|
No more |
Reference |
||||
|
Have another |
0.08 |
0.03 |
-7.58 |
0 |
0.04-0.16 |
|
Undecided |
19.37 |
23.34 |
2.46 |
0.01 |
1.82-206.54 |
|
Sterilized (respondent or partner) |
0.68 |
0.12 |
-2.2 |
0.03 |
0.478-0.96 |
|
Declared in fecund |
0.62 |
0.12 |
-2.49 |
0.01 |
0.43-0.90 |
|
Sex of first two children |
|||||
|
Different sex of first two children |
Reference |
||||
|
Same sex of first two children |
1.54 |
0.19 |
3.62 |
0 |
1.22-1.95 |
|
Age at first cohabitation |
0.87 |
0.02 |
-6.53 |
0 |
0.83-0.90 |
|
Education level of husband and wife |
|||||
|
Husband or Wife is below SSC |
Reference |
||||
|
Both are completed SSC |
0.68 |
0.13 |
-1.95 |
0.05 |
0.46-1.00 |
|
Bothe are HSC or above |
0.24 |
0.06 |
-5.31 |
0 |
0.14-0.41 |
|
Religion |
|||||
|
Others |
Reference |
||||
|
Islam |
1.53 |
0.25 |
2.6 |
0.01 |
1.11-2.11 |
|
Respondent currently working |
|||||
|
No |
Reference |
||||
|
Yes |
0.46 |
0.08 |
-4.75 |
0 |
0.33-0.63 |
|
Food security |
|||||
|
Secure |
Reference |
||||
|
Insecure |
1.38 |
0.17 |
2.62 |
0.01 |
1.081.76 |
|
Constant |
33.45 |
12.82 |
9.16 |
0 |
15.75-71.01 |
Table 2 Results of logistic regression model
From the Table 2 it is observed that all the predictors have statistically significant effect on the response variable (‘Total children ever born’). Women with fertility preference undecided are 19.37 time more likely to have more than two children than those with fertility preference no more. Families with the same sex of first two children are 1.54 times more likely to have more than two children than families with different sex of first two children. Families with both husband and wife completed SSC are 32% less likely to have more than two children than those with at least one (husband, wife or both) are below SSC. Again families with both husband and wife completed HSC or above are 76% less likely to have more than two children than those with at least one (husband, wife or both) are below SSC. Muslim families are 1.53 times more likely to have more than two children than non-Muslim families. Working women are 54% less likely to have more than two children than non-working women. Families of unsecured in food are 1.38 times more likely to have more than two children than families of secured in food.
The variable fertility preference has greatest influence on having more than two children. So to keep family size small it is necessary to convert families with fertility preference “undecided” to “no more”. Public awareness should be raised about the fact that sex of children is no matter. From the expectation of male child, family size is being increased. Educated couple keeps their family size small. Thus education rate should be increased. People should be employed because working people keep family size small. Food security should be maintained for all families because to ensure food security people want more children with an expectation of increasing earning members of family.
To measure the prediction performance of the model we randomly divide the whole data set into two parts: training data and test data. The training data set contains of 75% and the test data set contains 25% of the whole data set. Using the 75% data we fit the model and calculate the misclassification error which is called training error. Again using the fitted model we predict the outcomes for the 25% data and calculate the misclassification error which is called test error. These errors are given in Table 3.
|
Misclassification error |
|
|
Training Error |
15.42% |
|
Test Error |
17.90% |
Table 3 Approximate misclassification error for training (75%) data and test (25%) data
Cluster correction is necessary for BDHS data since the data are collected under two stage stratified sampling. The prediction performance of the logistic regression model is quite reliable after cluster correction since the training and test errors are approximately 15.42 and 17.90 respectively. From our analysis we can conclude that to keep family size small the government should take necessary steps to raise the awareness of the people to have fertility preference “no more”, not to differentiate male and female child. Again government should take steps to increase the education rate of the people, to increase the employment rate and to ensure the food security of the people.
None.
Authors declare that there are no conflicts of interests.

©2015 Haque, et al. This is an open access article distributed under the terms of the, which permits unrestricted use, distribution, and build upon your work non-commercially.
2 7