Advances in
eISSN: 2572-8490


Research Article Volume 7 Issue 1
1Department of Biotechnology and Bioinformatics, California State University, USA
2Department of Biomedical Engineering, University of California Los Angeles, USA
Correspondence: Bill Tawil, Department of Bioengineering, UCLA School of Engineering, 420 Westwood Plaza, Room 5121, Engineering V. P.O. Box: 951600, Los Angeles, CA 90095-1600, USA
Received: January 01, 2021 | Published: January 20, 2021
Citation: Shaun R, Miguel G, Aragas M, et al. The impacts of radio exposure on healthy skin & muscle cells, and breast cancer cells. Adv Tissue Eng Regen Med Open Access. 2021;7(1):1-15. DOI: 10.15406/atroa.2021.07.00121
Significant concerns have been raised about the potential harmful impact of radio frequencies (RF) transmitted from these devices, especially with the excessive usage of mobile telecommunication systems. A faraday cage was constructed to house cell culture plates in between a radio transmitter and its receiver. Three different cell lines were cultured on 10μg/mL of collagen and fibronectin and exposed to RF using an 8-bit encrypted pulse signal at 433 MHz, 1.02 (Amps) for 3 hours to determine the cell proliferation effects. The results demonstrated that HFF-1 on fibronectin with RF exposure compared to no exposure significantly increased the proliferation rate by 1.55-folds on days 3 and 1.53-folds on day 7, respectively. HFF-1 on collagen with radio transmission compared to no transmission, the proliferation rate significantly increased on 2.34-folds on day 3 and 2.18-folds on day 7 respectively. In contrast, the SKBR3 on fibronectin with radio transmission compared to no transmission the proliferation rate significantly increased by 2.63-folds on day 3 and significantly decreased by 1.68-folds on day 7. Likewise, SKBR3 on collagen with radio transmission unveiled the proliferation rate significantly increased by 1.11-folds on day 3 and significantly decreased by 6.49-folds on day 7. Moreover, L6 on fibronectin with RF exposure compared to no exposure, the proliferation rate significantly decreased by 1.54-folds on day 7. L6 on collagen with radio transmission, revealed the proliferation rate significantly increased by 1.69-folds on day 3 and significantly decreased by 1.64-folds on day 7. In conclusion, radio transmission exposure significantly increases the proliferation rate of HFF-1 cell-lines and significantly decreases the cell proliferation of both the SKBR3 and L6 cell lines overall.
Keywords: HFF-1, human foreskin fibroblasts, proliferation, regeneration, human breast cancer, SkBr3, radio frequencies, radio radiation, cell phones, collagen, fibronectin
HFF-1, human foreskin fibroblasts; SKBR3, human breast cancer; ECM, extracellular matrix; PBS, phosphate buffer saline; Arduino, arduino mega 2560 Rev3; AM, amplitude modulation; FM, frequency modulation; MHz, megahertz; CAD, computer-aided design; FDM, fused deposition modeling; CL, collagen; FN, fibronectin; RF, radio frequency
The reliability in technology and electronic devices has vastly increased over the past 20 years and is incorporated into daily life. The rapidly growing usage of mobile phones has raised concerns worldwide about their harmful impacts on health. A person is constantly bombarded with a plethora of radio frequencies a day. Devices that are commonly found emit radio frequencies are TVs, radios, computers, smart phones, mobile phones, routers, Bluetooth, and Wi-Fi.1 As of February 7th, 2019, over 96% of U.S. adults owned a cell phone and 81% owned a smartphone .2 This is a drastic increase from 2011, when only 35% of adults reported owning a smartphone.2 An average user spends around 3 hours a day on their phone worldwide, while an American user spends around 6 hours.3 The World Health Organization (WHO) has recognized mobile phones as low-powered radio frequency (RF) transmitters, operating at frequencies between 450 and 27000 MHz.4 In addition, cell phones use different frequencies for radio, cellular, GPS, Bluetooth, and wireless-fidelity (Wi-Fi) signals. According to the global system of mobile communication (GSM), The most widely used frequency bands in the US are 900 MHz5 and 800 MHz to transmit data and phone calls.6 Modern smartphones use Wi-Fi at 2.4 and 5.0 GHz frequency range.7 Fibroblast is a cell type that synthesizes the extracellular matrix and collagen. This glycoprotein assists secrete the structure of animal tissues and engages an important role in wound healing.8,9 HFF-1 (Human Foreskin Fibroblasts) cells are used in biomedical research because they proliferate abundantly, maneuver with ease, and are inexpensive.10 Normal human skin cells contain at least three different subpopulations of fibroblasts.11 Skin cells are the first line of defense for fighting infections and protecting the body from the external environment. Radio frequencies not only come in contact with the skin but are capable of penetrating through the skin barrier with ease.12
SKBR3 cells are human breast cancer cells that overexpressed the HER2 gene13 and derived from the pleural effusion with malignant adenocarcinoma. The World Cancer Report indicates that the cancer rate may increase by 50%, accumulating to 15 million new cases, by the year 2020. A few reports have articulated that continuous exposure to high MHz frequency for 2 to 27 hours prompts an increase in cell proliferation.13 L6 are myoblast cells derived from the rat skeletal muscle tissue.14 L6 muscle cells are a major structural support and generate the cellular product of myosin.15 L6 cells combine in culture to crest striated muscle fibers and multinucleated myotubes.16 Muscle cells are found in muscle tissues and characterized as long fibers. L6 cells were selected for the skeletal muscle fibers underneath an individual’s skin. Taking this into consideration, radio transmission was exposed to HFF-1, SKBR3 and L6 cell lines to project the effects that might occur to the human body. To accomplish this, a radio transmitter was optimized to recreate the non-ionizing radiation conditions for cell exposure. Interferences were controlled using a faraday cage. HFF-1 Cells show a significant increase in cell proliferation while SKBR3 and L6 cells show a significant decrease in cell proliferation over a period of 7 days.
HFF-1, SKBR3, and L6 cells (ATCC, Manassas, VA, USA) were prepared separately in a T75 flasks (Thermo ScientificTM, Waltham, MA, USA) with their appropriate media solution (HFF-1 media, SKBR3 media, and L6 media). Each flask was stored in an incubator (Thermo ScientificTM, Waltham, MA, USA) at 37°C and set to 5% CO2. After confirmation of appropriate confluency via phase contrast microscope CKX41 (Olympus, Shinjuku, Tokyo, Japan), the old media was aspirated out of the flask and rinsed twice with 5 mL phosphate buffer saline (PBS) (GE Healthcare, Chicago, IL, USA). The PBS was removed, and 5 mL of 0.25% trypsin (GE Healthcare, Chicago, IL, USA) was dispensed into the flask. The flask was then left to incubate for 10 minutes at room temperature. The flask was then inspected under the same contrast microscope to ensure the detachment of the integrins from the cells to the flask. 5mL of either HFF- 1, SKBR3, or L6 media was dispensed to the respective flask to neutralize the trypsin activity. The total serum contents of the flask were transferred into a 15mL conical tube (Fisherbrand, Waltham, MA, USA) and centrifuged (Eppendorf AG, Hamburg, Germany) spinning at 200 RCF for 5 minutes. The falcon tubes were then visually inspected to ensure that a pellet was formed at the bottom of the tube. The supernatant was then discarded from the tube leaving behind the pellet in the tube. The pellet was then resuspended in 1mL of each cells respective media and properly mixed by 10 repeats of aspirating and dispensing. 20μL of the media mix was then placed into two sides of a Cellometer cell counting chamber slide (Nexcelom Bioscience, Lawrence, MA, USA). A Cellometer Auto T4 (Nexcelom Bioscience, Lawrence, MA, USA) was used to measure the cell density and calculate the average live cell concentration.
HFF-1, SKBR3 & L6 cell proliferation
Prior to cell seeding, the 48-well plates were rinsed twice using 500μL of PBS in each well and vacuumed. 6 x 48-well plates coated with Collagen and Fibronectin at concentrations of 10μg/mL were rinsed with PBS. For integrin binding, the cells were coated on different substrates for all the cell lines. An intermediate stock solution for each cell type was created in a 50mL conical tube to ensure a concentration of 5,000 cells per well when dispensing 500μL. Then 500μL of each respective cell was dispensed into the designated location. 3 plates for day 1, day 3, and day 7 were then placed into the faraday cage, while 3 other plates for day 1, day 3, and day 7 were wrapped in aluminum foil and placed at least 15 feet away from the faraday cage. The radio frequencies were then turned on allowing the plate to incubate for 3 hours in direct contact at room temperature. The plates were then incubated at 37°C, 5 % CO2. HFF-1, SKBR3, and L6 cells were analyzed by fluorescent staining using calcein to measure the rate of cell proliferation compared to the initial adhesion. On day 1 after one hour of incubation, one radio exposed plate and one plate with no exposure were removed from the incubator. Each plate had its media removed and was rinsed with 0.5mL PBS. A calcein solution consisting of a ratio of 10µL of calcein-AM (Sigma-Aldrich®️, St. Louis, MO, USA) and 5mL PBS was prepared and added to each well. The plates were then incubated for 20 minutes in a dark incubation drawer before being read by the Filtermax F5 Microplate Reader (Molecular Devices, San Jose, CA, USA). Data and graphs were calculated and created using Microsoft Excel. Fluorescent images were captured under a fluorescent microscope 1X71 with a Cy3 filter (Olympus®️, Shinjuku, Tokyo, Japan) at 100x magnification. The exact same procedure was used on days 3 and 7 plates to measure live cell concentrations and analyzed by the same method.
Faraday cage CAD design
The CAD design of the faraday cage was created using Fusion 360 (Autodesk Inc, San Rafael, CA, USA), (Figure 1A). The Cage was then spliced using Cura (Ultimaker, Geldermalsen, Netherlands) and converted to G-code. The G-Code was then uploaded to a heavily modified 3D printer with print capabilities of 1-micron layer resolutions, and a heated auto leveling bed. The printer used 1.75 mm PLA filament with 0.2 mm extruder nozzle heated to 205 °C with a layer resolution of 1-micron and a bed heated to 60 °C. The interior dimensions of the first cage were 130 mm x 85 mm x 150 mm to accompany four 48-well plates. The exterior dimensions of the first cage were 145 mm x 100 mm x 150 mm to give the plates a 10 mm thick solid surface between the exterior of the cage and the interior, (Figure 1B). The first cage was then enclosed by a second cage with demission 180 mm x 140 mm x 160 mm. Both cages were then wrapped in 8-layer thick heavy-duty aluminum foil and tested for conductance to ensure electrons were traveling between each sheet layer, (Figure 2A & 2C).
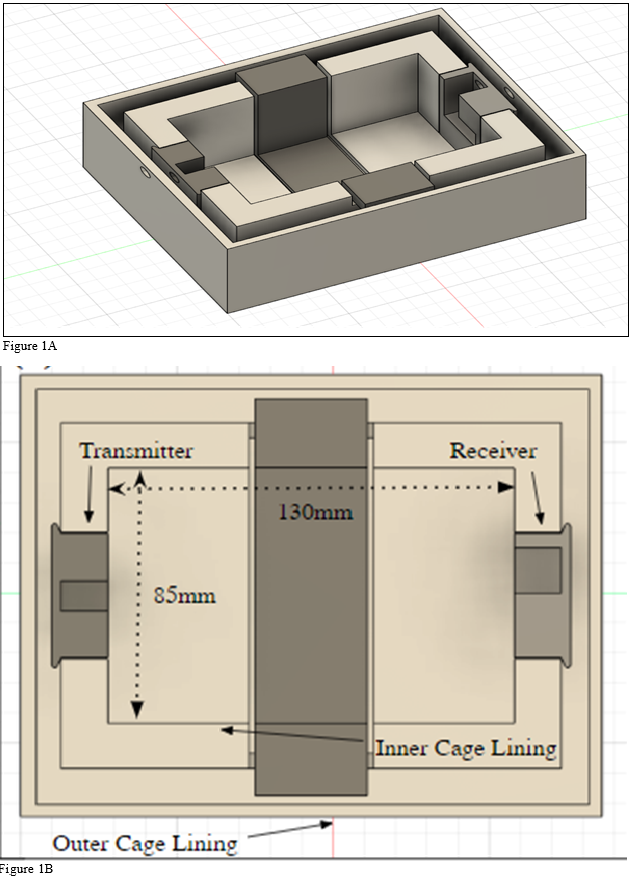
Figure 1A & 1B Enhanced 3D FDM designed Faraday Cage with PLA material: The outline arranges the specifications and blueprints for the cage design (A). The cage dimensions are depicted with the interior and exterior design and measurements (B). (A) The specifications of the cage model enhance the signal insulation from the exterior environment and the interior reflects the signal at every angle to blast the cells. (B) The specifications of the cage model enhance the signal insulation from the exterior environment and the interior reflects the signal at every angle to blast the cells.
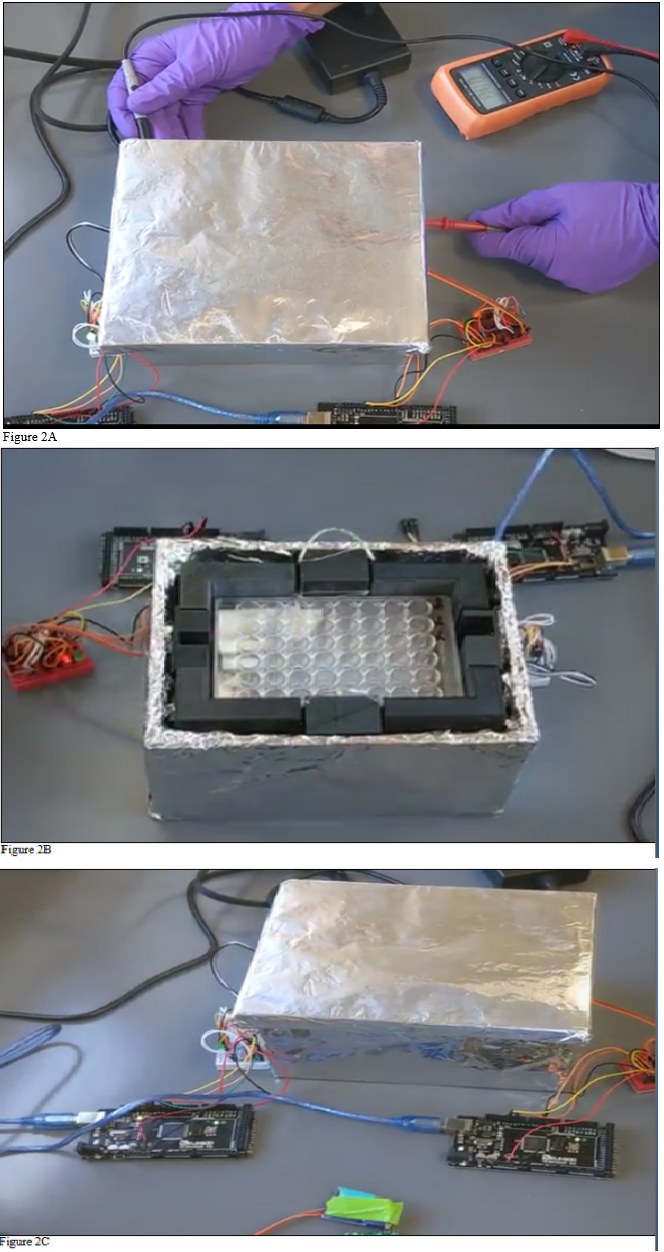
Figure 2A & 2B & 2C Faraday Cage Model and configuration. The cells were grown in a 48-well culture plate and contained in a Faraday cage (A). The cage was connected to the radio transmitter components, the transmitter and receiver (B). The cage was examined for conductance to ensure the absorbed signal frequencies (C). (A) The secondary cage model utilized heavy duty aluminum foil and shield with electrically conductive tape. (B) Exhibits the orientation of the cage set up and the components of the radio transmitter integrated. (C) The multi meter detected the oscillating conductance of the exterior of the cage.
Radio transmitter and receiver settings
An Arduino Mega 2560 Rev3 (Arduino, Scarmagno, Italy) was wired to a radio frequency transmitter (DAOKI, Meghalaya, India) and a radio frequency receiver (DAOKI, Meghalaya, India) through a NOR bridge voltage gate followed by a 330 ohm resistor. The data line was pinned to the data 8 port of the Arduino while the ground and 5V power was pinned to their respective locations on the Arduino. The radio frequency was tuned using Arduino’s Ide software (Arduino, 1.8.10., Windows 10 64-bit) to control the voltage of the SAW oscillator on the transmitter as well as cutting the length of the antennae to 17.3cm. A second Arduino was wired and utilized to dictate the receiver in the same configuration except the data line was pinned into data port 9 and 10. Using the Arduino Software, Fine tuning of the transmitter was achieved by changing the voltage which changed the oscillators clock speed to match the desired frequency. The desired frequency was then verified with the receiver unit. To corroborate that only the signal of the transmitter was being detected by the receiver, a software logic gate was coded using an 8-bit encryption which would block out all other frequencies detected by the receiver. The software was programmed to send a timestamp of when the signal was sent followed by the message “Shaun was here.” The receiver was then programmed to retrieve the message, record the received frequency (Hz), record the received time(s), and record the strength of the signal (mA).
Aluminum skin depth experiment and validation
To negate the incoming radio signals, heavy duty aluminum foil was utilized for its thicker skin depth compared to conventional aluminum foil, (Figure 3A & 3B). A roll of heavy-duty aluminum foil (Reynolds, Lake Forest, Ill, USA) was sliced into 12 in x 12 in sheets. A Samsung Galaxy Note 8 was used (Samsung, Seoul, South Korea) for its ability to transmit and receive AM, FM, Cellular, Mobile, and Wi-Fi Data. The device was set to receive AM frequencies tuned to 670 kHz and broadcast the signal over the loudspeaker. The device was then covered with subsequent sheets of foil until the speaker did not broadcast any noise. The same procedure was used to determine the FM signal degradation except the Samsung was tuned to 104.7 MHz to determine cellular transmission, the phone number was dial using another phone to determine if the Samsung would ring. If the device rang, then another sheet of foil was added. To test mobile data the Samsung was set to stream a song over mobile data connection. The phone was programmed to dump the cache so that any downloaded information would not be placed onto the phone’s local storage. This ensured that the device would have to use mobile data to retrieve the information. To test Wi-Fi a speed test was run to determine the upload and download speeds. Each test was repeated 9 times to ensure accuracy.
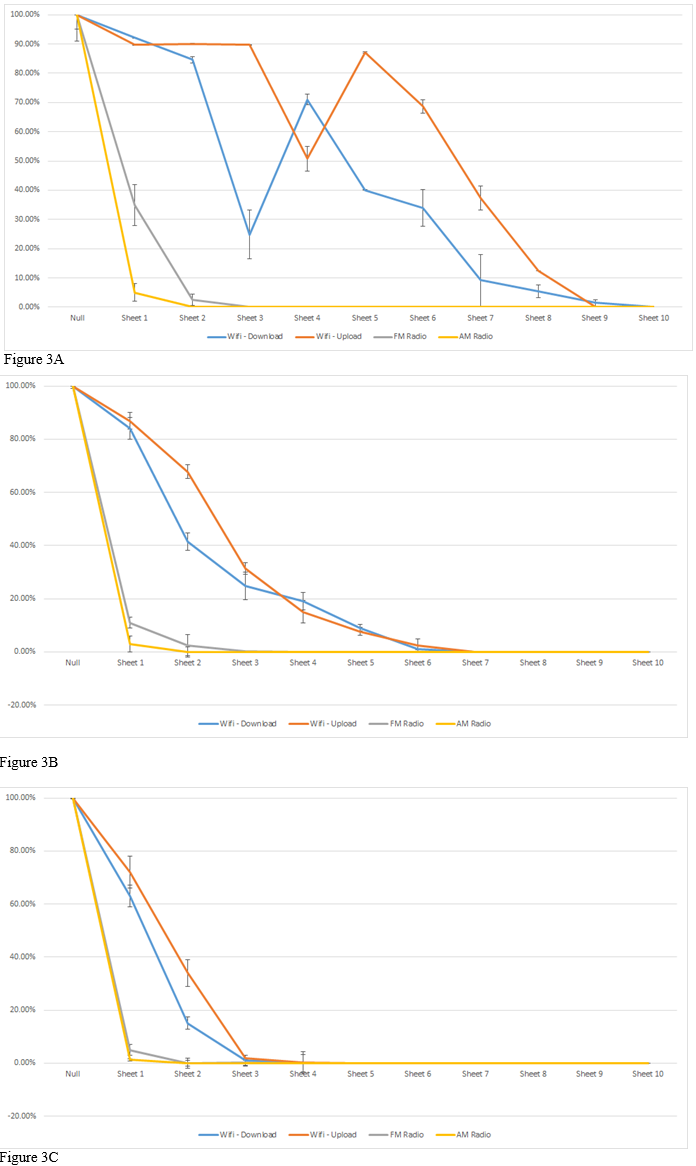
Figure 3A & 3B & 3C Regular Aluminum Foil for signal isolation (A). Heavy Duty Aluminum Foil for Signal Isolation (B). Electrical conductor tape and heavy-duty aluminum foil for signal isolation (C). (A) Regular aluminum foil was measured for signal loss of AM, FM, Wi-Fi upload and download against the number of aluminum foil sheets used. (B) Heavy duty aluminum foil has twice the thickness per sheet in contrast to regular aluminum foil. (C) This verified that the radio wave signal was isolated and optimized to meet the desired parameters. The electrically conductive tape with regular aluminum foil fully insulated the signal.
Radio signal transmitter and receiver verification
The average signal length was determined by measuring the amount of time it took for each signal to start and stop transmission to the receiver for over a period of 240 seconds. To ensure that the frequency received was only sent by the transmitter a software logic gate 8-bit encryption was used. The average frequency of the transmission was found by recording the frequency signal received by the receiver for the 1 seconds of transmission. In order to help isolate interfering frequencies from this experiment a faraday cage was used to shield from outside signals. The receiver was set inside of the faraday cage while the transmitter was placed outside of the cage, (Figure 2B). The receiver did not detect any incoming transmission. This was tested again for known FM (87.8-108 MHz) and AM (535-1605 kHz) radio US radio signals as well as 2.4 GHz Wi-Fi (2401 – 2495 MHz) and 5.0 Wi-Fi (5180-5824 MHz). All these tests resulted in transmission being received.
Statistical analysis
The statistical analysis on the data was presented with the mean ± standard deviation (SD). A Two Paired Student T-Test was used between the study groups to determine the statistical significance of the observed differences on excel. A p-value of < 0.05 is considered statistically significant.
We needed to validate the radio exposure frequency to ensure that the transmitter was in the desired specifications. This was achieved by extrapolating 100 iterations of radio signal transmitted to define the average trend line of the data. The radio 8-bit encrypted signal discharged was averaged out to 1.169 seconds and frequency to 432.919 MHz respectively, (Figure 4A). The average frequency was determined by adding all the frequencies together and dividing by the total iterations which was 240. The gap in signal time was then calculated by taking the difference between the signal stopping and the signal starting in a similar manner to average signal length. This message was received every half a second by the receiver followed by a timestamp, signal strength in dBm, and current frequency. This attained an average frequency of 433.032MHz with a maximum of 432.052 and a minimum of 433.050, (Figure 4B). The maximum length for the signal was 1.183 seconds and the minimum signal length was 1.154 seconds. The average signal gap was calculated to be 0.477 seconds with a maximum value of 0.543 and minimum value of 0.456 seconds. From the data, it was determined that the radio frequency was within the desired specifications. A few minor iterations that spiked resulted from discharge lag time by 0.2 milliseconds that occurred from 15 to 30 minutes. Figure 4A depicts a graphical representation of the average signal length vs the seconds received. This demonstrates that the signal discharge was consistent.
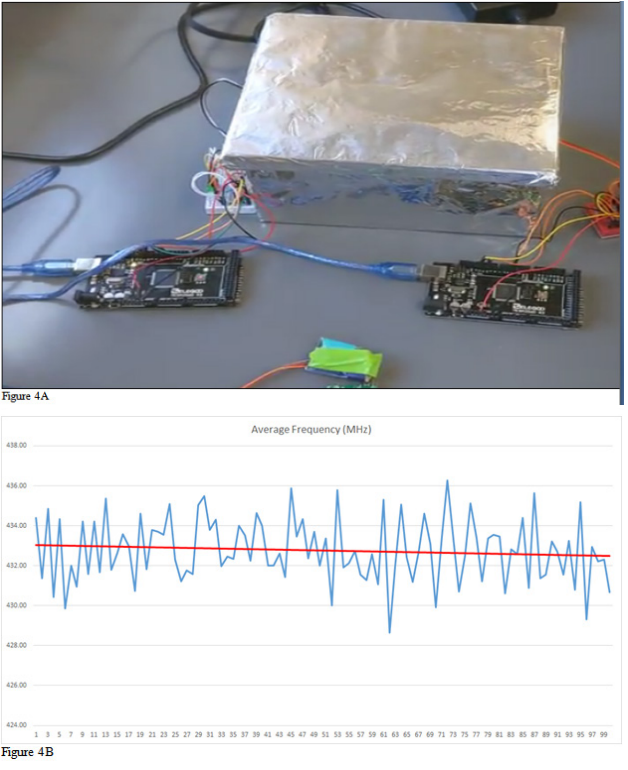
Figure 4A& 4B Radio Signal Discharge (A). Average Radio Frequency determined to be 432.919 MHz (B). (A) This was derived over 100 iterations, extrapolated from 55,539 data points each 3 hours. The iteration that spiked is due to the lagging with was 0.2 milliseconds that occurs from 15 to 30 minutes. (B) This demonstrates that the encrypted 8-bit signal exposure was consistent averaging out to 433 MHz This iteration is taken 4 times, the 15 data points each 15 seconds.
HFF-1 cells grow better on collagen than fibronectin
We needed to determine the preferred matrix coating for our HFF-1 cell line. We tested collagen and fibronectin at 5μg/mL or 10μg/mL, respectively. The initial adhesion of the HFF-1 cell’s ligands adhered to the collagen and fibronectin at 5μg/mL or 10μg/mL were compared against each other at day 1, (Figure 5A). The initial adhesion percent was determined by averaging the initial cell count after one hour of incubation with radio exposure. Figure 5B3 shows the cell proliferation rates across 7 days of incubation. The cell count was recorded at day 3 and at day 7. These values were then normalized with respect to their day 1 values. HFF-1 on 10μg/mL of collagen (122%) showed the greatest average initial adhesion with 5μg/mL of collagen at (120%). Following close behind fibronectin at 5μg/mL had the lowest initial adhesion value (100%) followed by fibronectin at 10μg/mL (108%). There was no significant difference determined between these results with many of the standard deviation bars reaching towards other ligands values. The ligand with the greatest cell proliferation after 3 day of incubation was collagen at 5μg/mL (423%) and the least was found on fibronectin at 5μg/mL (239%). On day 7 on incubation, the cells that were growing on fibrinogen coated plated had proliferated at a greater overall proliferation rate compared to the collagen coated plates. Fibronectin at 10μg/mL (802%) had the highest cell proliferation rate and collagen at 10μg/mL (691%) had the lowest cell proliferation rate. Figure 5B shows the cells with each of their respective ligands. This confirms that the cells are present at day one as well as their relative abundance related to each other. The day 1 initial adhesion cells appear to be more globular with collagen forming more clusters of cells while fibronectin has cells in individual groups. The day 3 and day 7 images clearly illustrate the cells dividing and stretching over the entire surface area of the well. The HFF cell line is suggested to have a preference collagen matrix-coating over fibronectin. cells with no RF exposure showed the greatest initial adhesion coated on fibronectin at 5μg/mL (287 %). For cells exposed to radio signals coated on 10 μg/mL of collagen showed the greatest initial adhesion at (600 %). Cell proliferation across the 7 days indicates cells with collagen at 5μg/mL proliferated at the greatest rate for day 3 (504 %) and fibronectin at 10μg/mL for day 7 (482 %) (Figure 6B). Cell proliferation for cells exposed to radio signals demonstrates that collagen at 5μg/mL proliferated at a greater rate for both day 3 (2,684 %) and day 7 (2,593 %).
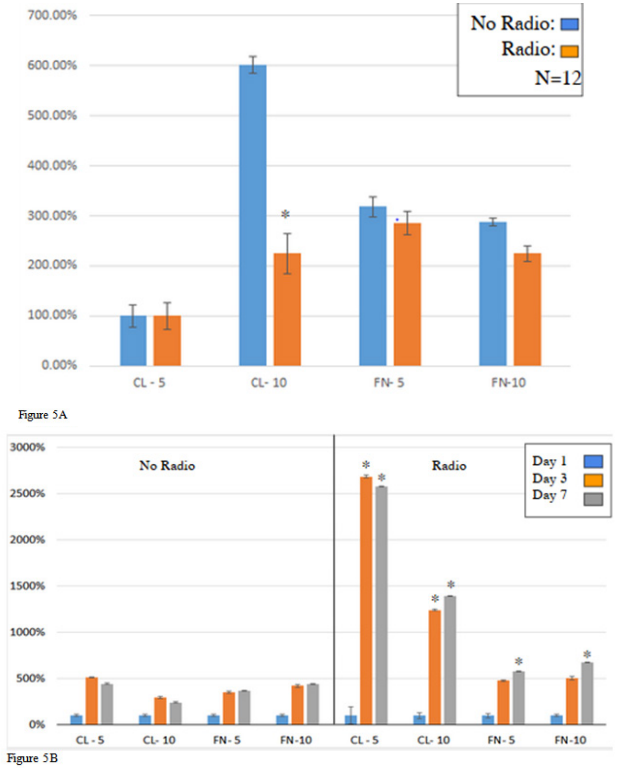
Figure 5A & 5B Initial HFF-1 Cell Adhesion (A) & Cell Proliferation (B). (A) The p-value is less than 0.005 compared to day 1 for cell adhesion on a 24 well tissue plate. (B) In cell proliferation, the p-value is less than 0.005 compared to no radio transmission on a 24-well tissue plate.
Radio frequency exposure increases healthy fibroblast (HFF-1 cell) proliferation
We looked at initial adhesion, cell proliferation, and fluorescent cell imaging for HFF-1 cells exposed and not exposed to radio frequencies. Initial adhesion was examined to determine if there were any significant differences between seeding the cells after 1 hour of incubation. 7-day cell proliferation was examined to determine any statistical difference between proliferation rates of the HFF-1 cell line within the different cell coatings. 7-day cell proliferation was also used to determine the significant difference between the proliferation rates of cells exposed to radio frequencies and cells not exposed to radio frequencies. Fluorescent imaging was examined to ensure cell identification, viability, morphology. Figure 6A shows the initial adhesion of HFF-1 cells with radio exposure on different cell coating. For HFF-1 cells growing on fibronectin at 10μg/mL, cells exposed to radio frequencies showed a significant increase in initial adhesion by 130% compared to no radio exposure. For HFF-1 cells growing on collagen at 10μg/mL, cells exposed to radio frequencies showed an increase in initial adhesion by 114 % compared to no radio exposure. Figure 6B demonstrates the HFF-1 cell proliferation rate over the course of 7 days with and without RF exposure. HFF-1 cells coated on fibronectin at 10μg/mL without RF exposure showed a 399.6 % increase in proliferation for day 3 and a 350.8 % increase for day 7 compared to day 1. HFF-1 cells coated on collagen at 10 μg/mL without RF exposure showed a 348.7 % increase in proliferation for day 3 and a 315.7 % increase for day 7 compared to day 1. HFF-1 cells coated on fibronectin at 10μg/mL with RF exposure showed a 618.1 % increase in proliferation for day 3 and a 535.5 % increase for day 7 compared to day 1. HFF-1 cells coated on collagen at 10μg/mL with RF exposure showed an 815.8 % increase in proliferation for day 3 and a 688.0 % increase for day 7 compared to day 1. The fluorescent imaging showed an increase in the cell count over the 7 days and morphology change from globular form to an elongated form. It showed no significant difference in identification and viability. There is a significant increase in the initial adhesion of HFF-1 cells exposed to RF compared to no exposure. HFF-1 cells exposed to RF shows an overall increase in proliferation rates compared to no RF. HFF-1 cells grown on fibronectin saw a 1.55-fold increase on day 3 and a 1.53-fold increase on day 7 compared to no RF. Furthermore, HFF-1 cells grown on collagen saw a 2.34-fold increase on day 3 and a 2.18-fold increase on day 7 compared to no RF.
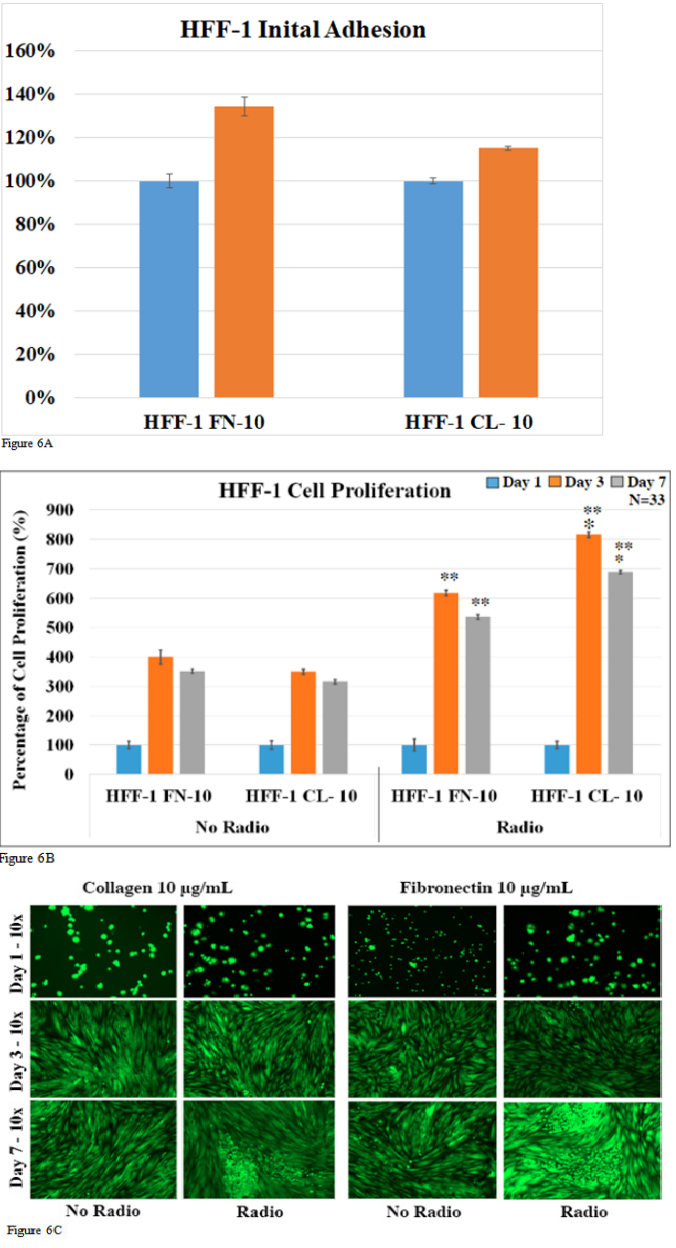
Figure 6A & 6B & 6C Human Foreskin Fibroblast HFF-1 with no radio and radio exposure initial adhesion (A). Human Foreskin Fibroblast HFF-1 cell proliferation with no radio in contrast to radio transmission detected on days 1, 3 and 7 respectively (B). Human Foreskin Fibroblast HFF-1 extracellular matrix with coating illustrated is for cell morphology with no radio in contrast to radio transmission detected on days 1, 3 and 7 respectively(C). (A) Based on 33 observations, there was a significant difference between radios in contrast to no radio exposure on fibronectin 10 on a 48-well tissue plate. The asterisks (*) indicate that the p-value is less than 0.005 compared to the normalized fibronectin 10 µg/mL coat. (B) For cell proliferation on a 48-well tissue plate, there was a significant difference determined for radio exposure both on collagen and fibronectin detected on day 3 & 7. (*) = P<0.005 to fibronectin 10 µg/mL coat and (**) = P<0.005 compared to no radio transmission. (C) The HFF-1 cell morphology is illustrated at a 100X magnification and contrasts the extracellular matrix coated.
Radio frequency exposure decreases healthy muscle cell (L6) proliferation
We looked at initial adhesion, cell proliferation, and fluorescent cell imaging for L6 cells exposed and not exposed to radio frequencies. Initial adhesion was examined to determine if there were any significant differences between seeding the cells after 1 hour of incubation. 7-day cell proliferation was examined to determine any statistical difference between proliferation rates of the L6 cell line within the different cell coatings. 7-day cell proliferation was also used to determine the significant difference between the proliferation rates of cells exposed to radio frequencies and cells not exposed to radio frequencies. Fluorescent imaging was examined to ensure cell identification, viability, morphology. Figure 7A shows the initial adhesion of L6 cells with radio exposure on different cell coating. For L6 cells growing on fibronectin at 10μg/mL, cells exposed to radio frequencies showed an increase in initial adhesion by 102.8% compared to no radio exposure. For L6 cells growing on collagen at 10μg/mL, cells exposed to radio frequencies showed an increase in initial adhesion by 114% compared to no radio exposure. Figure 7B demonstrates the L6 cell proliferation rate over the course of 7 days with and without RF exposure. L6 cells coated on fibronectin at 10μg/mL without RF exposure showed a 1354 % increase in proliferation for day 3 and a 2,507 % increase for day 7 compared to day 1. L6 cells coated on collagen at 10μg/mL without RF exposure showed a 1,301 % increase in proliferation for day 3 and a 3,255% increase for day 7 compared to day 1. L6 cells coated on fibronectin at 10μg/mL with RF exposure showed a 1,179 % increase in proliferation for day 3 and a 1,626 % increase for day 7 compared to day 1. L6 cells coated on collagen at 10μg/mL with RF exposure showed a 1,875 % increase in proliferation for day 3 and a 1,991 % increase for day 7 compared to day 1. The fluorescent imaging showed an increase in the cell count over the 7 days and morphology change from globular form to an elongated form. This shows no significant difference in identification and viability. There is a significant increase in the initial adhesion of L6 cells exposed to RF compared to no exposure. L6 cells exposed to RF observe an overall decrease in proliferation rates compared to no RF over the 7 days. L6 cells grown on fibronectin saw a 1.15-fold decrease on day 3 and a 1.54-fold decrease on day 7 compared to no RF. Furthermore, L6 cells grown on collagen observe a 1.69-fold increase on day 3 and a 1.64-fold decrease on day 7 compared to no RF.

Figure 7 A: Rat Skeletal Muscle with no radio and radio exposure on glycoprotein coating. Initial Cell Adhesion detected on days 1, 3, and 7 (A). Rat Skeletal Muscle with no radio and radio exposure on glycoprotein coating. Initial Cell proliferation detected on days 1, 3, and 7 (B). Rat Skeletal Muscle with no radio and radio exposure on glycoprotein coating. extracellular matrix coating for visualizing cell morphology after calcian AM treatment detected on days 1, 3, and 7 (C). (A) The number of observations for cell adhesion and proliferation is 12 denoted by N. There is no significant difference determined for initial cell adhesion measures after 3 hours of exposure. (B) The number of observations for cell adhesion and proliferation is 12 denoted by N. For cell proliferation, there is only a significant difference quantified for radio exposure on collagen on day 3. On day 7, no radio exposure had a significant increase in collagen and radio exposure on both collagen and fibronectin. (*) = P-value < 0.005 compared to 10 µg/mL of fibronectin and (**) = P<0.005 compared to no radio transmission on 12 observations. (C) The number of observations for cell adhesion and proliferation is 12 denoted by N. The cell morphology of the L6 cells is depicted in the illustration above depicts the growth of the cells and the shape of the structure after calcian AM treatment with no radio and radio exposure. The digital images were captured at 100x magnification for all the images.
Radio frequency exposure decreases breast cancer cells (SKBR3) proliferation
We looked at initial adhesion, cell proliferation, and fluorescent cell imaging for SKBR3 cells exposed and not exposed to radio frequencies. Initial adhesion was examined to determine if there were any significant differences between seeding the cells after 1 hour of incubation. 7-day cell proliferation was examined to determine any statistical difference between proliferation rates of the SKBR3 cell line within the different cell coatings. 7-day cell proliferation was also used to determine the significant difference between the proliferation rates of cells exposed to radio frequencies and cells not exposed to radio frequencies. Fluorescent imaging was examined to ensure cell identification, viability, morphology. Figure 8A shows the initial adhesion of SKBR3 cells with radio exposure on different cell coatings. For SKBR3 cells grown on fibronectin at 10μg/mL, cells exposed to radio frequencies showed an increase in initial adhesion by 110.1% compared to no radio exposure. Conversely SKBR3 cells grown on collagen at 10μg/mL, cells exposed to radio frequencies showed a decrease in initial adhesion by 110.9 % compared to no radio exposure. Figure 8B demonstrates the SKBR3 cell proliferation rate over the course of 7 days with and without RF exposure. SKBR3 cells coated on fibronectin at 10μg/mL without RF exposure showed a 220.2% increase in proliferation for day 3 and a 2,311.4 % increase for day 7 compared to day 1. SKBR3 cells coated on collagen at 10 μg/mL without RF exposure showed a 273.3 % increase in proliferation for day 3 and a 4,433.0 % increase for day 7 compared to day 1. SKBR3 cells coated on fibronectin at 10μg/mL with RF exposure showed a 579.6 % increase in proliferation for day 3 and a 1374.9 % increase for day 7 compared to day 1. SKBR3 cells coated on collagen at 10μg/mL with RF exposure showed a 304.3 % increase in proliferation for day 3 and a 682.6 % increase for day 7 compared to day 1. The fluorescent imaging visualized an increase in the cell count over the 7 days and morphology change from globular form to an elongated form. This demonstrated that there was no significant difference in identification and viability. There is a significant increase in the initial adhesion of SKBR3 cells exposed to RF compared to no exposure. SKBR3 cells exposed to RF demonstrated an overall decrease in proliferation rates compared to no RF over 7 days. SKBR3 cells grown on fibronectin observed a 2.63-fold increase on day 3 and a 1.68-fold decrease on day 7 compared to no RF. Furthermore, SKBR3 cells grown on collagen observe a 1.11-fold increase on day 3 and a 6.49-fold decrease on day 7 compared to no RF.
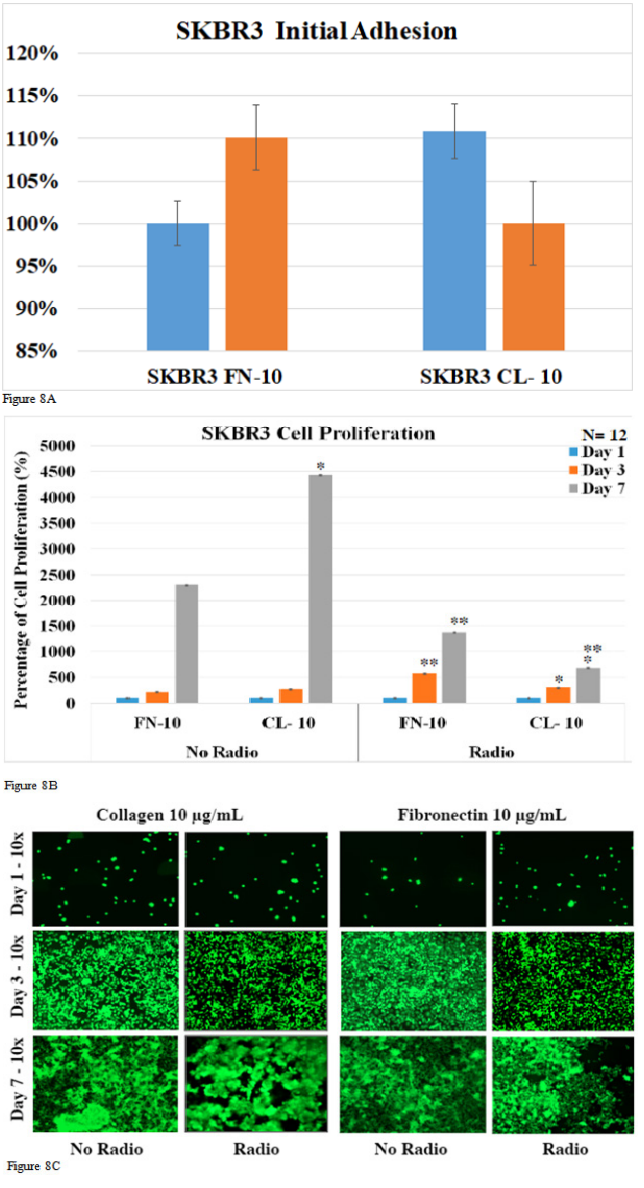
Figure 8 A: Human Breast Cancer (SKBR3) with no radio exposure and radio exposure with matrix coating. Initial Cell Adhesion on day 1, 3 and 7 respectively (A). Human Breast Cancer (SKBR3) with no radio exposure and radio exposure with matrix coating cell proliferation on day 1, 3 and 7 respectively (B). Human Breast Cancer (SKBR3) with no radio exposure and radio exposure with matrix coating extracellular matrix coated for cell morphology visualized on day 1, 3 and 7 respectively (C). (A) In initial SKBR3 cell adhesion, there was no statistical difference determined quantifying the p-value is less than 0.05 compared to no radio transmission. (B) The (*) = p-value is less than 0.05 compared to 10 µg/mL of fibronectin and (**) = P<0.005 compared to no radio transmission in SKBR3, cell proliferation. (C) SKBR3 was stained with calcian-AM treatment. The digital images were captured with a magnification set at 100X.
The data suggests that radio transmission exposure impact overall increases the cell proliferation of HFF-1 (Human foreskin fibroblast) and decreases the cell proliferation rate on L6 (Rat skeletal muscle), and SKBR3 (Human breast cancer) cells after 7 days. The aspiration of the research is to determine the impact of radio exposure on the proliferation of HFF-1, SKBR3, and L6 cell lines. The Human body is constantly exposed with radio frequency. Cellular devices, wireless electronic devices, and even some medical devices emit some form of radio frequencies. Prior information suggests that all non-ionizing frequencies are safe for human use. There are radio frequencies that have the potential to cause harm to the human body. Our study indicates that there is an impact on the proliferation rates which can lead to harmful side effects. In the future, we aim to assess these three cell lines using a FACS analysis to determine if the integrin expression levels are changing due to the change in proliferation rate in the cell cycle and any DNA damage. Additionally, we aspire to alter the frequency of our experiment to observe if there are any differences in the results. Specifically, how do these three different cell lines compare when exposed to the commonly used 900 MHz, 2.4GHz, 5.0 GHz, and 28 GHz frequencies. 900MHz is the frequency range for the modern smartphone LTE or mobile data plans. 2.4 and 5.0 GHZ are used for WIFI and Bluetooth communications between devices. 28 GHz is currently implemented for modern 5G communication using millimeter wavelength technology (mmWave). Furthermore, we strive to compare the difference between healthy epithelial breast cells and breast cancer cells under these conditions. Does 433 MHz significantly decrease the proliferation rate for breast cancer only or does it affect healthy breast cells? If the latter, then this technology might be a useful tool in therapeutics to combat breast cancer. Lastly, we aim to further evaluate the effects of radio transmission by observing the effects on a 3D environment in a fibrin hydrogel. Our experiment shows that the 433MHz frequencies affect the proliferation rate on a 2D environment, but are the effects the same on a 3-D environment? Also, do cells exposed to this RF increase the rate at which the hydrogel is dissociated? Using an Instron we can measure the force in Newtons and measure the Young's Modulus results for hydrogels with and without RF exposure. Needless to say, there is more research that needs to be done on the effects of radio exposure on cell lines.16–36
California State University Channel Islands: Extended University Department of Biotechnology & Bioinformatics, Biomedical Engineering Emphasis. One University Drive, Camarillo, California 93012.
There are no conflicts of interest presented or declared by the authors in this research.
The authors would like to thank Melissa McCoy supporting the research at California State University, Channel Islands.

©2021 Shaun, et al. This is an open access article distributed under the terms of the, which permits unrestricted use, distribution, and build upon your work non-commercially.