Advances in
eISSN: 2572-8490


Research Article Volume 5 Issue 1
1Biotechnology & Bioinformatics Master’s Program, California State University, USA
2Department of Bioengineering, UCLA School of Engineering, California, USA
Correspondence: Bill Tawil, Ph.D, 420 Westwood Plaza, Room 5121, Engineering VPO Box 951600 Los Angeles, CA 90095–1600, USA
Received: January 05, 2019 | Published: February 15, 2019
Citation: Atherton K, Kyle E, Brianna B, et al. The effect of Matrigel concentrations and Cannabidiol on metastatic breast cancer cells and noncancerous fibroblasts. Adv Tissue Eng Regen Med Open Access. 2019;5(1):24-38. DOI: 10.15406/atroa.2019.05.00095
The endocannabinoid system shows applicability as a potential therapeutic agent. Anti–proliferative studies have shown minimal affinity on non–cancerous cell lines. The relative antitumor effects are due to the inhibition of tumor growth, via cell–cycle arrest/apoptosis, reducing neovascularization and metastases. The purpose of this study involves the investigation of the effects of cannabidiol (CBD), the non–psychoactive component of cannabis, on the proliferative behavior of SK–BR–3 breast cancer cell lines overexpressing HER2 and a normal cell line, human foreskin fibroblasts (HFF–1). Matrigel concentrations were first optimized showing no background data that may influence in cell morphology, initial adhesion or cellular proliferation in the preceding tests with CBD constructs. It is demonstrated that the introduction of 20pM CBD, decreases the proliferation and confluency of SK–BR–3 cells by day 7, but minimally affects the proliferation of HFF–1 cells in both 2D and 3D environments. CBD infused bead constructs gave preliminary insight in the use of biodegradable extracellular matrix used as vectors. Our results conclude that CBD interferes with the normal proliferation and of SK–BR–3 cells when in direct contact but does not significantly manipulate the proliferation of HFF–1 cells.
Keywords: breast cancer, cannabidiol, collagen, proliferation, cellular morphology, extracellular matrix, integrins, cellular behavior, sloan kettering breast cancer cells–3, human foreskin fibroblasts, matrigel, 3d matrix, 2d environment
Breast cancer is the leading cause of cancer–related deaths and the most common cancer in women worldwide.1 In 2018, there were 266,000 new invasive cases and 64,000 new cases of non–invasive breast cancer, that are expected to be diagnosed in women within the United States.2–4 While there are complex factors, BRCA1 and BRCA2 gene mutations reveal an increase incidence of breast cancer.5–7 The oncogene located on chromosome 17q12, HER2 receptor, is a transmembrane tyrosine kinase, that when activated, plays a role in cellular proliferation and survival.8,9 There are multiple screening options and treatments available for patients diagnosed.10–16 Amongst these options, targeted therapy uses drugs and other substances to inhibit cancer growth by interfering specific molecules.17 With the national cost of breast cancer estimated to increase by 32% by 2020, cost efficient health care options should be explored to ameliorate financial burden.18–20
The endocannabinoid system consists of receptors and their endogenous ligands that may be utilized as targets to treat various diseases. (21–22) Δ9–THC, natural and synthetic cannabinoid agonists, and endocannabinoids reveal promising anticancer properties in vitro. (23) Cannabis is composed of the infamous bioactive molecules: Δ9–THC, cannabidiol (CBD) and cannabinol (CBN).24,25 Cannabinoids are part of the active compounds in the Cannabis sativa plant. CBD is a member of the cannabinoid family, shows no psychotropic activity, and has been shown to induce cell death in cancer cell lines by targeting CB1 and CB2 receptors.26–30 2–dimensional assays for cell biology research are cost effective yet met with limitations.31 3–Dimensional (3D) culture systems however, can provide an accurate representation in vivo, by creating micro–environments.32 Porosity, rigidity, thickness, and cell concentration are all important features for consideration, possibly influencing gene expression and cellular behavior.33,34
To test the effects of CBD on breast cancer, a breast cancer cell line, SK–BR–3 and a normal human cell line, HFF–1 cell lines were used, establishing baselines using Corning Matrigel, comparing between 2D and 3D environments. CBD was then tested on cell lines in MG to study the effects that have been reported in other research. CBD was also placed in collagen beads to determine the effects of CBD exposure on cancer cellular proliferation.
Cell Line Maintenance and Reagents
Normal human foreskin fibroblasts (HFF–1) from ATCC (Manassas, VA) were cultured in Dulbecco’s Modified Eagle’s Medium (DMEM) (Hyclone Ge Healthcare Life Sciences, Waltham, MA USA), 15% fetal bovine serum (FBS), 1% penicillin/streptomycin, and 1% glutamax from Thermo Fisher Scientific (Waltham, MA USA) in a T75 flask, Thermo Fisher Scientific (Waltham, MA USA). Sloan–Kettering Breast Cancer–3 (SK–BR–3) cell lines were cultured in McCoy’s modified 5a Media (Hyclone Ge Healthcare Life Sciences, Waltham, MA USA), 10% fetal bovine serum (FBS), 1% penicillin/streptomycin, and 1% glutamax from Thermo Fisher Scientific (Waltham, MA USA) in a T25 flask, Thermo Fisher Scientific (Waltham, MA USA). Corning MG® Basement Membrane Matrix High Concentration *LDEV–Free, Corning (Tewskbury, MA, USA) was used for bioassays. Cannabidiol solution was a certified reference material ordered from Sigma–Aldrich (St. Louis, MO, USA).
Cells were maintained in an incubator at 37°C and 5% CO2. Cells were observed with a phase contrast microscope CKX41 from Olympus (Waltham, MA USA) for confluency. Cells were washed with 1x sterile phosphate buffer saline (PBS) Hyclone GE Healthcare Life Sciences (Waltham, MA USA). Cells were trypsinized using 0.25% Trypsin–EDTA from Genclone (San Diego, CA, USA) for a 5–minute incubation. Cells were neutralized with media. Mixture was transferred and centrifuged at 3000 rpms in an Eppendorf centrifuge 5804R–15 AMP version (Hamburg, Germany). Supernatant was removed and resuspended in media. An Auto Cellometer T4 (Nexcelom, Lawerence, MA) was used for all cell count calculations. Calcein–AM (Thermo Fisher, Waltham, MA) was used for staining and analyzed via Multimode Analysis Program, (Molecular Devices, Sunnyvale, CA). Fluorescent images were taken using Olympus IX71 inverted fluorescent microscope from Olympus (Waltham, MA, USA) using a Cy3 filter at 10x magnification. All graphs and calculations were completed using Microsoft Excel. The statistical comparison between media and concentrations used was made by paired t–test (two–sample assuming unequal variances); p<0.05 was considered significant.
Cellular proliferation: 2d (low concentrations) and 3d (high concentrations) with corning mg (mg)
2D (low concentrations): Cells were plated onto a 24–well plate, initially coated with 5, 10 or 20 µg/ml MG at a density of 10,000 cells/ well and incubated at 37°C, 5% CO2. After 1 hour, 2 days and 7 days of incubation wells were washed once with PBS and incubated in the dark with calcein–AM. Fluorescent samples were quantified using FilterMax F5 Multi–Mode microplate reader from Molecular Devices Multi–Mode Analysis software. For 3D cell proliferation assay, (high concentrations) in 3D cellular proliferation assay, 20, 100 or 500 µg/ml MG were used. 3D cell proliferation assays were conducted using high concentrations to optimize conditions for cell lines in 20, 100 or 500 µg/ml MG.
Cannabidiol cell proliferation: 2D and 3D with MG
1.0 mg/mL in methanol cannabidiol solution was sourced from Sigma Aldrich (now Millipore Sigma) 2D: Cells were plated onto a 24–well plate, initially coated with 20 µg/ml MG at a density of 10,000 cells/ well and incubated at 37°C, 5% CO2. The following CBD concentrations were used for 2D cellular proliferation assay: 10pM, 15pM, and 20pM. 20µM Methanol (purchased from Sigma) was also used in parallel. 3D: Cells were plated onto a 24–well plate, mixed with 200 µg/ml MG. The following CBD concentrations were used for 3D cellular proliferation assay: 5pM, 10pM, and 20pM. After 1 hour, 2 days and 7 days of incubation wells were washed twice with PBS and incubated in the dark with calcein–AM. Fluorescent samples were quantified using FilterMax F5 Multi–Mode microplate reader from Molecular Devices.
Cannabidiol–infused collagen bead
A 2 mg/mL collagen from Sigma–Aldrich (St. Louis, MO) bead was infused with 20pM CBD and plated in 20µg/mL MG and cell suspension. One 20µL Bead was plated per well. After 1 hour, 2 days and 7 days of incubation wells were washed twice with PBS and incubated in the dark with calcein–AM. Fluorescent samples were quantified using FilterMax F5 Multi–Mode microplate reader from Molecular Devices. Photos were taken at 4x and 10x.
Hff–1 and sk–br–3 morphology, initial adhesion and cellular proliferation in 2D
Initial adhesion can be characterized by the rate of attachment of cells, in this experiment a 24–well plate. (Figure 1A) HFF–1 and SK–BR–3 cells were seeded at 10,000 per well in 0μg/mL, 5μg/mL, 10μg/mL and 20μg/mL MG initially coated–wells on a 24 well plate.
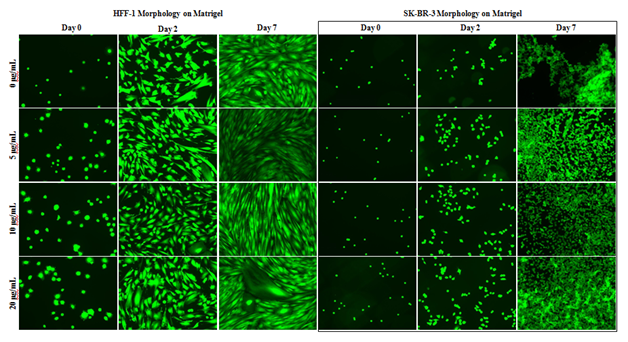
Figure 1A HFF-1 and SK-BR-3 Morphology.
HFF-1 and SK-BR-3 were cultured on MG initially coated wells for 7 days. Fluorescent images and plate reading were performed at 1-hour, 2 days, and 7 days. Although SK-BR-3 cells experienced less aggregation in the presence of MG, both HFF-1 and SK-BR-3 cell morphology and proliferation were unaffected by MG. N=9.
HFF–1 and SK–BR–3 morphology and proliferation appear unaffected by the presence and concentration of MG during the 7–day proliferation. Images taken on day 2 In Figure 1A show similar morphology and cell proliferation of HFF–1 from day 0 in all conditions. Images taken on day 7 show similar morphology and cell growth of HFF–1 from day 2 in all conditions. Day 0 fluorescent images of HFF–1 cells show increased initial adhesion from 0μg/mL to 20μg/mL MG initially coated wells. Fluorescent images show HFF–1 growth reaches well confluency between day 2 and day 7 of 7–day proliferation. SK–BR–3 cells appear less aggregated in the presence of MG HFF–1 and SK–BR–3 morphology and proliferation are unaffected by the initial coating of MG and initial adhesion increases in initially coated wells.
2D MG has no significant effect on hff–1 or SK–BR–3 initial adhesion
HFF–1 initial adhesion appears unaffected by the presence of MG at 0μg/mL, 5μg/mL, 10μg/mL, and 20μg/mL initially coated wells (Figure 1B). There is a slight trend for increased initial adhesion in the presence of 5μg/mL, 10μg/mL, and 20μg/mL MG initially coated wells. All MG initially coated wells produced about a 4.5% increase in initial adhesion compared to the 0μg/mL MG initially coated wells. Increasing the concentrations of MG used to initially coat the wells did not yield any correlated increase in the initial adhesion of HFF–1 cells.
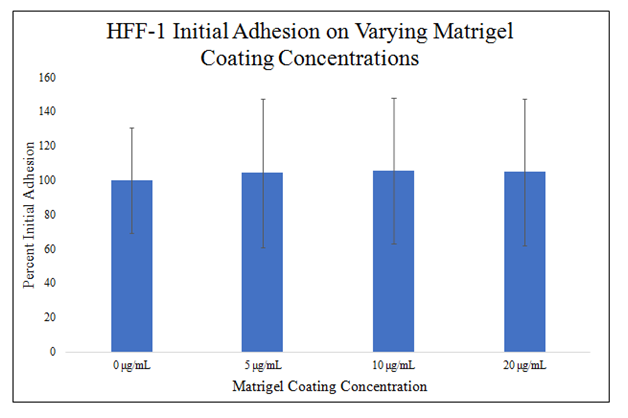
Figure 1B Initial Adhesion of HFF-1.
There is no statistically significant difference between HFF-1 initial adhesion with MG or regular media. HFF-1 cells were plated on 0μg/mL, 5μg/mL, 10μg/mL, and 20μg/mL MG initially coated wells and plate reading was performed after a 1-hour incubation. There is no statistically significant effect of MG initially coated wells on HFF-1 initial adhesion after a 1-hour incubation. The concentration of MG used to initially coat the wells appears to have no effect as there is no trend despite doubling the concentrations. N=9.
There is a trend for SK–BR–3 initial adhesion to increase in the presence of MG (Figure 1C). 10μg/mL and 20μg/mL MG initially–coated wells have higher initial adhesion than 0μg/mL and 5μg/mL MG initially coated wells. 10μg/mL MG produced about a 6% increase in initial adhesion and 20μg/mL MG produced about a 16% increase from 0μg/mL MG. There is a trend for a correlation between increasing MG initial coating concentration and increasing SK–BR–3 initial adhesion. The initial adhesion of SK–BR–3 cells does not double when doubling the MG concentration used to initially coat the well. There is no statistically significant difference between the concentrations of MG used to initially coat the wells and HFF–1 or SK–BR–3 initial adhesion after a 1–hour incubation.
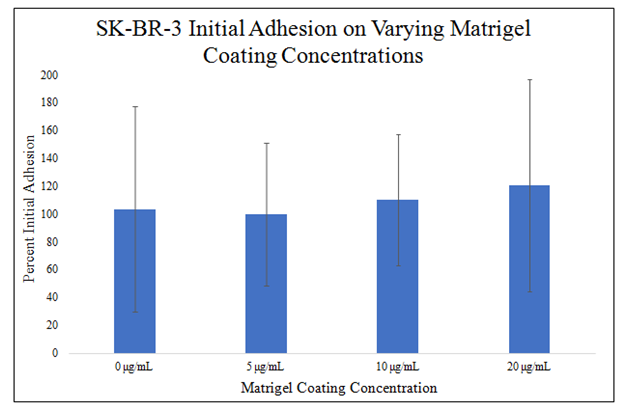
Figure 1C Initial Adhesion of SK-BR-3.
There is no statistically significant difference between SK-BR-3 initial adhesion with MG or regular media. SK-BR-3 cells were plated on 0μg/mL, 5μg/mL, 10μg/mL, and 20μg/mL MG initially coated wells and plate reading was performed after a 1-hour incubation. There is a trend for increased SK-BR-3 initial adhesion and a trend for increasing initial adhesion with increasing concentrations of MG used to initially coat the wells. N=9.
2D MG has no significant effect on HFF–1 or SK–BR–3 proliferation
There is no trend or statistically significant difference between 0μg/mL, 5μg/mL, 10μg/mL, and 20μg/mL MG initially coated–wells on HFF–1 proliferation during a 7–day proliferation (Figure 1D). Proliferation on day 2 is similar amongst non–MG initially–coated wells and MG initially–coated wells with no trend present. Proliferation on day 7 is similar amongst non–MG initially–coated wells and MG initially–coated wells with no trend present. 0μg/mL MG initially coated–wells yielded a 335% increase from day 0 to day 2 and 540% increase from day 0 to day 7. 5μg/mL MG initially coated–wells yielded a 323% increase from day 0 to day 2 and 571% increase from day 0 to day 7. 10μg/mL MG initially coated–wells yielded 318% increase from day 0 to day 2 and 567% increase from day 0 to day 7. 20μg/mL MG initially coated–wells yielded a 319% increase from day 0 to day 2 and 555% increase from day 0 to day 7. Proliferation increase from day 0 to day 2 is ~320% amongst non–MG initially–coated wells and MG initially–coated wells with no trend present. Proliferation increase from day 2 to day 7 is ~230% amongst non–MG initially–coated wells and MG initially–coated wells with no trend present. Proliferation between day 0 and day 2 was higher than proliferation from day 2 to day 7.
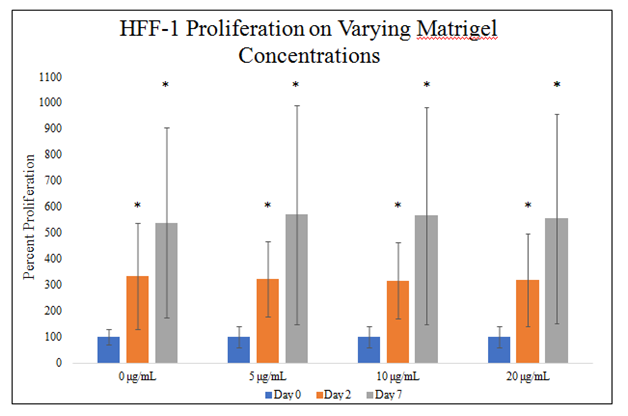
Figure 1D Cellular Proliferation of HFF-1.
There is no trend or statistically significant difference in HFF-1 proliferation amongst non-MG initially-coated wells and MG initially-coated wells. HFF-1 cells were seeded at 10,000 per well on 0μg/mL, 5μg/mL, 10μg/mL, and 20μg/mL MG initially coated-wells on a 24 well plate. Proliferation between day 0 and day 2 was higher than proliferation from day 2 to day 7. N=9.
There is a trend, but no statistically significant difference, for decreased SK–BR–3 proliferation at 10μg/mL and 20μg/mL MG initially–coated wells on day 7 of a 7–day proliferation (Figure 1E). There is a trend for decreased proliferation in MG initially–coated wells on day 2. There does not appear to be a correlation between the amount of MG used to initially–coat the wells and the proliferation of SK–BR–3 cells on day 2 of the 7–day proliferation. There is a trend for decreased proliferation at 10μg/mL and 20μg/mL MG initially–coated wells on day 7 with the lowest proliferation being in 20μg/mL MG initially–coated wells. There does appear to be a correlation between the increasing amount of MG used to initially–coat the wells and the decreasing proliferation of SK–BR–3 cells on day 7 of the 7–day proliferation at 10μg/mL and 20μg/mL MG initially–coated wells. 0μg/mL MG initially coated–wells yielded a 947% increase from day 0 to day 2 and 5740% increase from day 0 to day 7. 5μg/mL MG initially coated–wells yielded a 739% increase from day 0 to day 2 and 5933% increase from day 0 to day 7. 10μg/mL MG initially coated–wells yielded 602% increase from day 0 to day 2 and 5347% increase from day 0 to day 7. 20μg/mL MG initially coated–wells yielded a 755% increase from day 0 to day 2 and 4781% increase from day 0 to day 7.

Figure 1E Cellular Proliferation of SK-BR-3.
A decreasing trend observed with increase in MG concentrations with SK-BR-3 Cellular Proliferation. SK-BR-3 cells were seeded at 10,000 per well on 0μg/mL, 5μg/mL, 10μg/mL, and 20μg/mL MG initially coated-wells on a 24 well plate. There is a trend for decreased proliferation on MG initially-coated wells on day 2 but not a correlation between the amount of MG used to initially-coat the wells and the proliferation of SK-BR-3 cells on day 2 of the 7-day proliferation. N=9.
MeOH does Not affect SK–BR–3 or HFF–1 cell morphology, initial adhesion, or cellular proliferation
HFF–1 morphology and proliferation appear unaffected by the presence of 20μM MeOH shown in Figure 2A, during the 7–day proliferation. Images taken on day 2 show similar morphology and cell proliferation of HFF–1 and SK–BR–3 from day 0 in all conditions. Images taken on day 7 show similar morphology and cell growth of HFF–1 from day 2 in all conditions. Striation pattern of HFF–1 cells can be seen in all conditions on day 7 despite slightly more spaced appearance in the day 2 20μM MeOH image. Images taken on day 7 show similar morphology but increased proliferation in the presence of MG. SK–BR–3 aggregation was less in 20μM MeOH conditions compared to MG initially–coated wells and non–coated wells in day 7 images. 20μM MeOH does not appear to influence HFF–1 or SK–BR–3 morphology.
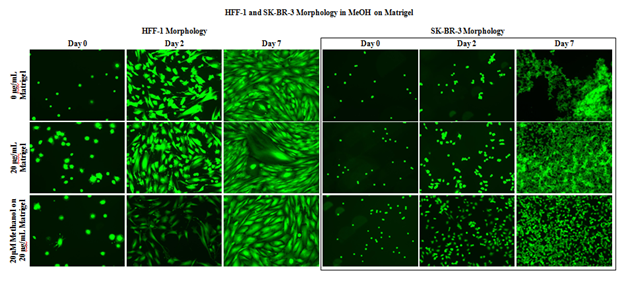
Figure 2A Cell Morphology of HFF-1 and SK-BR-3 in MEOH on MG.
A 20μM MeOH does not appear to influence HFF-1 and SK-BR-3 morphology. HFF-1 and SK-BR-3 cells were seeded at 10,000 per well in 20μM MeOH on 20μg/mL MG initially coated-wells on a 24 well plate. SK-BR-3 aggregation was less in 20μM MeOH conditions compared to MG initially-coated wells and non-coated wells in day 7 images. N=9.
20μM MeOH does not affect HFF–1 or SK–BR–3 initial adhesion Figure 2B. HFF–1 initial adhesion in 20μM MeOH is higher than HFF–1 initial adhesion without 20μM MeOH by ~6%. SK–BR–3 initial adhesion in 20μM MeOH is higher than SK–BR–3 initial adhesion without 20μM MeOH by ~1%. HFF–1 initial adhesion in 20μg/mL MG initially–coated wells is higher than SK–BR–3 initial adhesion in 20μg/mL MG initially–coated wells by 377%. HFF–1 initial adhesion in 20μg/mL MG initially–coated wells with 20μM MeOH is higher than SK–BR–3 initial adhesion in 20μg/mL MG initially–coated wells with 20μM MeOH by 383%.
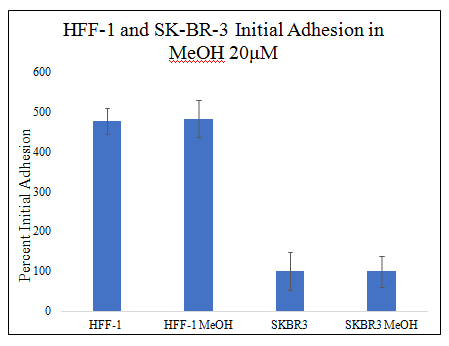
Figure 2B Initial Adhesion of HFF-1 and SK-BR-3 in MEOH on MG.
20μM MeOH does not affect HFF-1 or SK-BR-3 initial adhesion on 20μg/mL MG initially-coated wells. HFF-1 and SK-BR-3 cells were seeded at 10,000 per well on 20μM MeOH in 20μg/mL MG initially coated-wells on a 24 well plate. N=9.
20μM MeOH does not have a statistically significant effect on HFF–1 or SK–BR–3 proliferation in 20μg/mL MG initially–coated wells (Figure 2C). There is a slight trend for decreased proliferation by both HFF–1 and SK–BR–3 in MeOH on day 2 of the 7–day proliferation. There is a slight trend for decreased proliferation by both HFF–1 and SK–BR–3 in MeOH on day 7 of the 7–day proliferation. Non–MeOH treated HFF–1 cells yielded a 219% increase from day 0 to day 2 and 489% from day 0 to day 7. MeOH treated HFF–1 cells yielded an 86% increase from day 0 to day 2 and 359% increase from day 0 to day 7. Non–MeOH treated SK–BR–3 cells yielded a 546% increase from day 0 to day 2 and 4111% from day 0 to day 7. MeOH treated SK–BR–3 cells yielded a 370% increase from day 0 to day 2 and 3648% increase from day 0 to day 7.
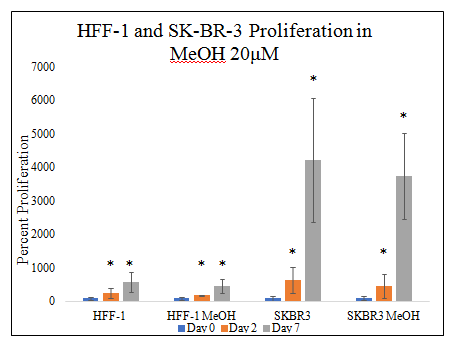
Figure 2C Cellular Proliferation of HFF-1 and SK-BR-3 in MEOH on MG.
There is a trend for MeOH treated HFF-1 and SK-BR-3 cells and decreasing SK-BR-3 proliferation seen on day 7 of the 7-day proliferation, but not a statistically significant difference. HFF-1 and SK-BR-3 cells were seeded at 10,000 per well in 20μM MeOH on 20μg/mL MG initially-coated wells on a 24 well plate. N=9.
CBD decreasing cell confluency of SK–BR–3 on 20μg/ml mg initially coated wells and no effect on HFF–1
HFF–1 and SK–BR–3 cell morphology was unaffected in all conditions (Figure 3A) Day 0 fluorescent images show similar HFF–1 well confluency and morphology in all conditions. HFF–1 spindle morphology and monolayer confluency is similar in all conditions on day 2 and day 7. HFF–1 proliferation from day 0 to day 2 and day 2 to day 7 is similar in all conditions. Bead–like appearance of cells in day 7 10pM CBD condition are detached HFF–1 cells nested within HFF–1 cell alignment. There is a trend for decreased in SK–BR–3 proliferation on day 2 and day 7 with increasing CBD concentration. The trend for decreasing proliferation with increasing CBD concentration is greater on day 7 than day 2. Untreated SK–BR–3 cell aggregations proliferated resulting in high cell density and high cell confluency on day 7. Increasing the concentration of CBD shows a decrease in confluency in SK–BR–3 photos and no significant effect in HFF–1 photos stained with Calcein–AM.
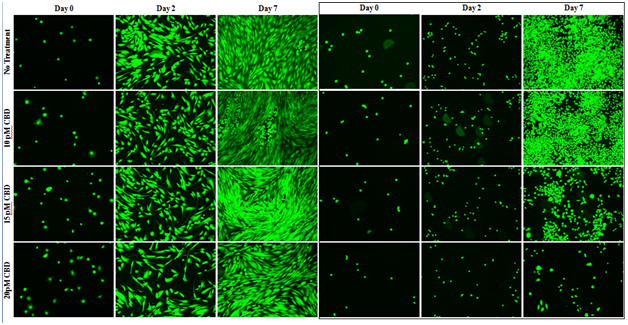
Figure 3A Cell Morphology of HFF-1 and SK-BR-3 in CBD on MG.
There is no observable effect of CBD, at all concentrations, on HFF-1 morphology in the fluorescent images. HFF-1 and SK-BR-3 cells were seeded at 10,000 per well in 10pM, 15pM, and 20pM CBD on 20μg/mL MG initially coated-wells on a 24 well plate. There is a trend for decreased in SK-BR-3 proliferation on day 2 and day 7 with increasing CBD concentration and is noticeably greater on day 7 than day 2. Increasing the concentration of CBD shows a decrease in confluency in SK-BR-3 photos and no significant effect in HFF-1 photos stained with Calcein-AM. N=9.
Low doses of CBD does not affect HFF–1 or SK–BR–3 cell initial adhesion
There is no statistically significant difference in HFF–1or SK–BR–3 initial adhesion in the presence of 0pM, 10pM, 15pM, or 20pM CBD in 20μg/mL MG initially coated–wells (Figure 3B&3C). There is a trend for decreased initial adhesion in the presence of CBD at higher doses as seen in 15pM and 20pM CBD. The presence of 10pM CBD raised HFF–1 initial adhesion by 9%. The presence of 15pM CBD lowered HFF–1 initial adhesion by 11%. The presence of 20pM CBD lowered HFF–1 initial adhesion by 13%. The level of initial adhesion does not appear to be dependent on the concentration of CBD added to the wells. There is a trend for no effect of CBD on SK–BR–3 cell initial adhesion at 0pM, 10pM, 15pM, or 20pM CBD in 20μg/mL MG initially coated–wells. The presence of 10pM CBD lowered SK–BR–3 initial adhesion by 4%. The presence of 15pM CBD lowered SK–BR–3 initial adhesion by 4%. The presence of 20pM CBD lowered SK–BR–3 initial adhesion by 3%.
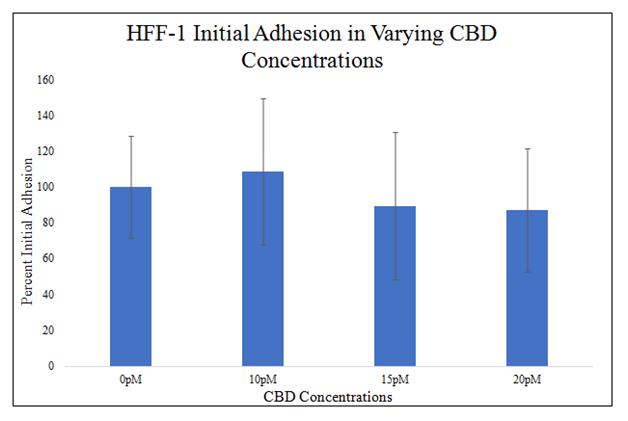
Figure 3B Initial Adhesion of HFF-1 in CBD on MG.
There is a trend for decreased initial adhesion in the presence of CBD at higher doses as seen in 15pM and 20pM CBD. HFF-1 cells were seeded at 10,000 per well the presence of 0pM, 10pM, 15pM, and 20pM CBD on 20μg/mL MG initially coated-wells on a 24 well plate. There is no statistically significant difference between 0pM, 10pM, 15pM, or 20pM CBD used and the initial adhesion of HFF-1 cells after a 1-hour incubation. N=9.
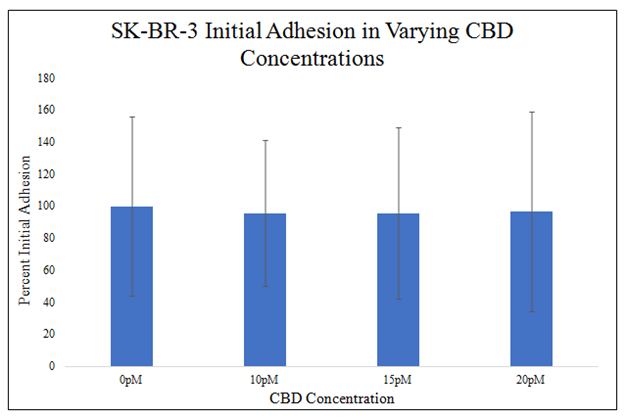
Figure 3C Initial Adhesion of SK-BR-3 in CBD on MG.
There is a trend for no effect of CBD on SK-BR-3 cell initial adhesion at 0pM, 10pM, 15pM, or 20pM CBD in 20μg/mL MG initially coated-wells. SK-BR-3 cells were seeded at 10,000 per well the presence of 0pM, 10pM, 15pM, and 20pM CBD on 20μg/mL MG initially coated-wells on a 24 well plate. There is no statistically significant difference in SK-BR-3 cell initial adhesion in the presence of 0pM, 10pM, 15pM, or 20pM CBD on 20μg/mL MG initially coated-wells. N=9.
Trend for CBD increasing HFF–1 proliferation, decreasing SK–BR–3 proliferation
There is no statistically significant difference between HFF–1 proliferations in different CBD concentrations on day 2 of the proliferation. There is a trend on day 2 of the proliferation for increasing HFF–1 proliferation with higher CBD presence. There is a statistically significant difference between 0pM and 15pM CBD and HFF–1 proliferation on day 7 of a 7–day proliferation. There is a trend on day 7 of the proliferation for increasing HFF–1 proliferation with higher CBD presence. 0pM CBD presence yielded a 218% increase from day 0 to day 2 and 480% from day 0 to day 7. 10pM CBD presence yielded a 224% increase from day 0 to day 2 and 677% from day 0 to day 7. 15pM CBD presence yielded a 336% increase from day 0 to day 2 and 932% from day 0 to day 7. 20pM CBD presence yielded a 315% increase from day 0 to day 2 and 693% from day 0 to day 7. Proliferation increase from day 0 to day 2 is ~273% amongst non–CBD and CBD present wells with a trend for increased HFF–1 proliferation with CBD present. Proliferation increase from day 0 to day 7 is ~696% amongst non–CBD and CBD present wells with a trend for increased HFF–1 proliferation with CBD present. Proliferation between day 2 and day 7 was higher than proliferation from day 0 to day 2 (Figure 3D&3E).
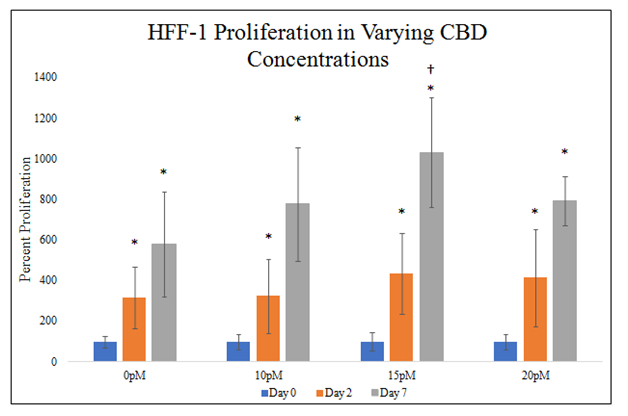
Figure 3D Cellular Proliferation of HFF-1 in CBD on MG.
There is a statistically significant difference between HFF-1 proliferations in 0pM and 15pM CBD on day 7 and a trend for increased HFF-1 proliferation in the presence of CBD on day 2 and day 7. HFF-1 cells were seeded at 10,000 per well in 0pM, 10pM, 15pM, and 20pM CBD on 20μg/mL MG initially coated-wells on a 24 well plate. Proliferation between day 2 and day 7 was higher than proliferation from day 0 to day 2. N=9.
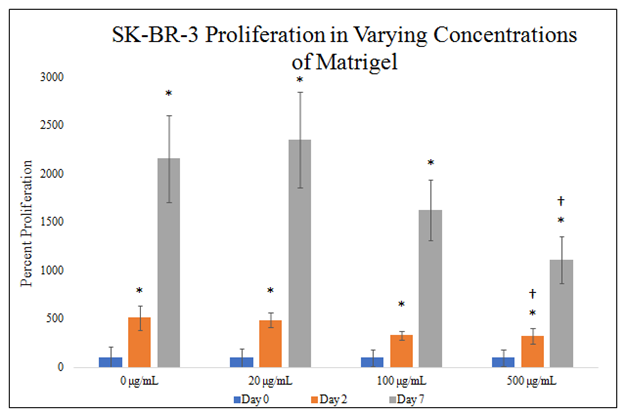
Figure 3E Cellular Proliferation of SK-BR-3 in CBD on MG.
There is a statistically significant difference between SK-BR-3 proliferations in 0pM, 15pM, and 20pM CBD on day 7 a trend for decreased SK-BR-3 proliferation in the presence of CBD on day 2 and day 7. HFF-1 cells were seeded at 10,000 per well in 0pM, 10pM, 15pM, and 20pM CBD on 20μg/mL MG initially coated-wells on a 24 well plate. Proliferation between day 2 and day 7 was lower than proliferation from day 0 to day 2. N=9.
There is no statistically significant difference between SK–BR–3 proliferations in different CBD concentrations on day 2 of the proliferation. There is a trend on day 2 of the proliferation for decreasing SK–BR–3 proliferation with higher CBD presence. There is a statistically significant difference between 0pM, 15pM, and20pM CBD and SK–BR–3 proliferation on day 7 of the 7–day proliferation. There is a trend on day 7 of the proliferation for decreasing SK–BR–3 proliferation with higher CBD presence. 0pM CBD presence yielded a 247% increase from day 0 to day 2 and 5606% from day 0 to day 7. 10pM CBD presence yielded a 186% increase from day 0 to day 2 and 3643% from day 0 to day 7. 15pM CBD presence yielded a 92% increase from day 0 to day 2 and 1875% from day 0 to day 7. 20pM CBD presence yielded a 63% increase from day 0 to day 2 and 776% from day 0 to day 7. Proliferation increase from day 0 to day 2 is ~147% amongst non–CBD and CBD present wells with a trend for decreased SK–BR–3 proliferation with CBD present. Proliferation increase from day 0 to day 7 is ~2975% amongst non–CBD and CBD present wells with a trend for decreased SK–BR–3 proliferation with CBD present. Proliferation between day 2 and day 7 was lower than proliferation from day 0 to day 2.
3d MG has no effect on HFF–1 and SK–BR–3 morphology, initial adhesion, or cellular proliferation
HFF–1 and SK–BR–3 cell morphology was unaffected in all conditions (Figure 4A). Day 0 fluorescent images show similar HFF–1 well confluency and morphology in all conditions. HFF–1 spindle morphology and monolayer confluency is similar in all conditions on day 2 and day 7. HFF–1 proliferation from day 0 to day 2 and day 2 to day 7 is similar in all conditions. HFF–1 spindles aligned and formed pockets in which detached HFF–1 cells aggregated in all 3D MG environments. 500mg/mL 3D MG environment resulted in SK–BR–3 cell aggregate formation only on day 7. Fluorescent images show varying 3D MG environments do not appear to affect HFF–1 or SK–BR–3 morphology, but SK–BR–3 cell aggregate formations appear to occur at 500mg/mL MG 3D environment.

Figure 4A 3D HFF-1 and SK-BR-3 Morphology in MG.
There appears to be no observable effect of different 3D MG environment on HFF-1 morphology in the fluorescent images. HFF-1 and SK-BR-3 cells were seeded at 10,000 per well in 0μg/mL, 20μg/mL, 100μg/mL and 500μg/mL MG with media on a 24 well plate. Fluorescent images show varying 3D MG environments do not appear to affect SK-BR-3 morphology, but SK-BR-3 cell aggregate formations appear to occur at 500mg/mL MG 3D environment. N=9.
There is no statistically significant difference in HFF–1 or SK–BR–3 initial adhesion in the presence of 0μg/mL, 20μg/mL, 100μg/mL and 500μg/mL MG (Figure 4B&4C). There is a trend for increasing HFF–1 initial adhesion in the presence of increasing MG concentration. HFF–1 initial adhesion increased by 9% in 20μg/mL MG, by 8% in 100μg/mL MG, and by 17% in 500μg/mL MG when compared to HFF–1 initial adhesion in 0μg/mL MG. Though there is a trend for increasing HFF–1 initial adhesion in increasing MG concentrations, there is no statistically significant difference in HFF–1 initial adhesion in 0μg/mL, 20μg/mL, 100μg/mL and 500μg/mL MG. There is a trend for increased SK–BR–3 initial adhesion in the presence of increased MG concentration. SK–BR–3 initial adhesion decreased by 5% in 20μg/mL MG, increased by 27% in 100μg/mL MG, and increased by 18% in 500μg/mL MG when compared to SK–BR–3 initial adhesion in 0μg/mL MG.
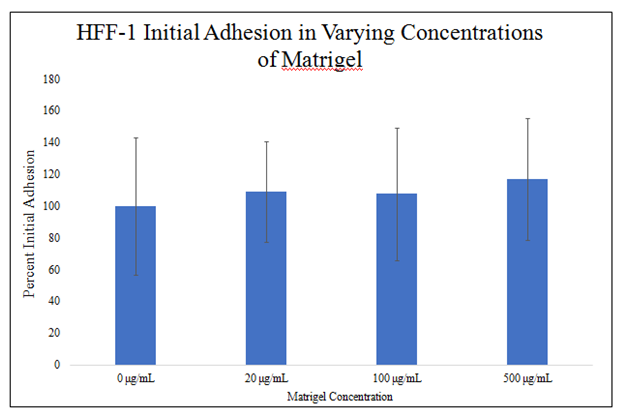
Figure 4B Initial Adhesion of HFF-1 in MG.
There is a trend for increasing HFF-1 initial adhesion in the presence of increasing MG concentration. HFF-1 cells were seeded at 10,000 per well in 0μg/mL, 20μg/mL, 100μg/mL and 500μg/mL MG with media on a 24 well plate. There is no statistically significant difference in HFF-1 initial adhesion in the presence of 0μg/mL, 20μg/mL, 100μg/mL and 500μg/mL MG. N=9.
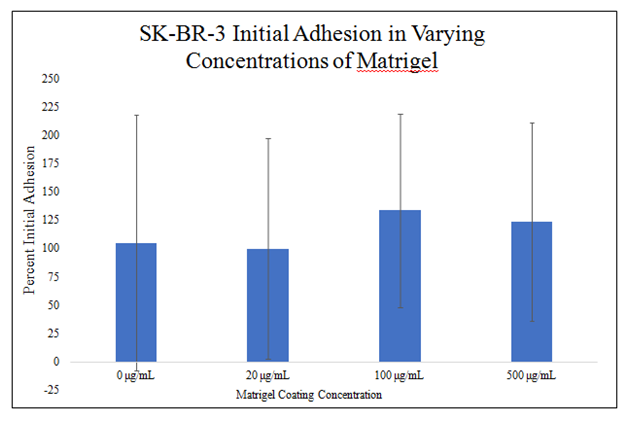
Figure 4C Initial Adhesion of SK-BR-3 in MG.
There is a trend for increased SK-BR-3 initial adhesion in the presence of increased MG concentration. SK-BR-3 cells were seeded at 10,000 per well in 0μg/mL, 20μg/mL, 100μg/mL and 500μg/mL MG with media on a 24 well plate. There is no statistically significant difference in SK-BR-3 initial adhesion in the presence of 0μg/mL, 20μg/mL, 100μg/mL and 500μg/mL MG. N=9.
There is no statistically significant difference between HFF–1 proliferations in different MG concentrations during the 7–day proliferation (Figure 4D). There is a trend on day 2 of the proliferation for decreased HFF–1 proliferation in higher concentrations of MG. There is a trend on day 7 of the proliferation for increasing HFF–1 proliferation from 0 to 100μg/mL MG and then a decrease in proliferation at 500μg/mL MG. HFF–1 proliferation in 0μg/mL MG yielded an 89% increase from day 0 to day 2 and 587% increase from day 0 to day 7. HFF–1 proliferation in 20μg/mL MG yielded a 100% increase from day 0 to day 2 and 709% increase from day 0 to day 7. HFF–1 proliferation in 100μg/mL MG yielded a 92% increase from day 0 to day 2 and 746% increase from day 0 to day 7. HFF–1 proliferation in 500μg/mL MG yielded a 44% increase from day 0 to day 2 and 484% from day 0 to day 7. Proliferation increase from day 0 to day 2 is ~81% amongst MG concentrations without a trend of effect on HFF–1 proliferation. Proliferation increase from day 0 to day 7 is ~532% amongst MG concentrations with a trend for increasing HFF–1 proliferation from 0 to 100μg/mL MG then a decrease in proliferation at 500μg/mL MG. Proliferation between day 2 and day 7 was higher than proliferation from day 0 to day 2.
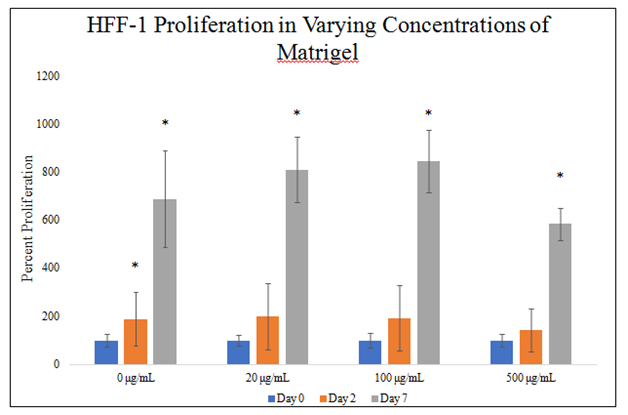
Figure 4D Cellular Proliferation of HFF-1 in MG.
There is a trend on day 7 of the proliferation for increasing HFF-1 proliferation from 0 to 100μg/mL MG and then a decrease in proliferation at 500μg/mL MG. HFF-1 cells were seeded at 10,000 per well in 0μg/mL, 20μg/mL, 100μg/mL and 500μg/mL MG with media on a 24 well plate. There is no statistically significant difference between HFF-1 proliferations in different MG concentrations during the 7-day proliferation. N=9.
There is a statistically significant difference between SK–BR–3 proliferation in 500μg/mL MG concentrations on day 2 of the 7–day proliferation (Figure 4E). There is a trend on day 2 of the proliferation for decreasing SK–BR–3 proliferation in increasing MG concentrations. There is a statistically significant difference between SK–BR–3 proliferation in 500μg/mL MG concentrations on day 7 of the 7–day proliferation. There is a trend on day 7 of the proliferation for decreasing SK–BR–3 proliferation in increasing MG concentrations. SK–BR–3 proliferation in 0μg/mL MG yielded an 412% increase from day 0 to day 2 and 2057% increase from day 0 to day 7. SK–BR–3 proliferation in 20μg/mL MG yielded a 387% increase from day 0 to day 2 and 2254% increase from day 0 to day 7. SK–BR–3 proliferation in 100μg/mL MG yielded a 230% increase from day 0 to day 2 and 1526% increase from day 0 to day 7. SK–BR–3 proliferation in 500μg/mL MG yielded a 225% increase from day 0 to day 2 and 1009% increase from day 0 to day 7. Proliferation increase from day 0 to day 2 is ~313% amongst MG concentrations with a trend for decreasing SK–BR–3 proliferation in increasing MG concentrations. Proliferation increase from day 0 to day 7 is ~1712% amongst MG concentrations with a trend for decreasing SK–BR–3 proliferation in increasing MG concentrations. Proliferation between day 2 and day 7 was higher than proliferation from day 0 to day 2.
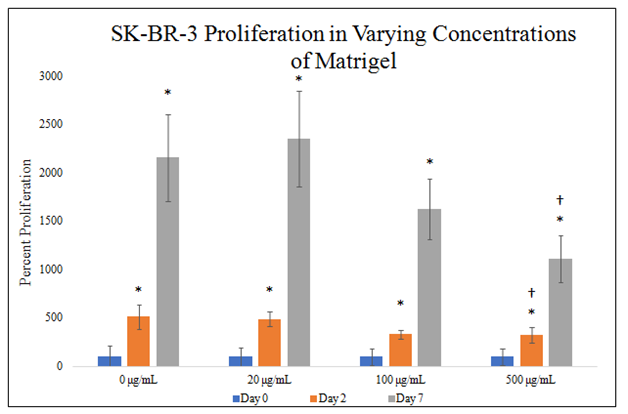
Figure 4E Cellular Proliferation of SK-BR-3 in MG.
There is a trend on day 2 and day 7 of the proliferation for decreasing SK-BR-3 proliferation in increasing MG concentrations and a statistically significant difference between SK-BR-3 proliferation in 500μg/mL MG concentrations. SK-BR-3 cells were seeded at 10,000 per well in 0μg/mL, 20μg/mL, 100μg/mL and 500μg/mL MG with media on a 24 well plate. Proliferation between day 2 and day 7 was higher than proliferation from day 0 to day 2. N=9.
CBD does not affect HFF–1 and SK–BR–3 morphology
HFF–1 cell morphology was unaffected in all CBD conditions. Day 0 fluorescent images show similar HFF–1 well confluency and morphology in all CBD conditions Figure 5A. HFF–1 spindle morphology is similar in all conditions on day 2 and day 7. HFF–1 proliferation from day 0 to day 2 and day 2 to day 7 is similar in all conditions except for 20pM CBD from day 2 to day 7 which appears to yield a lower confluency on from day 2 to day 7 than the other conditions. There appears to be no observable effect of different CBD concentrations on HFF–1 morphology in the fluorescent images.
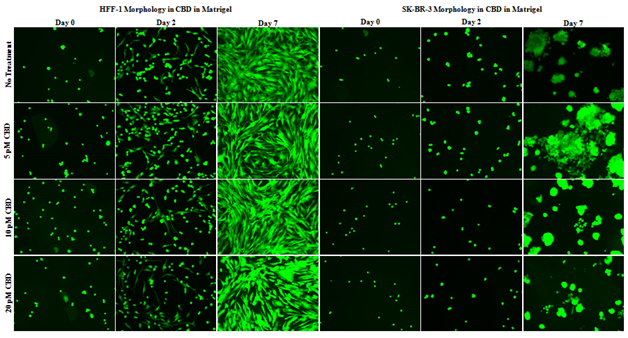
Figure 5A 3D Cell Morphology of HHF-1 and SK-BR-3 in CBD in MG.
There appears to be no observable effect of different CBD concentrations on HFF-1 morphology in the fluorescent images. HFF-1 and SK-BR-3 cells were seeded at 10,000 per well in 200μg/mL MG, media, with 0pM, 5pM, 10pM, or 20pM CBD on a 24 well plate. Fluorescent images show similar SK-BR-3 morphology in all conditions, similar aggregate formation in all CBD concentrations on day 7, and a slight trend for decreased proliferation from day 2 to day 7 at 20pM CBD when compared to other CBD concentrations. N=9.
SK–BR–3 cell morphology shows aggregate formation visible in all CBD concentrations in day 7 images of the 7–day proliferation. Day 0, day 2, and day 7 SK–BR–3 images show similar morphology in all conditions. There is a slightly visible trend for 20pM CBD lowering SK–BR–3 proliferation on day 7. Fluorescent images show similar SK–BR–3 morphology in all conditions, similar aggregate formation in all CBD concentrations on day 7, and a slight trend for decreased proliferation from day 2 to day 7 at 20pM CBD when compared to other CBD concentrations.
20pM CBD lowers HFF–1 initial adhesion, no effect on SK–BR–3 initial adhesion
There is a statistically significant difference in HFF–1 initial adhesion in the presence of 20pM CBD in 200μg/mL MG (Figure 5B). There is a trend for decreasing HFF–1 initial adhesion with increasing CBD concentration. HFF–1 initial adhesion decreased by 1% in 5pM CBD, by 16% in 10pM CBD, and by 25% in 20pM CBD when compared to HFF–1 initial adhesion in 0pM CBD.

Figure 5B Initial Adhesion of HFF-1 with varying CBD Concentrations.
There is a statistically significant decrease in HFF-1 initial adhesion in 200μg/mL MG at 20pM CBD and there is a trend for decreased HFF-1 initial adhesion with increasing CBD concentrations in 200μg/mL MG. HFF-1 cells were seeded at 10,000 per well in 200μg/mL MG, media, with 0pM, 5pM, 10pM, or 20pM CBD on a 24 well plate. After 1-hour of incubation wells were washed once with PBS and incubated in the dark with calcein-AM. Fluorescent samples were quantified using FilterMax F5 Multi-Mode microplate reader from Molecular Devices and Multi-Mode Analysis software. N=9.
There is no statistically significant difference in SK–BR–3 initial adhesion in different CBD concentrations in 200μg/mL MG (Figure 5C). There is a trend for increasing SK–BR–3 initial adhesion from 0pM CBD to 10pM CBD and decreasing SK–BR–3 initial adhesion from 10pm CBD to 20pM CBD. SK–BR–3 initial adhesion increased by 2% in 5pM CBD, increased by 8% in 10pM CBD, and decreased by 18% in 20pM CBD when compared to SK–BR–3 initial adhesion in 0pM CBD.
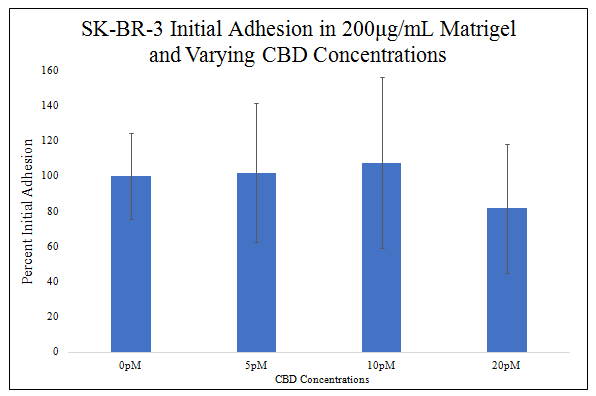
Figure 5C Initial Adhesion of SK-BR-3 with varying CBD Concentrations.
Though there is a trend for increasing SK-BR-3 initial adhesion from 0pM CBD to 10pM CBD and decreasing from 10pM CBD to 20pM CBD, there is no statistically significant difference in SK-BR-3 initial adhesion at 0pM, 5pM, 10pM, and 20pM CBD. SK-BR-3 cells were seeded at 10,000 per well in 200μg/mL MG, media, with 0pM, 5pM, 10pM, or 20pM CBD on a 24 well plate. N=9.
CBD has no significant effect on HFF–1 proliferation, lowers SK–BR–3 cell proliferation.
There is no statistically significant difference between HFF–1 proliferations in different CBD concentrations during the 7–day proliferation (Figure 5D). There is no statistically significant difference in HFF–1 proliferation from day 0 to day 2, therefore there is no statistically significant difference in HFF–1 presence from day 0 to day 2. There is a trend on day 7 of the proliferation for increasing HFF–1 proliferation from 0 to 10pM CBD and then less of an increase in HFF–1 proliferation from 10pM to 20pM CBD. HFF–1 proliferation in 0pM CBD yielded a 257% increase from day 0 to day 2 and 540% increase from day 0 to day 7. HFF–1 proliferation in 5pM CBD yielded a 247% increase from day 0 to day 2 and 878% increase from day 0 to day 7. HFF–1 proliferation in 10pM CBD yielded an 281% increase from day 0 to day 2 and 1174% increase from day 0 to day 7. HFF–1 proliferation in 20pM CBD yielded a 280% increase from day 0 to day 2 and 916% increase from day 0 to day 7. Proliferation increase from day 0 to day 2 is ~167% amongst MG concentrations without a trend of effect on HFF–1 proliferation. Proliferation increase from day 0 to day 7 is ~877% amongst MG concentrations with a trend for increasing HFF–1 proliferation from 0pM to 10pM CBD then a decrease in proliferation from 10pM to 20pM CBD. Proliferation between day 2 and day 7 was higher than proliferation from day 0 to day 2.
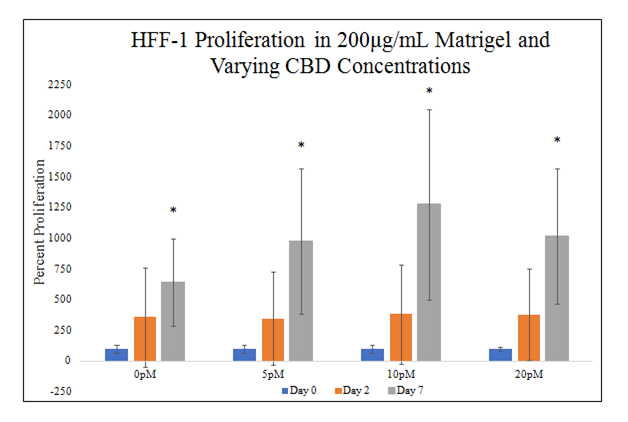
Figure 5D Cellular Proliferation of HFF-1 with varying CBD Concentrations.
There is no statistically significant difference in HFF-1 presence from day 0 to day 2 but there is a trend on day 7 of the proliferation for increasing HFF-1 proliferation from 0 to 10pM CBD and then less of an increase in HFF-1 proliferation from 10pM to 20pM CBD. HFF-1 cells were seeded at 10,000 per well in 200μg/mL MG, media, with 0pM, 5pM, 10pM, or 20pM CBD on a 24 well plate. There is no statistically significant difference between HFF-1 proliferations in different CBD concentrations during the 7-day proliferation. N=9.
There is a statistically significant decrease between SK–BR–3 proliferations in different CBD concentrations on day 2 and day 7 of the 7–day proliferation (Figure 5E). There is a statistically significant decrease in SK–BR–3 proliferation on day 2 in 10pM and 20pM CBD. There is a trend for decreasing SK–BR–3 proliferation with increasing CBD concentration on day 2. There is a statistically significant decrease in SK–BR–3 proliferation on day 7 in 20pM CBD. SK–BR–3 proliferation in 0pM CBD yielded a 245% increase from day 0 to day 2 and 1737% increase from day 0 to day 7. SK–BR–3 proliferation in 5pM CBD yielded an 201% increase from day 0 to day 2 and 1617% increase from day 0 to day 7. SK–BR–3 proliferation in 10pM CBD yielded a 153% increase from day 0 to day 2 and 1613% increase from day 0 to day 7. SK–BR–3 proliferation in 20pM CBD yielded an 119% increase from day 0 to day 2 and 257% increase from day 0 to day 7. Proliferation increase from day 0 to day 2 is ~179% amongst CBD concentrations with a trend for decreasing SK–BR–3 proliferation with increasing CBD concentration. Proliferation increase from day 0 to day 7 is ~1306% amongst CBD concentrations with statistically significant decrease in SK–BR–3 proliferation at 20pM. Proliferation between day 2 and day 7 was higher than proliferation from day 0 to day 2.
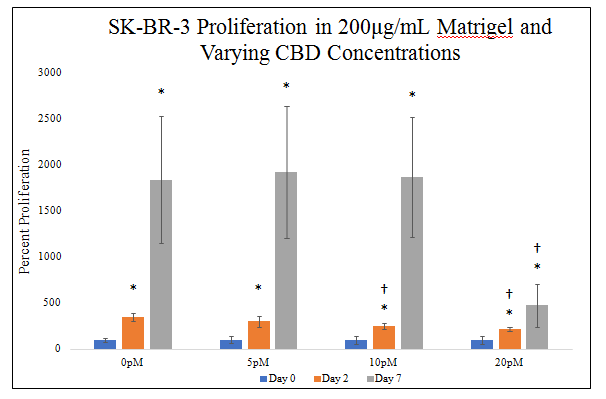
Figure 5E Cellular Proliferation of SK-BR-3 with varying CBD Concentrations.
There is a statistically significant decrease in SK-BR-3 proliferation on day 7 in 20pM CBD. SK-BR-3 cells were seeded at 10,000 per well in 200μg/mL MG, media, with 0pM, 5pM, 10pM, or 20pM CBD on a 24 well plate.There is a statistically significant decrease in SK-BR-3 proliferation on day 2 in 10pM and 20pM CBD and a trend for decreasing SK-BR-3 proliferation with increasing CBD concentration.
MG bead effects HFF–1 alignment
HFF–1 alignment and spindle–like morphology increase in MG bead and CBD presence on day 2 and day 7 (Figure 6A). Day 0 images show similar HFF–1 round shaped morphology remains unchanged by MG bead and CBD presence. Day 2 images show increased HFF–1 alignment in bead present conditions but similar spindle–like morphology in all conditions. Day 7 images show increased HFF–1 spindle–like morphology in all bead conditions and increased HFF–1 growth outside of the MG bead. HFF–1 presence is greater near the edge of the bead compared to the center of the bead on day 7 images.
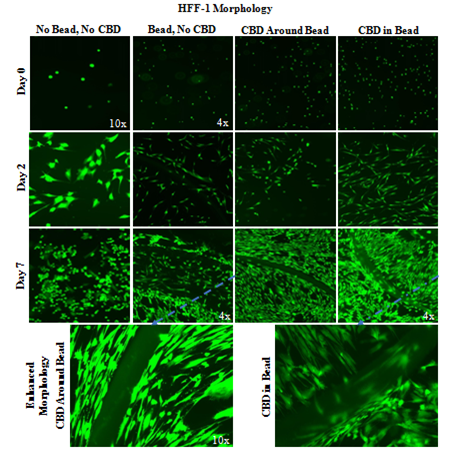
Figure 6A Bead HFF-1 Morphology with CBD-Infused Bead.
Day 7 images show increased HFF-1 spindle-like morphology in all bead conditions and increased HFF-1 growth outside of the MG bead. A 2 mg/mL collagen bead was infused or not infused with 20pM CBD and plated in 20µg/mL MG and cell suspension. One 20µL Bead was plated per well. Photos were taken at 4x and 10x. HFF-1 alignment and spindle-like morphology increase in MG bead and CBD presence on day 2 and day 7. N=9.
CBD–infused MG beads lower SK–BR–3 presence within bead.
SK–BR–3 cells appear to aggregate around the edge of non–CBD–infused MG beads and do not grow within CBD–infused MG beads (Figure 6B). Wells without the bead do not show the edge of bead alignment on day 0, day 2, or day 7. SK–BR–3 cells aggregate around the edge of the non–infused MG bead in day 0, day 2, and day 7 images. CBD–infused beads appear to limit the SK–BR–3 cell presence on the inside of the bead leading to less SK–BR–3 aggregation around the edge of the MG bead compared to non–CBD–infused MG beads. CBD–infused MG beads appear to produce aggregations of SK–BR–3 cells within the bead that are not seen in other conditions.
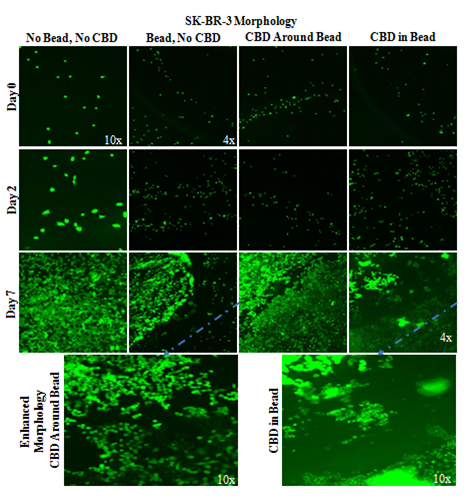
Figure 6B SK-BR-3 Morphology with CBD-Infused Bead.
CBD-infused MG beads have less SK-BR-3 cell presence within the bead and form cell aggregations. A 2 mg/mL collagen bead was infused or not infused with 20pM CBD and plated in 20µg/mL MG and cell suspension. 10,000 SK-BR-3 cells and one 20µL Bead were plated per well. Photos were taken at 4x and 10x. Non-CBD-infused MG beads have SK-BR-3 aggregation around the edge of the bead on all days. N=9.
CBD and MG bead have no significant effect on HFF–1 or SK–BR–3 initial adhesion
There is a trend for increased HFF–1 cell initial adhesion with MG bead presence and a similar trend with CBD presence (Figure 6C). MG bead presence increased HFF–1 initial adhesion 29%, CBD around the MG bead increased HFF–1 initial adhesion by 33%, and CBD–infused MG bead increased HFF–1 initial adhesion 37% when compared to no bead and no CBD condition. The combination of the variables, the CBD–infused MG beads, produces the greatest increase in HFF–1 initial adhesion. There is no statistically significant difference in HFF–1 initial adhesion in MG bead and CBD conditions.
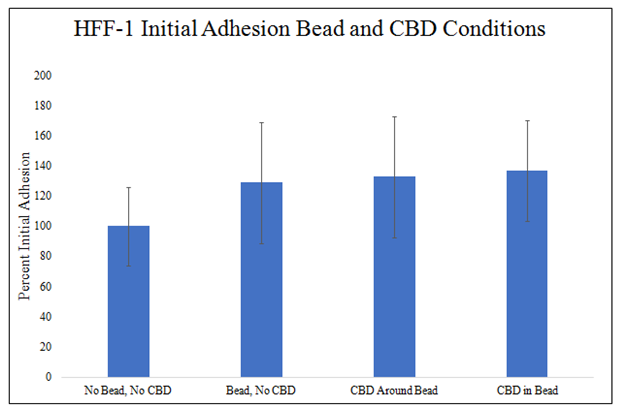
Figure 6C HFF-1 Initial Adhesion Bead and CBD Conditions.
There is a trend for increased HFF-1 initial adhesion in MG bead present conditions and there is a trend for increased HFF-1 initial adhesion in CBD present conditions. A 2 mg/mL collagen bead was infused or not infused with 20pM CBD and plated in 20µg/mL MG and cell suspension. 10,000 HFF-1 cells and one 20µL Bead were plated per well. N=9.
There is a trend for increase SK–BR–3 initial adhesion in the presence of the MG bead and a trend for decrease SK–BR–3 initial adhesion in the presence of CBD (Figure 6D). MG bead presence increased SK–BR–3 initial adhesion 57%, CBD around the MG bead increased SK–BR–3 initial adhesion by 32%, and CBD–infused MG bead increased SK–BR–3 initial adhesion 317% when compared to no bead and no CBD condition. The combination of the variables, the CBD–infused MG beads, produce the greatest decrease in SK–BR–3 initial adhesion. There is no statistically significant difference in SK–BR–3 initial adhesion in MG bead and CBD conditions.
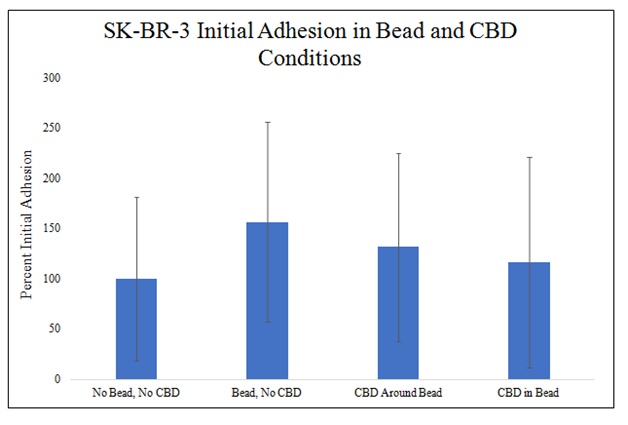
Figure 6D SK-BR-3 Initial Adhesion Bead and CBD Conditions.
There is a trend for increased SK-BR-3 initial adhesion in MG bead present conditions and there is a trend for decreased SK-BR-3 initial adhesion in CBD present conditions. A 2 mg/mL collagen bead was infused or not infused with 20pM CBD and plated in 20µg/mL MG and cell suspension. 10,000 SK-BR-3 cells and one 20µL Bead were plated per well. N=9.
CBD and MG significantly increase HFF–1 and SK–BR–3 proliferation
There is a statistically significant increase in HFF–1 proliferation on day 2 and day 7 in CBD and MG bead conditions (Figure 6E). There is a trend for increased HFF–1 proliferation on day 2 in the presence of MG and a similar trend in the presence of CBD. There is a trend for increased HFF–1 proliferation on day 7 in the presence of CBD. No MG bead and no CBD condition increased HFF–1 proliferation 144% from day 0 to day 2 and 487% from day 0 to day 7. MG bead and no CBD condition increased HFF–1 proliferation to 165% from day 0 to day 2 and 465% from day 0 to day 7. MG bead with CBD outside condition increased HFF–1 proliferation to 186% from day 0 to day 2 and 1027% from day 0 to day 7. CBD–infused MG bead condition increased HFF–1 proliferation to 230% from day 0 to day 2 and 908% from day 0 to day 7. Proliferation increase from day 0 to day 2 is ~81% amongst MG bead and CBD conditions with a trend for increasing HFF–1 proliferation in the presence of both MG bead and CBD. Proliferation increase from day 0 to day 7 is ~622% amongst MG bead and CBD conditions with a trend for increasing HFF–1 proliferation in the presence of CBD. Proliferation between day 2 and day 7 was higher than proliferation from day 0 to day 2.
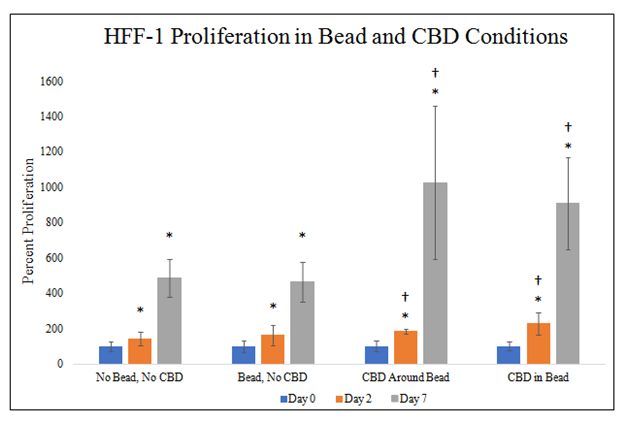
Figure 6E HFF-1 Cellular Proliferation Bead and CBD Conditions.
There is a statistically significant increase in HFF-1 proliferation on day 2 and day 7 in CBD and MG bead conditions with a trend on day 2 for increased HFF-1 proliferation in MG bead and CBD and day 7 for increased HFF-1 proliferation in CBD. A 2 mg/mL collagen bead was infused or not infused with 20pM CBD and plated in 20µg/mL MG and cell suspension. 10,000 HFF-1 cells and one 20µL Bead were plated per well. N=9.
There is a statistically significant increase in SK–BR–3 proliferation on day 7 in CBD and MG bead conditions (Figure 6F). There is a trend for increased SK–BR–3 proliferation on day 2 and day 7 in MG bead with no CDB and CBD–infused MG bead conditions when compared to no MG bead or CBD condition. There is a trend for decreased SK–BR–3 proliferation on day 2 and day 7 in CBD–infused MG bead condition when compared to no MG bead or CBD condition. No MG bead and no CBD condition increased SK–BR–3 proliferation to 155% from day 0 to day 2 and 1143% from day 0 to day 7. MG bead and no CBD condition increased SK–BR–3 proliferation to 140% from day 0 to day 2 and 1274% from day 0 to day 7. MG bead with CBD outside condition decreased SK–BR–3 proliferation to 80% from day 0 to day 2 and 288% from day 0 to day 7. CBD–infused MG bead condition increased SK–BR–3 proliferation to 288% from day 0 to day 2 and 1721% from day 0 to day 7. Proliferation increase from day 0 to day 2 is ~65% amongst MG bead and CBD conditions. Proliferation increase from day 0 to day 7 is ~1007% amongst MG bead and CBD conditions. Proliferation between day 2 and day 7 was higher than proliferation from day 0 to day 2.

Figure 6F SK-BR-3 Cellular proliferation bead and CBD conditions.
There is a statistically significant increase in SK-BR-3 proliferation on day 7 in CBD and MG bead conditions with trends, A 2 mg/mL collagen bead was infused or not infused with 20pM CBD and plated in 20µg/mL MG and cell suspension. 10,000 SK-BR-3 cells and one 20µL Bead were plated per well. There is increased SK-BR-3 proliferation on day 2 and day 7 in MG bead with no CBD and CBD-infused MG bead conditions and decreased SK-BR-3 proliferation on day 2 and day 7 in CBD-infused MG bead condition. N=9.
During metastasis, metalloproteinases are expressed, breaking down the ECM, and propagate into other surrounding areas.35–40 The scaffold of the ECM involves physical characteristics, specific chemical niches, that change amongst tissues which aid in cellular behavior, migration and signal communication.41,42 In this manuscript, we report in the cellular behavior of human foreskin fibroblasts and SK–BR–3 cancer cells in 2D and 3D, revealing the essential role that MG significantly influences cellular behavior in regards to morphology, cellular adhesion, and cellular proliferation. Corning MG matrix extracted from the Engelbreth–Holm–Swarm (EHS) mouse sarcoma are a favorable basement membrane and environment for cancer cell growth in vitro.43
SK–BR–3 cells are a mammary gland breast cancer cell line with adenocarcinoma derived from metastatic site and are used to test the effects of therapeutics on HER2–positive breast cancer cells in previous research.44–46 Human Foreskin (HFF–1) cells are two non–cancerous human foreskin fibroblast samples.47,48 Healthy fibroblasts have active α5β1–integrin expression, and secrete type I and III collagen which repairs and remodels the ECM.49–55 Increased adhesion via interaction of integrin expression could cause a delayed detachment and retraction. Collagen and fibronectin influence the migration of fibroblast cells, therefore lower initial adhesion can detach easily from their surface, during cellular proliferation.56–60
MG was to be determined if there is an inherent background effect with either cancer or normal cell line. In initial 2–D assays, HFF–1 and SK–BR–3 cells were not impacted by the increasing concentrations of MG compared to the control. 3–D creation of ECM structures by utilizing MG improve cell to cell contact that may be useful for high throughput systems for drug screenings.31 There was minor aggregate formation occurring in Figure 4A photos for SK–BR–3 cells at day 7. However not frequent in repeated experiments. 500mg/mL MG was viscous at room temperature. Altering ECM may tightly couple cell formation from inadequate homogenous mixture resulting in aggregation. There were no significant changes in cellular morphology, initial adhesion or cellular proliferation. This bioplatform used shows no favor for either cell lines, reducing background noise of factors that can influence these results.
Methanol
9:1 methanol/chloroform is a common extraction solvent for cannabinoid analysis. (61) At 20µM concentrations, there was no statistically significant in cellular morphology, initial adhesion and cellular proliferation on either normal or cancer cell lines. This eliminates the byproduct found in the CBD solution used as a potential underlying effect in this experiment.
CBD
Cannabinoids can be classified as phyto–, endogenous, and synthetic cannabinoids which are derived from Cannabis sativa.30 Cannabinoids can bind to the CB1 receptor found in the central nerve tissue, and CB2 receptors in the immune system. 25,62–67
2D assay photos revealed CBD decreasing cell confluency of SK–BR–3 in 20 µg/mL initially coated with MG but no morphological distinctions with HFF–1. 20pM decreased initial adhesion HFF–1 but had no effect on SK–BR–3 initial adhesion. Decreased HFF–1 cell initial adhesion may be due to integrin inhibition due to affinity binding of CBD to CB2 receptors on HFF–1 cell surfaces. CBD effects are reversed when comparing HFF–1 and SK–BR–3 proliferation during the 7–day proliferation. HFF–1 cell proliferation appeared unaffected at every time point during the proliferation while SK–BR–3 proliferation was almost halted from day 0 to day 2 at 20pM and decreased on day 0 with increasing CBD concentration. Figure 3E shows that 20pM CBD essentially stopped SK–BR–3 proliferation from day 0 to day 2 because there was no statistically significant difference in cell presence on day 0 and day 2. In addition, there was a statistically significant decrease in SK–BR–3 cell presence between 0pM and 15pM CBD and 0pM and 20pM CBD conditions on day 2 which implies decreasing SK–BR–3 proliferation with increasing CBD concentration as early as day 2. Tight standard deviations and a strong effect on SK–BR–3 proliferation, coupled with the overlapping standard deviations and non–specific effect on HFF–1 proliferation, provide support that the trend for a CBD influence on HFF–1 proliferation can be attributed to background noise and is not CBD having an influence of HFF–1 proliferation.
There are multiple mechanisms involved with pro–apoptotic effects of cannabinoids. CBD interacts with the enzyme ceramide synthase, activating the extracellular regulated kinase, leading to cell cycle arrest. 23,27,68–70 p38 mitogen–activated protein kinase and cyclin kinase inhibitor (p27/KIP1) pathway can also be activated and lead to apoptosis. These cell cycle arrests involves the up–regulation of the p53 protein, differentiating pro– and anti–apoptotic proteins.67 CBD acts as an inverse agonist for CB2 receptor and an antagonist for CB1.69 SK–BR–3 expresses CB2 receptors leading to the inhibition of adenylyl cyclase activity which could lower cyclic adenosine monophosphate and protein kinase A activity levels.69–71 This would also down–regulate gene transcription and again, lead to apoptosis.23,27,69,72–75
The phytocannabinoid CBD inhibits cell proliferation increases apoptosis and reduces migration in different cancer cell lines.76–94 In this manuscript our data shows similar results with previous reports on CBD and breast cancer in vitro studies. The endocannabinoid system may be used to combat breast cancer due to the vast anti–cancer properties. There are significant sources of studies providing clear evidence in reducing cancer however due to its complexity with mechanisms and signaling pathways, it is still elusive. More work is necessary to determine the balance between these various mechanisms, and how they modulate cancer in vitro.
The article was written through contributions of all authors. All authors have given approval to the final version of the manuscript.
None.
Author declares that there is no conflict of interest.

©2019 Atherton, et al. This is an open access article distributed under the terms of the, which permits unrestricted use, distribution, and build upon your work non-commercially.