Advances in
eISSN: 2572-8490


Research Article Volume 4 Issue 4
State University of Ponta Grossa, Brazil
Correspondence: Moises Meza Pariona, University State University of Ponta Grossa, Campus Uvaranas - Av. General Carlos Cavalcanti, 4748 - CEP 84030-900, Brazil, Tel 55-42-32203056
Received: August 07, 2018 | Published: November 16, 2018
Citation: Pariona MM, Micene KT, Zara AJ. Al-Fe alloy processed by laser surface remelting and your influence on microstructure, microhardness and electrochemical behavior. Adv Tissue Eng Regen Med Open Access. 2018;4(4):103-110. DOI: 10.15406/atroa.2018.04.00087
An analysis was made of microstructure of hypereutectic Al-2.0 wt% Fe alloy treated by laser surface remelting (LSR), microhardness test, and electrochemical behavior test and their numerical simulation was done. Microstructure was analyzed by optical microscopy, field-emission scanning electron microscopy and Vickers microhardness tests. Results obtained in this study indicate in LSR-treatment occurred rapid heating and followed by rapid cooling, resulting in formation of a thin recast layer with a refined microstructure, with dissolution of precipitates and inclusions and formation of metastable phases, however, an overlapping line on consecutive weld fillets was observed. Furthermore, analysis of Vickers hardness were done in the cross-sectional area of treated sample and on the treated sample surface, therefore, result a greater microhardness of the treated region than untreated substrate. Through the electrochemical impedance spectroscopy (EIS) test, laser surface remelting-treated workpiece exhibit higher polarization resistance than untreated, at 11 times higher and capacitive behavior of material is related to aluminum oxide layer properties, then, microstructure characteristic caused by overlapping ratio and multi-track has a strong effect on electrochemical process. This material can be applied in the aerospace, autmovolist and implant materials used in medicine.
Keywords: laser surface remelting, Al-2.0 wt.% Fe, microstructure, microhardness, OM, FESEM, electrochemical behavior
Laser surface remelting (LSR) has attracted increasing interest in recent years owing to its special capabilities. High energy density of LSR translates into efficient use of energy for remelting, because LSR modifies surface properties of a material without affecting its bulk properties. LSR results in rapid quenching of the molten material by conduction into the cold subsurface after rapid irradiation. This type of behavior was also observed,1 who applied laser surface melting (LSM) technique in a study of high strength aluminum alloys (HSAL).
LSR technique was for a study of hypoeutectic Al-1.5 wt. % Fe alloy. Characterization of the cast region revealed the formation of a refined, dense and highly homogeneous microstructure, as well as cracking, noticeably with a high formation of protuberance on the weld fillets than alloy untreate.2,3 An overlapping line of consecutive weld fillets was also perceptible in the cast region of this alloy, which resulted in an increase of about 61% in hardness compared to the base material. The Marangoni effect4 influence thermal gradient in the molten pool a high temperature, meanwhile, also it produces effects in quality and properties of microstructure, morphological characteristic and as well as quality of laser-treated workpiece track. Yet these same authors confirmed, at low laser beam velocities, the morphology is higher and quality of track presents many defects than at high laser beam velocities.
Moreover, laser shock peening (LSP) process enables the improvement of corrosion resistance by means of increased pitting potential with lower intensity of pitting attack on the specimen’s surface.5 Was confirmed higher corrosion resistance of laser-peened friction stir-welded 7075 aluminum joints in a 3.5% NaCl solution.6 Although, during LSR-treatment in Al alloy, the melted zone was constituted of metastable phases by LAXRD analysis and it revealed the presence mainly of Al2O3 and AlN phases.2,7 These authors emphasized, which these phases contributed in the microstructural modification, favored the characteristics of high hardness and corrosion resistance of LSR-treated work piece in sulfuric acid.
This study involved LSR treatment of hypereutectic Al-2.0 wt. % Fe alloy. The sample was characterized by various techniques, including optical microscopy (OM), scanning electron microscopy (SEM), vickers micro hardness test. Analysis of Vickers hardness were done in the cross-sectional area of treated sample and on the treated sample surface. Furthermore, the electrochemical impedance spectroscopy (EIS) test was studied and their numerical simulation was done. The microstructure microhardness and electrochemical behavior of laser-treated layer were systematically investigated to correlate their properties with process involved.
Material
Hypereutectic Al-2.0 wt. % Fe alloy under study was prepared with commercially pure raw materials. The material was cast in a resistance furnace (muffle) by pouring the liquid metal into a cylindrical ingot mold and cooling in ascending mode. Resulting ingot was sectioned into various samples, which were sand blasted individually to determine the chemical composition of alloy by energy-dispersive X-ray fluorescence spectrometry (Shimadzu EDX-7000), as indicated in Table 1.
Material |
Impurity |
|||
|---|---|---|---|---|
Fe |
Si |
Cu |
Ni |
|
Al 99.76% |
0.09% |
0.06% |
0.06% |
0.03% |
Fe 99.97% |
- |
0.01% |
0.01% |
0.01% |
Table 1 Chemical composition of materials used for manufacture of Al-2.0 wt. %Fe alloy
Laser surface treatment
In this research, Al-2.0wt% Fe alloy was subjected to laser surface remelting (LSR), without gas protection, with the purpose of generating metastable phases, using a 2 kW Yb-fiber laser (IPG YLR-2000S) in order to examine treated and untreated layers. LSR treatment was performed in a laboratory at Institute for Advanced Studies (IEAv) of Aerospace Technical Center (CTA–ITA) in São Jose dos Campos, SP, Brazil. A laser scanning speed of 40mms−1 was applied. Average power of the laser beam was set at 600 W and the power density on the sample surface was estimated at 4.8×10⁵W cm−2. Laser-treated samples were covered with several weld fillets during the remelting process.8
Equipment for microstructural and morphological characterization
Various microstructural characterization techniques were employed to gain a better understanding of microstructural effects of Al–2.0 wt. %Fe alloy LSR-treated under study. These techniques applied were optical microscopy (OM), field-emission scanning electron microscopy (FESEM) coupled to energy dispersive spectroscopy (EDS) and Vickers microhardness testing, which are described in detail below. LSR treated samples were analyzed by OM (Olympus BX51) couple to a Q-Color 3 digital camera to capture images. Prior to studying the LSR treated layer, the cross-sections were cut of the samples using a diamond blade and they were sanded and polished. Samples were chemically etched with hydrofluoric acid 0.5 % (v/v) at intervals 30 to 45 seconds, after they were polished with metallographic polishing pads, using only water, to ensure LSR treatment would not be impaired. Laser-treated material and substrate were analyzed by FESEM (MIRA 3 LM) coupled to EDS to examine the microstructural changes caused by laser treatment.
Vickers micro hardness testing
Vickers hardness (HV) tests were performed using a Leica VMHT MOT microhardness tester operating with a load of 0.1 kg at 15 seconds (HV 0.1 15s). The tester was applied in the cross-sectional area of treated specimen, to different penetration depths until it reached the base material. Penetration depths of the tester from the surface in the treated material region were approximately 50µm, 100µm and 200µm, however, 300µm, 500µm and 700µm were in the base material region, as shown schematic in Figure 1. At each of these depths, 15 micro-indentations were made in lines parallel to surface. Average hardness and standard deviation at each of selected depths were calculated based on data obtained? (Figure 1).
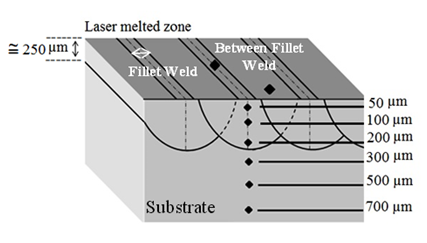
Figure 1 Schematic diagram of weld fillets on the sample surface and in the cross-sectional area showing the penetration depth of Vickers indenter in LSR-treated sample.
For preparation of HV tests, a cross-sectional sample was sanded with 600 and 1200 grit sandpaper and polished with colloidal silica to reduce its roughness, thereby preventing roughness that could interfering in results of HV measurements. Besides, microhardness was measured on the laser-treated sample surface, which was cleaned only with water to prevent that it could be modified. Furthermore, the material’s hardness was tested on the weld fillets region and between them.
Electrochemical impedance spectroscopy (EIS) test
The electrochemical impedance spectroscopy (EIS) test was performed in aerated solution of 0.1 M H2SO4 at a temperature of 25 °C±0.5 °C, using Autolab PGSTAT 30 potentiostat system connected to a microcomputer. Working electrodes of surface-treated and untreated samples were prepared with epoxy resin to expose a top surface.
Surface characterization of laser-treated samples
Figure 2 illustrates the morphology of hypereutectic Al-2.0 wt. % Fe alloy laser-treated analyzed by OM and FESEM, showing characteristics of the weld fillets formed during laser treatment. OM image in Figure 2(a) shows the surface morphology, while FESEM image in Figure 2(b) shows the morphology in more detail on the weld fillets region and between the weld fillets. As can be seen, on the weld fillet region contains a higher concentration of defects than between the weld fillets region. Reported a similar result.1,9 In Figure 2(b), the distance between the weld fillets is approximately 300 µm. Note the presence of several nanopores, which may be attributed to volatilization of inclusions or vaporization of the substrate itself, caused by hydrogen and moisture in the atmospheric air, which are absorbed in the laser-treated region, favoring the formation of pores and these results are consistent.2,10 The micrograph in Figure 2(c) shows on the weld fillets region under higher magnification, showing concentration of defects in more detail. Figure 2(d), also at increased magnification, shows between the weld fillets region, revealing a more uniform morphology with a columnar-like structure. Was also observed these structures in Al-1.5 wt % Fe,2,11 these last authors stated that Al-Co-Ce alloys contain Al-rich eutectic regions whose structure and was similar to Al-2.0wt.% Fe alloy. Peculiar characteristics of the microstructure shown in Figure 2 (d), so it presented highly improved properties, such as: hardness, corrosion and wear resistance, which is resulted of precipitates dissolution and formation of metastable phases, to respect, several authors have reported similar results (Figure 2).2,12–16

Figure 2 (a) OM, and (b) FESEM images of the morphology of hypereutectic Al-2.0 wt% Fe alloy LSR-treated surface, showing regions on the weld fillet and between the weld fillets, (c) on the weld fillet region at increase magnification, and (d) between weld fillets region under higher magnification.
In2 analyzed hypoeutectic Al-1.5 wt. % Fe alloy LSR-treated and observed presence of microcracks between the weld fillets. However, this phenomenon in this study was not observed in hypereutectic Al-2.0 wt% Fe alloy LSR-treated, as can be seen in Figure 2. Absence of microcrack was expected, because, according to17 formation Al-Fe alloys is impaired, when the material contains coarse Al3Fe particles or intermetallic phase, which tend to produce microcracks and reduce formability, whereas, this does not occur with presence of Al6Fe finely dispersed in Al-2.0 wt. % Fe alloy, however, the Al3Fe intermetallic phase does not appear in this alloy, as demonstrated Pariona7 by low-angle X-Ray diffraction analysis. Meanwhile, in Gremaud18 reported, increasing the cooling rate of hypereutectic alloys containing up to 9 wt. % of Fe suppresses formation of stable Al3Fe phase, which is replaced by Al6Fe phase, which confirms our result.
Characterization in the cross-section of laser-treated and untreated materials
Figure 3 shows the cross-sectional analysis by OM. In this region can be observed the penetration depth of the treated region was around 250 µm, and the distance between the weld fillets was approximately 300 μm (also was shown in the first micrograph, Figure 2). Note clearly visible difference of the treated region microstructure and of the substrate.
The laser melted surface micrograph is shown at Figure 3, as can be seen it is free of microcracks and the melted regions are free of precipitates too. Fine microstructure of the melt zone is attributed to high cooling rate. Microstructure obtained in this work is similar to other laser melted aluminum alloys reported in the literature, i.e., in Watkins19 was reported that the microstructure of laser melted AA 2014 consists of columnar grains growing epitaxially from the substrate. Although, maximum melt depth observed in this work was 250µm (Figure 3) however the thickness of this zone depends of laser power and of the Maragoni effect,4,8 these authors demonstrated when the laser beam velocity is low, therefore the molten zone depth is greater.
Figure 3 also shows zones where there is overlapping of consecutive weld fillets. This overlapping is more common in Al-2.0 wt. % Fe alloy than in Al-1.5 wt. % Fe alloy.2,3,8 In Kalita1 also reported overlapping of consecutive weld fillets and20 pointed out as essential tool to understand way in which each track affects the microstructures produced by previous one figure 4 depicts a cross-sectional LSR-treated sample and analyzed by SEM, showing some regions of substrate and the as-cast microstructure. In the cast area in Figure 4, note presence of protuberances, which correspond to on the weld fillet region (Figure 3). According to Pariona4 presence of protuberances is more noticeable in Al-1.5 wt. % Fe alloy than in Al-2.0 wt. % Fe alloy. Figure 4(a) also shows an overlapping line of consecutive weld fillets. Figure 4 show the substrate region and the laser-treated area under higher magnification, showing a visibly different microstructure, with a dendritic-like structure. This microstructural difference between untreated substrate and LSR-treated region is attributed to temperature applied on the material surface, which exceeded its melting point but was lower than boiling point, followed by rapid cooling in laser treatment process and this leads a high thermal gradient, and so in this way produces the laser melted zone. This treatment resulted in formation of a thin recast layer with a refined microstructure practically free of precipitates, inclusions and intermetallic phases,18 as can be clearly seen at the magnified image, Figure 4(d), with a columnar dendrite structure, have also reported this characteristic in laser cast materials.19–21 Figure 4(c) shows the substrate region, which is also displayed under higher magnification in Figure 4(f), showing presence of intermetallic phase dispersed in the matrix. A comparison in more detail of Figure 4 reveals that the treated region morphology is more homogeneous, without presence of the intermetallic phase that extends throughout the recast area and showing evidence of transition from coarse-grained to fine-columnar-dendrite structure. According to Pariona,2 behavior of the laser treated region is homogeneous and similar to an amorphous phase; hence, it shows greater hardness, lower surface roughness, and higher corrosion resistance.7
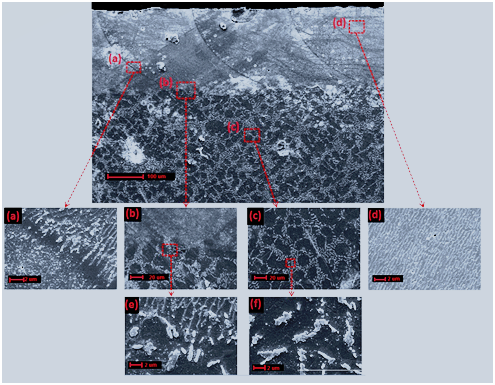
Figure 4 SEM micrograph in the cross-sectional sample of Al-2.0 wt.% Fe alloy LSR-treated: (a) overlapping line of consecutive weld fillets, (b) interface of treated surface and substrate, (c) substrate unaffected by laser treatment, (d) detail in the cast region, (e) interfacial region of the treated surface and substrate, and (f) detail of the substrate unaffected by laser treatment.
Vickers hardness test was accomplished in this work and by means of a microscope coupled to the tester, the “d1” and “d2” diagonals formed in area indented by pyramid were measured, and these parameters were used to calculate Vickers hardness. Figure 5 illustrates indented areas used for calculation of the hardness of Al-2.0 wt. % Fe samples.

Figure 5 (a) Area indented by HV tester in Al-2.0 wt.% Fe sample, (b) deformed region shown under higher magnification.
Microhardness profiles were measured along in a cross-sectional sample, for laser-treated layer and untreated. These measurements were taken along lines parallel to surface at depths of 50, 100, 200, 300, 500 and 700 µm, applying a load of HV 0.1 for 15s. Figure 6 illustrates the 15 micro-indentations made in the cross section at each of these depths to measure the hardness. Average hardness values and standard deviation (s.d.) at each depth were calculated based on these measurements, and are given in Table 2.
Region |
Depth |
Average of VH |
S.d |
Treated region |
50 |
59 |
3.15 |
100 |
60 |
3.8 |
|
200 |
57.4 |
3 |
|
Untreated region |
300 |
36.5 |
1.43 |
500 |
35.2 |
1.44 |
|
700 |
35.4 |
1.68 |
Table 2 Vickers hardness Analysis in a cross-sectional area, in sample treated and untreated (VH 0.1 15s)
An analysis of the data in Table 2 indicates the HV is higher for the LSR treated region than the untreated region. The average hardness of the treated region is 58.8 HV, while that of the untreated region is 35.7 HV, which corresponds at 60.7% increase in hardness in the treated region compared to the untreated region.
The data in Table 2, also is shown in graphical form in Figure 7, it clearly show increase in hardness at treated region than untreated substrate. This difference is attributed to microstructural changes as resulting of LSR-treated. In other studies involving LSR treatment of materials, similar results have been obtained by Ref 19 and others, who reported a significant increase in hardness in laser-treated region than untreated region.
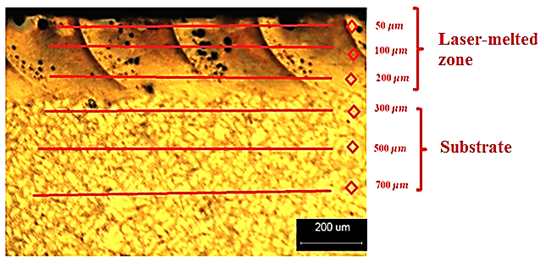
Figure 7 OM image in the cross section of Al-Fe sample laser-treated, indicating the depths selected for microhardness measurements.
The material surface hardness was also analyzed by HV measurements on the weld fillets region and between them (Figure 3-4), for the as-received laser-treated sample. The average Vickers hardness was calculated for 15 micro-indentations made on the weld fillets and between the weld fillets, as indicated in Table 3.
Region |
Average of HV |
Standard deviation of VH |
On the weld fillets wefillets |
52.68 |
6.18 |
Between the weld fillets |
59.14 |
5.53 |
Table 3 Analysis of Vickers hardness on the treated sample surface, indicating the hardness at the regions on the weld fillets and between the weld fillets (VH 0.1 15s)
As can be seen in Table 3, the HV values measured on the sample surface are consistent with those measured in the cross-section too, so showing a higher average hardness at the region between the weld fillets than on the weld fillet. Was made a comparative analysis3 of the HV of Al-1.5 wt. % Fe alloy measured on the weld fillets and between the weld fillets, also reported that the hardness between the weld fillets was higher than on the weld fillets, therefore, the surface hardness in the laser-treated region in relation to the untreated region is high, due to the treated region morphology is more homogeneous, without presence of intermetallic phase (Al3Fe) and with the presence of Al6Fe phase finely dispersed in the matrix that extends throughout the recast area, as can be checked in Figures 2-4.
Present study focused on the microstructural characterization of hypereutectic Al-2.0 wt. % Fe alloy, while previous studies2–4 involved hypoeutectic Al-1.5 wt. % Fe alloy. Although both alloys were castings and solidified by laser-treated process in the same conditions, however, microstructural analysis of the two alloys revealed characteristics different. The overlapping line of consecutive weld fillets at the cast zone of Al-1.5 wt. % Fe alloy was barely perceptible than Al-2.0 wt. % Fe alloy. In addition, also in the cast zone, presence of protuberances on the weld fillets was much more noticeable at Al-1.5 wt. % Fe alloy than at Al-2.0 wt.% Fe alloy. However, Al-1.5 wt. % Fe alloy showed a behavior lamellar at the cast zone and meanwhile Al-2.0 wt.% Fe alloy showed a behavior fine-columnar-like structure. Both alloys showed nanopores, which were concentrated mostly on the weld fillets. The microhardness of Al-2.0 wt. % Fe alloy LSR-treated surface was slightly more higher than Al-1.5 wt. % Fe alloy.
Influence of microstructure on electrochemical behavior
Electrochemical impedance spectroscopy (EIS) after a longer immersion time of 3300 s (Ecorr) was also carried out. EIS experiments were performed at open circuit potential over a frequency range of 0.1–100 kHz. The sinusoidal potential perturbation was 5 mV in amplitude. Figure 8 shows Nyquist plots for untreated and LSR-treated alloys in aerated 0.1 M H2SO4 at a temperature of 25°C±0.5°C, after 3300 s immersion. Pointed out,5 which EIS technique is probably one of the most powerful nondestructive steady-state methods in electro-chemistry. EIS enables us to determine different parameters of equivalent electrochemical systems (capacitance, resistance, electrolyte interface, etc.). Moreover, suggested22 that EIS spectra obtained over a wide range of frequencies indicate that the technique is right choice, since it is applicable for evaluating complicated corrosion processes (Figure 8).
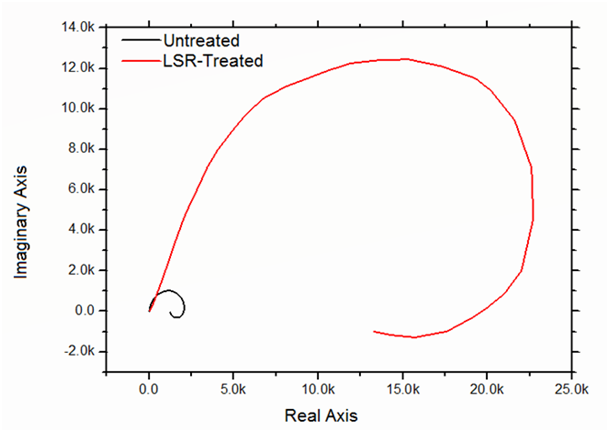
Figure 8 Nyquist plots for untreated and LSR-treated alloys in aerated 0.1 M H2SO4 at a temperature of 25°C.
By analyzing the diagram of Figure 8, presence of capacitive loops is observed at high frequencies and inductive loops at low frequencies. However, it is seen that LSR-treated workpiece exhibit higher resistance compared to untreated (as received) workpiece, at all immersion times, this result is in agreement with result studied.5,23 Capacitive behavior of material is related to aluminum oxide layer properties, according to study,7 while inductive behavior can be attributed with active state of aluminum surface present in studied electrolyte. Passive regions refer to the oxide layer on aluminum, argued7,24 that LSR-treated sample resulted in reduction of current density, and this fact indicates a lower corrosion, therefore, LSR-treated workpiece showed clearly a wide passive zone.
Electrochemical parameters obtained for Al–2.0 wt. %Fe alloy LSR-treated and untreated are shown in Table 4. Where, Rs is the polarization resistance of M H2SO4 solution. Cdl and RP are attributed to the electric double layer capacitor and the resistance of passive layer, respectively. It can be seen that results obtained for Rp are very close to those obtained through of potentiodynamic polarization curves, investigated for same alloy by Ref 7, thus indicating reliability of presented results. It was also noted that LSR treatment provided the formation of thicker aluminum oxide when compared to untreated workpiece.8 According to result of Table 4, based on the values of Rp, LSR-treated layer presents greater resistance to charge transfer at electrode/solution interface in relation to untreated workpiece. Then, it can be emphasized that treated sample is more resistive than untreated workpiece, at 11 times higher. However, LSR-treated workpiece showed lower electric double layer capacitor values than untreated material. These results once again report that RSL treatment is an efficient technique to improve corrosion behavior of Al–2.0 wt.% Fe alloy in sulfuric acid medium, thus, demonstrated5 improvement of corrosion resistance by means of increased pitting potential with lower intensity of pitting attack on the specimen’s surface due to laser shock peening (LSP).
Material |
Rs |
Rp |
Cdl |
|---|---|---|---|
Polarization resistance |
Resistance of passive layer |
Electric double layer capacitor |
|
Treated |
22 Ω |
22.6 KΩ |
1.94 µF |
Untreated |
22 Ω |
2.07 KΩ |
3.4 µF |
Table 4 Electrochemical parameters for Al–2.0 wt. %Fe alloy LSR-treated and untreated
There are several opinions and controversies of authors around pseudo-inductive that it presents themselves in EIS technique. According to Zhang,24 the pseudo-inductive behavior was observed on microcapillaries. Which in many cases, loops emerging in the low-frequency range are wrongly called inductive.25 In opinion of these last authors, the pseudo-inductive behaviors are caused by drift and corrosion and can be explained by so-called negative capacitance effect.
According to impedance spectroscopy technique, it was possible to characterize electric behavior of treated layer and to design the values of equivalent circuit (EC) formed by resistors, capacitors and inductors. In were fitted a proposed of the equivalent circuit, designed from Matlab software, the following the model suggested by Zhang.26 EC proposed (Figure 9) describe this system, where is given by Rs, which represents the solution resistance, Cdl is the electric double layer capacitor, Rp is the polarization resistance, R1 is the inductive resistance and L is the inductive element. The Rs, Rp and Cdl data were obtained experimentally by potentiostat software. However, L has no way to measure, for this a computational adjustment was made by Matlab software, using the circuit of Figure 9, then, for untreated sample, the corresponds values were found, for L = 1000 H and for treated sample was L=5000 H. Figure 10 and Figure 11 show experimental results that were overlaid with simulated data for untreated and LSR-treated workpieces, respectively, thus, curves presented a good fit for the untreated case (Figure 10), where experimental and simulated values are very close.
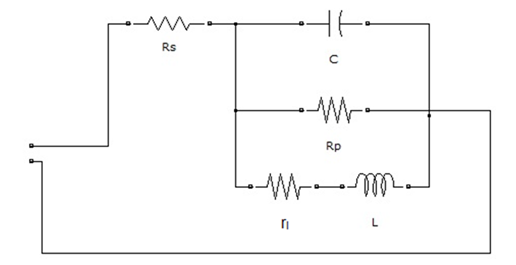
Figure 9 Electric behavior of an untreated work piece and treated layer. A proposed of the equivalent circuit.
Moreover, for LSR-treated case, curves did not present a good fit (Figure 11), experimental and simulated values are quite different. This is because, after LSR-treated, treated layer is composed of metastable phases, mainly consisting of alumina and aluminum nitride, besides, microstructure showing multiple laser tracks characteristics formed during laser treatment, however, the molten pool zone showed a fine microstructure due to high quenching rates applied, meanwhile, Guan et al.,28 argued, which laser beam tracks has significant influence on surface quality of laser-treated materials. Consequently, LSR-treated layer has a very complex feature; with certainly, EC proposed should be more complex for LSR-treated.
Different authors reported several investigations about this study, which microstructure characteristic caused by overlapping ratios and multi-track, influence on electrochemical behavior or laser multi-track overlapping and consequently in effect of corrosion process. According to previous works,27 that overlapping tracks affect heat transfer and liquid flow, microstructure evolution, further, pointed out20 as essential tool to understand way in which each track affects the microstructures produced by previous one. On the other hand, argued28 that overlapping is important in determining corrosion resistance due to microstructure in-homogeneities in the molten pool.
However, was noted in existence of increase in corrosion resistance comes as a result of homogenization and microstructure refinement, which is due to the surface layer melting, as well as through decreases electrical conductivity of resultant passive layer, still these same authors argue, laser surface melting is a useful method for corrosion protection of friction stir weld surfaces as a result of improved microstructure and phase distribution. Nevertheless, reported in Watkins,19 laser surface treatments offer significant potential for improvement of materials properties such as corrosion performance and wear resistance.
Potentiodynamic polarization tests showed14 as a result of laser treatment, the corrosion current can be reduced by as much as six times, and a passive region was obtained. Besides, analysis of electrochemical impedance measurements showed that at an open-circuit potential (OCP), the polarization resistance and double-layer capacitance of the film electrolyte interface of laser-treated specimen were one order of magnitude higher and six times lower than that untreated specimen, respectively.
Since then, hypereutectic Al-2.0 wt. % Fe alloy laser-treated is very peculiar and that it has very special characteristics. Therefore, in this study the influence of microstructural characteristic on microhardness and electrochemical behavior was demonstrated clearly, thus it has an innovative character and can be applied in aerospace, aeronautical and automobile industries. Which overlapping adjacent traces as a result of multiple passes using scanning laser beam is usually adequate for production of area coverage.28 It has long been realized that laser beam overlapping may play a significant role in influencing final surface properties of laser-treated materials.
This research involved a study of hypoeutectic Al-2.0 wt. % Fe alloy subjected to a laser surface remelting (LSR) treatment. The main results are the following:
This work was entirely financed by CNPq (Brazilian National Council for Scientific and Technological Development), Fundacao Araucaria (FA), CAPES (Federal Agency for the Support and Evaluation of Postgraduate Education), and FINEP (Research and Projects Financing Agency). We also thank to LABMU-UEPG.
Author declares that there is no conflict of interest.

©2018 Pariona, et al. This is an open access article distributed under the terms of the, which permits unrestricted use, distribution, and build upon your work non-commercially.