Advances in
eISSN: 2572-8490


Research Article Volume 3 Issue 1
1Center for Cardiovascular Biology, University of Washington, USA
2Institute for Stem Cell and Regenerative Medicine, University of Washington, USA
3Department of Pathology, University of Washington, USA
4Department of Internal Medicine, National Cheng Kung University, Taiwan
5Department of Genome Sciences, Fred Hutchinson Cancer Research Center of Washington, USA
6Department of Medicine/Cardiology, University of Washington, USA
7Department of Radiology, University of Washington, USA
8Department of Pathology, National Cheng Kung University, Taiwan
Correspondence: Charles E Murry, Institute for Stem Cell and Regenerative Medicine, Center for Cardiovascular Biology, University of Washington, Box 358050, Seattle, Washington 98109, USA, Tel 206-616-8685, Fax 206-897-1540
Received: September 26, 2017 | Published: October 24, 2017
Citation: Liu YW, Iwata M, Minami E, et al. A clonal population of allogeneic bone marrow fibroblasts indirectly mitigates damage in myocardial infarction. Adv Tissue Eng Regen Med Open Access. 2017;3(1):304–315. DOI: 10.15406/atroa.2017.03.00055
Background: Reports of cell-based cardiac repair have been inconsistent, both among studies and within a single study. This is particularly true in response to the infusion of various preparations of marrow cells including mesenchymal stem/stromal cells (MSC). While there are many potential explanations for these inconsistent outcomes, we hypothesized that heterogeneity among the cells infused may be a contributing factor. To address this possibility we used an immortalized clonal population of canine marrow fibroblasts (DS-1) as a consistent therapeutic infused 2 weeks after an ischemia-reperfusion induced myocardial infarction (MI) in the canine model.
Methods and results: MI was induced in six dogs through percutaneous trans luminal catheterization. At 2 weeks post-MI, cardiac magnetic resonance (CMR) imaging demonstrated deterioration of left ventricular (LV) ejection fraction (EF) in all six dogs. After this initial CMR study, dogs were infused intravenously with either vehicle (as control) or DS-1 cells (107cells/kg). At 4 weeks post infusion, (6 weeks post MI) the DS-1 treated dogs had significantly better preserved LVEF (54.2±1.2 %) compared to control dogs (47.6±2.3 %; p=0.01). The DS-1 treated group also had better LV diastolic function compared to controls (15.2±1.2 compared to 23.0±1.0, respectively; p<0.001) for left atrial volume index; and 7.3±1.2 vs. 14.6±1.3, respectively, p=0.002 for mitral E/e’). Although there was no statistically significant difference in arteriole density and fibrotic/infarct size between these two groups, the DS-1 treated animals had an increased amount of uniform collagen orientation, indicating a more parallel alignment of the collagen fibers in the treated dogs, which may have contributed to improved diastolic function.
Conclusion: Our study demonstrated a therapeutic benefit of a single intravenous infusion of DS-1 cells during the subacute MI period. Based on cell out-growth and DS-1 specific PCR assays there were no detectable DS-1 cells in the dogs after 48hours. This corroborates previous studies that also indicated DS-1 cells do not engraft, but are sequestered and cleared in the lung within 48 hours. Given that circulating monocytes express activation antigens within hours of DS-1 infusion and that we previously showed monocytes in contact with this class of fibroblasts express genes associated with multicellular organismal development, we hypothesize that the DS-1 effect is indirect and mediated by monocyte derived activities. Further research is warranted to determine the precise mechanism responsible for this therapeutic benefit.
Keywords: myocardial infarction, marrow fibroblasts, ds-1 cells; cardiac function, cardiac fibrosis
In a previous study of radiation-induced lung fibrosis, we showed that a single intravenous infusion of an unrelated clonal population of canine bone marrow-derived fibroblasts, DS-1 cells, significantly reduced lung fibrosis, improved pulmonary function, and prevented the progression of lung injury.1,2 The single infusion of DS-1 cells was given 5 weeks after irradiation when a lesion could be documented by CT scan. Pulmonary function tests performed again at 13 and 26 weeks post irradiation showed significantly better function in the DS-1 treated dogs. This result could not be attributed to engraftment of DS-1 cells since these cells were cleared within 48 hours of infusion. The infusion of the DS-1 cells, however, was associated with activation of circulating monocytes and the detection of endothelial precursors in the blood.
The demonstrative effect of DS-1 infusion on the reduction of progressive fibrosis in the lung prompted us to test the effect of DS-1 infusion on fibrosis in other tissues, in this case fibrosis that develops as a consequence of a myocardial infarct. After a myocardial infarction (MI), the heart repairs itself through wound healing, resulting in cardiac fibrosis, remodeling, and eventual deterioration of cardiac systolic and diastolic function.3,4 Although therapeutic improvements of post-MI treatments give rise to significant decline in mortality, the goal of these standard therapies (i.e. antiplatelet therapy, HMG-CoA reductase inhibitors, β-antagonists, angiotensin converting enzyme inhibitors/angiotensin II receptor blockers) is to prevent recurrent adverse cardiovascular events as well as post-infarct left ventricular (LV) remodeling. However, none of these treatments are able to impact post-MI myocardial loss.5 Over the past 10 years, cell therapies for post-MI have been explored as potential therapeutic options for improvement in cardiac systolic dysfunction and “replacement” of lost cardiomyocytes.6,7 However, this line of investigation has been both disappointing and controversial, as consistent results have not been reported.8–17 Among the variables that potentially contribute to inconsistencies and which is largely overlooked, is the preparation and functional qualities of the cells infused.
The current study addresses this one area of inconsistency by using a quality controlled preparation of functionally defined cells. Previously we demonstrated that primary cultures of marrow stromal cells contain varying proportions of functionally distinct stromal cells as well as macrophages.18 To prepare a cell population for study, we immortalized canine cells in the primary culture and isolated several distinct clones of dog stromal (DS) cells. The clone selected for study was designated DS-1. It was selected by its transcriptome profile which closely resembled that of the human stromal clone, HS27a. A considerable body of evidence indicates HS27a cells activate monocytes, driving them to a tissue macrophage fate, and inducing their expression of proteins associated with organismal development.19 We speculated that the endogenous recovery observed in the irradiated lung could be the consequence of DS-1 stimulated macrophages. Our goal in the current manuscript was to determine whether “endogenous recovery” could be detected in another tissue.
All the animal experiments were conducted according to the principles outlined in the Guide for Laboratory Animal Facilities and Care prepared by the National Academy of Sciences, National Research Council. The Institutional Animal Care and Use Committee (IACUC) of Fred Hutchinson Cancer Research Center (FHCRC), an AAALAC facility, approved the research protocol (FHCRC IACUC File #1805). Fred Hutch has an approved Animal Welfare Assurance (#A3226-01) with the Office of Laboratory Animal Welfare and all research involving live vertebrate animals at Fred Hutch complies with all applicable provisions of the United States Department of Agriculture (USDA license #91-0025) Animal Welfare Act. All dogs are socially housed when applicable, provided food and water ad libitum and are clinically assessed twice daily by Fred Hutch Comparative Medicine staff.
Myocardial infarction model
Six adult mongrel dogs (5 male and 1 female, weighing 13.9 to 18.1 kg) were purposely bred by FHCRC or purchased from Class “A” vendors (Table 1). All of the MI procedures were performed under general anesthesia.
As previously described,20 using percutaneous transluminal coronary artery catheterization techniques, we created myocardial infarction via ischemia-reperfusion (I-R) injury. We used a specialized shape guiding catheter to engage the left coronary artery and then inflated a percutaneous transluminal coronary angioplasty (PTCA) balloon catheter (2.5mm/8mm, ApexTM monorail balloon catheter, Boston Scientific) with 6-10atm for 90 minutes to occlude all flow distal to the first diagonal branch of the left anterior descending coronary artery (LAD).20,21 MI was confirmed by ECG and subsequent post-MI 24-hour serum cardiac troponin I (cTnI) assay (Phoenix Central Laboratories, Everett, WA). Pre-emptive and post-MI analgesia was provided through a 50 microgram/hour Fentanyl patch applied to the dog’s shaved tail from Day -1 through Day 1. After MI surgery, the dogs were recovered to consciousness in the surgical suite, then monitored for 6 hours post-recovery within the clinic and evaluated at least twice daily thereafter.
Microsphere study
Using nonradioactive, isotopic microspheres (15µm, STERI spheres, BioPAL), regional myocardial blood flow was measured.22,23 This technique uses tracer microspheres that embolize to pre-capillary arterioles in direct proportion to blood flow, with different isotopes used to compare blood flow changes over time. The microspheres were sonicated to prevent clumping and thoroughly mixed by vortexing before injection. Using a pigtail catheter, Gold STERIpheres (5x10⁶ spheres) and Samarium STERIpheres (5x10⁶ spheres) were injected into the left ventricle over 20seconds prior to inflating and deflating the PTCA balloon, respectively. This method allowed us to compare blood flow to the healthy heart at baseline and blood flow from any collateral vessels during ischemia. To obtain final levels of blood flow after cell or sham therapy, Lutetium STERIpheres (5x10⁶ spheres) were injected into the left ventricular lumen prior to euthanasia at 4 weeks post-treatment. For all blood flow measurements, a reference blood sample was withdrawn from the femoral artery beginning just prior to microsphere administration at the rate of 6mL/min for 1.5 minute for calculation of myocardial blood flow. After euthanasia, the myocardium of the central ischemic area and the remote area (the baso-inferior part of left ventricle) were collected. All the tissue and blood samples were sent to BioPAL, Inc. (Worcester, MA) for analyses of isotope content via neutron bombardment.
Cell preparation and intravenous (i.v.) infusion
DS-1 cells are clonal marrow fibroblasts derived from a primary culture of canine bone marrow stromal cells. The DS-1 line was one of 20 immortalized canine cell lines established from a single dog under Fred Hutch IACUC and Environmental Health and Safety approval and the repository is maintained within the Torok-Storb lab.1,24 They were established by immortalization using HPV E6/E7 genes according to the procedures described previously for human marrow stromal cell lines.2,24 DS-1 cells were cultured in DMEM medium, supplemented with 10% fetal bovine serum, L-glutamine (0.4mg/mL), sodium pyruvate (0.1mmol/L), penicillin (100U/mL), and streptomycin sulfate (100pg/mL). At 2 weeks after myocardial infarction, DS-1 cells were treated with trypsin, harvested and washed with Hank’s Balanced Salt Solution (HBSS), filtered through a cell strainer (BD Falcon, Bedford MA) to remove cellular aggregates, and suspended in USP 5% dextrose solution (Abbott Laboratories, North Chicago, IL). Thirty to 45minutes prior to infusion all dogs received 1.5mg/kg intravenous diphenhydramine to prevent an allergic reaction. The DS-1 cells (107cells/kg) were intravenously injected at 2mL/min in a 30mL volume. For control, an equal volume of vehicle (30mL of USP 5% dextrose solution) was intravenously infused.
Assessment of LV function
Transthoracic echocardiography: All the echocardiographic images were acquired by one qualified cardiologist, using an ultrasound system with a 7MHz probe (Vivid-7, GE Healthcare, Horten, Norway) at the following time points: prior to MI, 14 days after MI (prior to intravenous cell infusion), and prior to euthanasia (Figure 1A). The animals were sedated with BAG (butorphanol 0.1mg/kg iv, acepromazine 0.025mg/kg iv, glycopyrrolate 0.011mg/kg iv) or diazepam alone (0.275-0.55mg/kg iv) or diazepam with acepromazine. The dogs were then examined in the prone position to acquire 2-dimensional gray-scale images in 3 standard apical views (i.e. apical 4-chamber, apical 2-chamber, and apical long-axis) for 4 cardiac cycles. Based on the recommendation of the American Society of Echocardiography,25 left atrial volume index (LAVi) and the ratio of early transmitral velocity to tissue Doppler imaging (TDI) annular early diastolic velocity (E/e′) were used to assess LV diastolic function. Pulsed-wave Doppler was acquired to measure the peak early wave velocity (E) of the mitral inflow and the TDI early diastolic velocities (e’) at the septal mitral annulus. E and e’ were measured at 3 end-expiratory beats and averaged for further analysis.
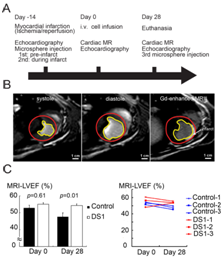
Figure 1 Study protocol and LV systolic function evaluation by cardiac magnetic resonance imaging (CMR).
Off-line analysis was performed using automated function imaging software (EchoPAC work station, BT09, GE Healthcare, Israel) by 2 independent cardiologists blinded to experimental conditions. Peak systolic longitudinal strain was automatically obtained from the 3 standard apical views. The average peak systolic longitudinal strain value from the 3 apical views is defined as GLS.26,27
Cardiac magnetic resonance imaging (CMR): In vivo imaging studies were conducted on a 3T Achieva clinical scanner (Philips, Best, Netherlands). On day 0 (the DS-1 or vehicle infused date) and day 28 (the end of the study), we did CMR studies following the echocardiographic study on the same day. During CMR scanning, the animals were sedated with acepromazine (0.025mg/kg, iv), atropine (0.04mg/kg, iv), and butorphanol (0.1mg/kg, iv), and anesthetized with Propofol (0.1-0.44mg/kg, iv).CMR protocol included CINE imaging for assessment of LV systolic function. CINE images were acquired with a balanced turbo field echo sequence that generated 30 cardiac phases for 10-12 short axis slices spanning the left ventricle. Acquisition parameters included a repetition time of 3.9msec, echo time 1.9msec, a 45degree flip angle, 4mm slice thickness without gap between slices, field of view 200x200mm, giving an in-plane resolution of 2mm×1.7mm. LV endocardial boundaries were interactively traced at end-diastole and end-systole using standard cardiac analysis software (Philips, Best, Netherlands) to obtain end-systolic volume (ESV), end-diastolic volume (EDV). Papillary muscles were excluded from the LV chamber volume calculations. LVEF was calculated as [(EDV-ESV)/EDV]*100%.
To quantify infarct size, 0.1 mmol/kg gadopentetatedimeglumine (Magnevist, Bayer HealthCare Pharmaceuticals Inc.) was manually injected as a bolus via iv catheter. At 10min after injection, delayed-enhancement images were acquired with an inversion recovery (IR) gradient echo pulse sequence. Acquisition parameters included inversion time~600ms; slice thickness 5mm, repetition time 6ms, echo time 3ms, a 25 degree flip angle, 4 signal averages, image resolution 1.6pixels/mm. Exact inversion time was found based on a lock-locker pulse sequence acquired before the IR acquisition. Infarct size was expressed as percent of the enhanced area of LV to the total LV area in all short axis slices.
Endothelial-like cell (ELC) colony and variable number tandem repeat (VNTR) assays
In the setting of radiation-induced lung injury, infusion of DS-1 mobilizes a population of endothelial-like cells (ELCs) into the circulation.2 We assessed if a similar phenomenon occurs in the context of myocardial infarction by collecting peripheral blood mononuclear cells (PBMCs) and isolating them over a Ficoll-Hypaque step gradient. At each time point, 10million PBMCs were plated in a T75 flask with RPMI medium containing 5% fetal bovine serum and cultured for 1 week without changing the culture media. Non-adherent cells were discarded and the cells attached to the flasks were cultured for an additional 4 weeks. The cultures were fed fresh media weekly. ELC colonies larger than 2mm in diameter were scored. The presence of DS1 cells in the cultures or in cardiac tissue or blood was thoroughly examined by quantitative fluorescent VNTR analysis of microsatellite loci. Primers 2360F (CATTGATGCTGAATTTGACTTC) and 2360R (TTACACACACTATTTTGCTGGTCA) were used to amplify a 290b.p. region of canine chromosome 15 (53,497,250-53,497,560) containing a microsatellite that distinguishes DS1 cells from each of the recipient animals.28–30 The analysis was conducted by the Genotype Tracking Laboratory of the Core Center for Excellence in Hematology (U54 DK 106829) at the FHCRC.2,30
RNA-seq expression assay
RNA-seq libraries were prepared from total RNA of DS-1 cells by using the TruSeq RNA Sample Prep Kit (Illumina, Inc., San Diego, CA, USA) and library size distributions were validated using an Agilent 2200 TapeStation (Agilent Technologies, Santa Clara, CA, USA). Additional library QC, blending of pooled indexed libraries, and cluster optimization was performed using Invitrogen Qubit® 2.0 Fluorometer (Life Technologies-Invitrogen, Carlsbad, CA, USA). RNA-seq libraries were pooled (6-plex) and clustered onto a flow cell lane using an Illumina cBot. Sequencing performed using an Illumina HiSeq 2500 in high-output mode employed a paired-end, 50 base read length (PE50) sequencing strategy. Image analysis and base calling were performed using Illumina's Real Time Analysis v1.13 software, followed by 'de-multiplexing' of indexed reads and generation of FASTQ files using Illumina's CASAVA v1.8.2 software (http://www.illumina.com/software.ilmn). Reads of low quality were filtered out prior to alignment to the Ensembl's CanFam3.1 release 70 using TopHat v2.0.5. Counts were generated from TopHat alignments for each gene using the Python package HTSeq v0.5.3. A filter was applied to remove genes which had low counts in a majority of samples using the Bioconductor package edge R v3.0.8. A false discovery rate (FDR) method was employed to correct for multiple testing. Differential expression was defined as |log2 (ratio)|≥0.585(±1.5-fold) with the FDR set to 5%.
RNA isolation and reverse transcriptase-polymerase chain reaction (RT-PCR)
Total RNA was isolated from DS-1 cells using the RNA easy Mini kit (Qiagen). Total RNA integrity was checked using an Agilent 2200 TapeStation (Agilent Technologies, Inc., Santa Clara, CA) and quantified with a Trinean DropSense96 spectrophotometer (Caliper Life Sciences, Hopkinton, MA). As previously reported,2 RNA transcript for endothelial cell markers expressed by DS-1 cells and ELCs were determined by semi-quantitative RT-PCR. The primers for canine transcript are listed in Table S1.
5' primer |
3' primer |
|
Canine CD34 |
CAGAAACCGTGATTACTCCTACCAC |
AGCTCTAGGCAGATACCTTGGTTC |
Canine VE-cadherin |
CACAGCCACAGTACTGGTCAACC |
TGCGGATGGAATATCCAATGCTCC |
Canine KDR |
GAACTGAAGACAGGCTACTTGTCC |
CTCTGACTACTGGTGATGCTGTCC |
Canine vWF |
GTCAGATTCAACCATCTTG GCCAC |
GGGATGGTGGACATGACATAGCAC |
Canine TEK/TIE2 |
CTTTAAGATACAGCCTTTCCCATCC |
CTGGTTCATTAAGGCTTCAAAGTCC |
Canine ACTB |
GATGACGATATCGCTGCGCTTGTG |
CATCACGATGCCAGTGGTGCGG |
Table S1 N=57; Epidemiological distribution of the pathological fractures, traumatic fractures, and nonunion.
Histological examination
Dogs were euthanized 4 weeks after cell/vehicle infusion by intravenously injecting phenobarbital and phenytoin (Beuthanasia-D). Hearts were removed, rinsed in non-sterile saline, and perfused with 0.9% saline and 4% paraformaldehyde sequentially. The right and left atria and the right ventricle from the paraformaldehyde-fixed canine hearts were removed and then a commercial slicer (Berkel) was used to do cross-sectioning parallel to the short-axis at 3mm thicknesses. The whole heart, left ventricle and each slice were weighed before tissue processing. Tissue morphology and the extent of cardiac fibrosis were determined from hematoxylin and eosin (H&E) and picrosirius red/fast green-stained sections, respectively. For morphometry, infarct regions were identified by picrosirius red staining, and areas calculated using Nanozoomer scanning and software (Hamamatsu) and Image J software (version 1.47, NIH, Bethesda, MD, USA). We traced the enlarged projections of all the stained slides to define the necrotic and viable areas. The infarct size was calculated by cut and weigh techniques on copies of these tracings. Infarct size was determined for each slice, as a percentage of the entire left ventricle. The picrosirius red-stained slices were also examined under light microscopy with a linear polarization unit. Fifty collagen fibers per tissue section (5 sections for each dog) were studied where the myocytes were cut longitudinally. A 50-point grid was constructed over the tissue section by an eyepiece reticle. The extinction angle of the collagen fibers intersected by the grid points were measured with a rotating microscope stage.31 Deviations of the extinction angles were calculated for 50 collagen fibers per tissue section. Lower deviations indicate a more parallel (uniform) alignment of fibers.
For immunohistochemistry of formalin-fixed and paraffin embedded tissue, slides were prepared and stained with α-smooth muscle actin antibody at 1:300 (clone 1A4; DAKO) followed by an anti-mouse secondary conjugated to HRP (Power Vision Ms-HRP; Leica) then DAB chromogen (Refine DAB; Leica) and counterstained with hematoxylin 50% in dH2O (NM-HEM; Biocare). Images were acquired using a Nanozoomer scanner and arteriole numbers were determined in 10 fields of both the infarct and border zones at 10X magnification with the data expressed as the average number of arterioles/mm2.
Statistical analysis
IBM SPSS Statistics software (version 22.0) was used for statistical analysis. Continuous data are presented as mean ± S.E.M. Mann-Whitney U test was used for 2-group comparisons. We also used a paired t-test to compare the LV function before and after treatment. A value of p<0.05 was considered statistically significant.
Characterization of DS-1 cells
The gene expression of DS-1 cells was analyzed by high-throughput transcriptome profiling using RNA-seq technology. DS-1 cells expressed cell surface molecules, such as CD146, cadherins (CDH2, CDH6), and integrin alpha 3 (ITGA3), which is expected for fibroblasts and pericytes (Figure S1). In contrast, gene expression of marker molecules for myocardial progenitor (c-kit), endothelial cell (Tie2, CD34, vWF, VECAD, KDR) and hematopoietic/monocyte (CD45, CD11c/ITGAX) were not detected. Highly expressed genes (>1000 log CPM) in DS-1 cells included extracellular matrix molecules such as collagens and small proteoglycans (Table S2). These data suggested that DS-1 cells resemble fibroblasts, but not endothelial or myocardial progenitor-like cells. Specifically DS-1 appeared to be the canine analogue of the human fibroblast cell line HS27a which has been used extensively and shown to induce a tissue macrophage phenotype in monocytes.19
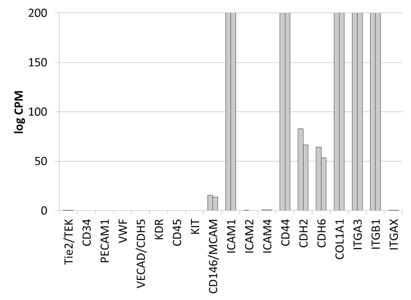
Supplementary Figure S1 Gene expression analysis of key marker molecules of mesenchymal cells by RNA-seq expression arrays.
Gene expression analysis of key marker molecules of mesenchymal cells by RNA-seq expression arrays. Cell surface and extracellular matrix molecules are chosen to represent endothelial cells (Tie2, CD34, PECAM, vWF, VECAD, KDR), hematopoietic cells (CD45, CD11c/ITGAX), myocardial progenitors (cKIT), and fibroblasts/pericytes (CD146, ICAM, Cadherins, Integrins and collagen). DS1 cells express fibroblastoid/pericyte genes, but not cKIT or genes for endothelial cells. Y axis: counts per millions (log2) with the maximum of 200, n=2.
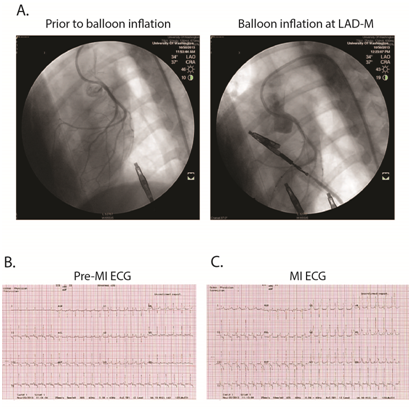
Supplementary Figure S2 Representative of ischemia-reperfusion surgery in canine.
A, myocardial infarction was created by the procedure of balloon inflation, 90 minutes, at left anterior descending coronary artery (LAD) to stop the LAD blood flow. B and C, ST segment elevation, leads V1~V4, during the period of balloon inflation indicated acute anterior wall myocardial infarction.
|
Gene ID |
Gene Name |
Chromosome Name |
Description |
Normalized CPM |
Average |
|
|
ENSCAFG00000017018 |
COL1A1 |
9 |
Collagen alpha-1(I) chain |
16129.22 |
15008.79 |
15569 |
|
ENSCAFG00000022723 |
COX1 |
MT |
Cytochrome c oxidase subunit |
11162.81 |
7420.56 |
9291.7 |
|
ENSCAFG00000002069 |
COL1A2 |
14 |
Collagen alpha-2(I) chain |
6857.99 |
6301.8 |
6579.9 |
|
ENSCAFG00000004529 |
A3RLY4 |
2 |
Uncharacterized protein |
4215.45 |
4308.15 |
4261.8 |
|
ENSCAFG00000022730 |
COX3 |
MT |
Cytochrome c oxidase subunit III |
4063.52 |
3321.41 |
3692.5 |
|
ENSCAFG00000014837 |
COL5A2 |
36 |
Collagen, type V, alpha 2 |
3701.2 |
3392.42 |
3546.8 |
|
ENSCAFG00000014812 |
COL3A1 |
36 |
Collagen alpha 1 type III |
3464.96 |
3427.07 |
3446 |
|
ENSCAFG00000022735 |
NU4M |
MT |
NADH-ubiquinone oxidoreductase chain |
4116.56 |
2625.01 |
3370.8 |
|
ENSCAFG00000022726 |
COX2 |
MT |
Cytochrome c oxidase subunit |
3740.04 |
2988.15 |
3364.1 |
|
ENSCAFG00000022729 |
ATP6 |
MT |
ATP synthase subunit a |
3488.89 |
2735.08 |
3112 |
|
ENSCAFG00000002656 |
EEF1A1 |
12 |
Elongation factor 1-alpha 1 |
3010.44 |
3163.71 |
3087.1 |
|
ENSCAFG00000011172 |
FSTL1 |
33 |
Follistatin-like 1 |
3006.97 |
3027.46 |
3017.2 |
|
ENSCAFG00000016020 |
ACTB |
6 |
Actin, cytoplasmic |
2676.43 |
3189.02 |
2932.7 |
|
ENSCAFG00000005734 |
ACTG1 |
9 |
Uncharacterized protein |
2770.46 |
2625.47 |
2698 |
|
ENSCAFG00000016686 |
ANXA2 |
30 |
Annexin A2 |
2266.58 |
2525.2 |
2395.9 |
|
ENSCAFG00000028461 |
LOX |
11 |
Lysyl oxidase |
2523.35 |
2243.33 |
2383.3 |
|
ENSCAFG00000022739 |
ND5 |
MT |
NADH dehydrogenase subunit |
2849.02 |
1668.32 |
2258.7 |
|
ENSCAFG00000001630 |
MYH9 |
10 |
Myosin-9 |
2299.55 |
2142.56 |
2221.1 |
|
ENSCAFG00000015077 |
G3PDH |
27 |
Glyceraldehyde-3-phosphate dehydrogenase |
1985.76 |
2265.86 |
2125.8 |
|
ENSCAFG00000019521 |
FLNA |
X |
Filamin A, alpha |
2142.72 |
2070.26 |
2106.5 |
|
ENSCAFG00000019848 |
COL5A1 |
9 |
Collagen, type V, alpha 1 |
1934.16 |
1946.59 |
1940.4 |
|
ENSCAFG00000001677 |
RPL8 |
13 |
Ribosomal protein L8 |
1568.13 |
1895.21 |
1731.7 |
|
ENSCAFG00000006607 |
DPYSL3 |
2 |
Dihydropyrimidinase-like 3 |
1698.33 |
1701.61 |
1700 |
|
ENSCAFG00000019158 |
EEF2 |
20 |
Eukaryotic translation elongation factor 2 |
1724.89 |
1612.13 |
1668.5 |
|
ENSCAFG00000008640 |
TUBA1B |
27 |
Tubulin, alpha 1b |
1653.27 |
1677.04 |
1665.2 |
|
ENSCAFG00000001433 |
PLEC |
13 |
Plectin [Source: HGNC Symbol;Acc:9069] |
1609.72 |
1720.24 |
1665 |
|
ENSCAFG00000011911 |
COL6A1 |
31 |
Collagen, type VI, alpha 1 |
1492.48 |
1635.37 |
1563.9 |
|
ENSCAFG00000000567 |
PABPC1 |
13 |
Poly(A) binding protein, cytoplasmic 1 |
1493.96 |
1558.05 |
1526 |
|
ENSCAFG00000022717 |
NU2M |
MT |
NADH-ubiquinone oxidoreductase chain |
1799.22 |
1203.05 |
1501.1 |
|
ENSCAFG00000008557 |
APBA1 |
31 |
Amyloid beta A4 protein |
1513.46 |
1457.53 |
1485.5 |
|
ENSCAFG00000022713 |
NU1M |
MT |
NADH-ubiquinone oxidoreductase chain |
1746.18 |
1199.02 |
1472.6 |
|
ENSCAFG00000003821 |
ITGB1 |
2 |
integrin, beta 1 |
1461.9 |
1337.01 |
1399.5 |
|
ENSCAFG00000001981 |
SLC29A1 |
12 |
Equilibrative nucleoside transporter |
1422.3 |
1369.18 |
1395.7 |
|
ENSCAFG00000032596 |
PTMA |
25 |
Prothymosin alpha |
1275.43 |
1433.96 |
1354.7 |
|
ENSCAFG00000019189 |
BGN |
X |
Biglycan |
1217.05 |
1484.22 |
1350.6 |
|
ENSCAFG00000017855 |
SPARC |
4 |
Secreted protein, acidic, cysteine-rich |
1329.5 |
1356.93 |
1343.2 |
|
ENSCAFG00000007666 |
EIF4G2 |
21 |
Eukaryotic translation initiation factor 4 gamma, 2 |
1463.97 |
1212.51 |
1338.2 |
|
ENSCAFG00000004533 |
TPT1 |
22 |
Tumor protein, translationally-controlled 1 |
1263.23 |
1408.15 |
1335.7 |
|
ENSCAFG00000007427 |
ENPL |
15 |
Endoplasmin |
1352.79 |
1317.51 |
1335.2 |
|
ENSCAFG00000023756 |
GNAS |
24 |
GNAS complex locus |
1214.14 |
1381.88 |
1298 |
|
ENSCAFG00000005859 |
P4HB |
9 |
Prolyl 4-hydroxylase, beta polypeptide |
1258.04 |
1300.41 |
1279.2 |
|
ENSCAFG00000019985 |
COL11A1 |
6 |
Collagen, type XI, alpha 1 |
1341.27 |
1183.96 |
1262.6 |
|
ENSCAFG00000009663 |
SCD |
28 |
Stearoyl-CoA desaturase |
1334.45 |
1177.57 |
1256 |
|
ENSCAFG00000011080 |
CD99 |
X |
CD99 molecule |
1151.57 |
1278.08 |
1214.8 |
|
ENSCAFG00000016863 |
LMNA |
7 |
lamin A/C |
1118.11 |
1186.74 |
1152.4 |
|
ENSCAFG00000 001640 |
CALU |
14 |
Calumenin |
1210.47 |
1088.42 |
1149.5 |
|
ENSCAFG00000006491 |
ITGA5 |
27 |
Integrin, alpha 5 |
1079.75 |
1149.34 |
1114.6 |
|
ENSCAFG00000019840 |
RPL13 |
5 |
Ribosomal protein L13 |
982.57 |
1224.34 |
1103.5 |
|
ENSCAFG00000012556 |
HTRA1 |
28 |
HtrA serine peptidase 1 |
1007.1 |
1145.69 |
1076.4 |
|
ENSCAFG00000022742 |
CYB |
MT |
Cytochrome b |
1291.98 |
853.52 |
1072.8 |
|
ENSCAFG00000017680 |
RPL7A |
9 |
Ribosomal protein L7a |
962.08 |
1125.36 |
1043.7 |
|
ENSCAFG00000019901 |
SLC7A5 |
5 |
Solute carrier family 7 |
1039.6 |
1020.94 |
1030.3 |
|
ENSCAFG00000017655 |
PKM |
30 |
Pyruvate kinase M |
995.77 |
1035.42 |
1015.6 |
|
ENSCAFG00000001778 |
ANXA1 |
1 |
Annexin A1 |
982.93 |
1025.38 |
1004.2 |
Table S2 N=57; Epidemiological distribution of the pathological fractures, traumatic fractures, and nonunion.
Therapeutic effect of DS-1 cell i.v. infusion in the infarcted dogs
Figure 1A shows a diagram of the study protocol. All the study dogs received I-R procedure and had infarctions in the LV anterior wall and septum that was shown by coronary angiography, ECG and serum cardiac troponin I assay (Table 1 & Figure S2). All the dogs were enrolled into one of two groups: vehicle-treated controls (n=3) and DS-1-treated (n=3). Using the microsphere assay, there was no significant difference in collateral coronary circulation between the control and the DS-1-treated groups (Table 1).
ID |
Gender |
Age |
Weight |
Cardiac |
Infarct/ Non-Infarct Area Blood Flow (%) |
Infarct Area |
||
Pre-Infarct |
During |
6 Weeks |
Before / During |
|||||
DS1 Cell-Treated Dogs |
||||||||
H571 |
M |
24 |
16 |
3.21 |
98.2 |
26.7 |
47.9 |
24.6 |
H679 |
M |
9 |
17.8 |
10.78 |
93.5 |
44.5 |
83.4 |
42.1 |
H691 |
M |
9 |
15.6 |
76.36 |
117.3 |
32.5 |
86.4 |
17.1 |
Mean ± SD |
30.1 ± 23.2 |
103.0 ± 12.6 |
34.6 ± 9.1 |
72.6 ± 21.4 |
34.2 ± 20.5 |
|||
Control Dogs |
||||||||
H531 |
M |
27 |
18.1 |
146.79 |
85.2 |
24.6 |
50.5 |
57.1 |
H715 |
M |
16 |
13.9 |
2.5 |
42.1 |
39.1 |
84.1 |
27.9 |
H716 |
F |
7 |
17.2 |
66.48 |
87.3 |
6.1 |
48.6 |
17.5 |
Mean ± SD |
71.9 ± 41.7 |
71.5 ± 25.5 |
23.3 ± 16.5 |
61.1 ± 20.0 |
27.9 ± 12.8 |
|||
pé |
0.44 |
0.13 |
0.36 |
0.53 |
0.68 |
|||
Table 1 Demographic data, cardiac troponin I and microsphere assays.
ép value: the comparison between the control and the DS1-treated group.
SD: standard deviation.
Since 2D echocardiography-derived LVEF (2D-EF) is not a very precise and sensitive parameter to evaluate LV systolic function,32,33 we used CMR for more definitive analysis of systolic function. LVEF obtained by CMR (CMR-EF) demonstrated no difference in LV function at day 0, but there was significantly better LV systolic function in the DS-1 dogs at 28 days after treatment (Figure 1B-1C & Table S3,S4). Although we did late Gadolinium enhancement imaging, we failed to complete the late Gadolinium enhancement imaging in one dog. Owing to limited animal sample size each group, we did not analyze the infarct size determined from CMR.
Day -14 |
Day 0 |
Day 28 |
|||||||
Vehicle- Treated |
DS1- Treated |
p |
Vehicle- Treated |
DS1- Treated |
p |
Vehicle- Treated |
DS1- Treated |
p |
|
Cardiac MRI study |
|||||||||
LV EDV index |
NA |
NA |
NA |
66.6 ± 17.4 |
58.9 ± 8.3 |
0.53 |
76.0 ± 6.3 |
74.0 ± 9.8 |
0.78 |
LV ESV index |
NA |
NA |
NA |
31.2 ± 7.2 |
26.2 ± 1.2 |
0.3 |
39.9 ± 3.5 |
33.8 ± 4.3 |
0.13 |
MRI-LV EF (%) |
NA |
NA |
NA |
52.9 ± 1.6 |
55.0 ± 6.3 |
0.61 |
47.6 ± 2.3 |
54.2 ± 1.2 |
0.01 |
Echocardiographic study |
|||||||||
GLS (%) |
-19.3 ± 0.7 |
-20.0 ± 0.3 |
0.17 |
-15.7 ± 0.9 |
-15.3 ± 1.4 |
0.65 |
-13.6 ± 1.7 |
-16.0 ± 0.8 |
0.045 |
Mitral E/A |
1.4 ± 0.2 |
1.3 ± 0.2 |
0.51 |
1.9 ± 0.4 |
2.0 ± 0.4 |
0.76 |
1.8 ± 0.9 |
1.2 ± 0.3 |
0.37 |
Mitral E/e’ |
7.0 ± 0.9 |
7.4 ± 2.0 |
0.75 |
10.6 ± 3.8 |
13.8 ± 2.1 |
0.27 |
14.6 ± 1.3 |
7.3 ± 1.2 |
0.002 |
LAV index |
16.8 ± 3.3 |
15.1 ± 1.1 |
0.45 |
23.0 ± 1.9 |
20.7 ± 6.3 |
0.58 |
23.0 ± 1.0 |
15.2 ± 1.2 |
<0.001 |
Table S3 N=57; Epidemiological distribution of the pathological fractures, traumatic fractures, and nonunion.
Group |
Parameter |
Day 0 |
Day 28 |
p |
|---|---|---|---|---|
GLS (%) |
-15.7 ± 0.9 |
-13.6 ± 1.7 |
0.046 |
|
Vehicle-treated |
MRI - LVEF (%) |
52.9 ± 1.6 |
47.6 ± 2.3 |
0.03 |
E/A |
1.89 ± 0.24 |
1.78 ± 0.54 |
0.9 |
|
e’ (cm/s) |
9.1 ± 0.6 |
6.6 ± 0.8 |
0.14 |
|
E/e’ |
10.6 ± 3.8 |
14.6 ± 1.3 |
0.3 |
|
LAV index |
23.0 ± 1.9 |
23.0 ± 1.0 |
0.94 |
|
DS1-treated |
GLS (%) |
-15.3 ± 1.4 |
-16.0 ± 0.8 |
0.20 |
MRI- LVEF (%) |
55.0 ± 6.3 |
54.2 ± 1.2 |
0.82 |
|
E/A |
1.99 ± 0.22 |
1.19 ± 0.20 |
0.045 |
|
e’ (cm/s) |
6.8 ± 0.5 |
7.6 ± 0.6 |
0.3 |
|
E/e’ |
13.8 ± 2.1 |
7.3 ± 1.2 |
0.04 |
|
LAV index |
20.7 ± 6.3 |
15.2 ± 1.2 |
0.03 |
Table S4 N=57; Epidemiological distribution of the pathological fractures, traumatic fractures, and nonunion.
As a third means of assessing systolic function, we used global longitudinal strain (GLS) to further evaluate systolic function. GLS has been shown in several studies to be a more objective and sensitive parameter than 2D-EF to evaluate LV systolic function and contractility.26,27,32 GLS has a better correlation with CMR-EF, than 2D-EF.33 Therefore, we performed 2-dimensional strain analysis (Figure 2A & Table S3) and GLS showed better LV systolic function in the DS-1-treated dogs than the control dogs at 4 weeks after treatment (DS-1 cell treated dogs vs. vehicle-treated dogs;-16.0±0.8 % vs. -13.6±1.7 %, p=0.045, Figure 2B & Table S3,S4), which correlates with the CMR findings. Taken together, the CMR and GLS data suggest that DS-1 cell i.v. infusion prevented deterioration of LV systolic function in the infarcted dogs.
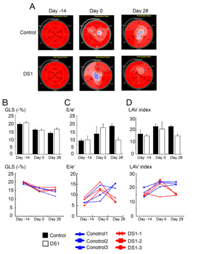
Figure 2 Evaluating left ventricular (LV) systolic and diastolic function by transthoracic echocardiography.
Cardiac diastolic function is usually not well-defined in pre-clinical studies. In the current study, we used mitral E/e’ and LAVi, to evaluate LV diastolic function. The LAVi and mitral E/e’ showed that all the dogs had LV diastolic dysfunction at 2 weeks after myocardial infarction(LAVi for the control animals paired t-test p=0.03; mitral E/e’ for the DS-1 treated animals paired t-test p=0.04; Figure 2C & 2D); LV diastolic function was significantly improved at 28 days after DS-1 cell infusion (mitral E/e’ for the DS-1 treated animals paired t test p=0.04; Figure 2C,2D & Tables S3,S4).
After MI, PBMCs were harvested from the control and DS-1 cell-treated dogs at multiple time points for detection of DS-1 cells and the appearance of endothelial-like colonies (ELC) as described in the previously reported lung study.2 ELC colonies were detected in all three DS-1 treated dogs albeit at variable numbers. However no colonies were detected over the same period in control dogs. The ELCs had endothelial morphology (Figure 3A) and expressed endothelial cell marker genes such as VE-cadherin, VEGF receptor (KDR), Tie 2, vWF and CD34 (Figure 3B). Increased numbers of ELCs appeared in the peripheral blood within 1 week after DS-1 cell infusion (Figure S3). Importantly, PCR-based VNTR of satellite DNA analysis indicated that these ELCs were not from the DS-1 cells, but were host in origin (Figure 3C).
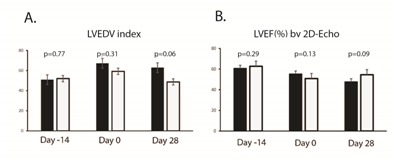
Supplementary Figure S3 Evaluating left ventricular (LV) function by 2D-Echo. Panel A: A. Left ventricular (LV) size was assessed by 2-dimensional echocardiography and indexed LV end-diastolic volume. The DS1 cell-treated animals had smaller LV size (borderline significant). Panel B: LV systolic function was evaluated by 2-dimentonal echocardiography derived ejection fraction (2D-EF).
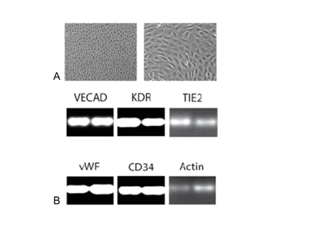
Supplementary Figure S4 Endothelial-like cell (ELC) colony formation in DS-1-treated dogs.
A, Phase contrast images of an ELC colony from a DS-1-treated dog is shown. The ELC colonies have “cobble- stone” like morphology, which is typical for endothelial cells. Objective X10 (left panel) and X20 (right panel).
B, RNA expression levels of endothelial cell marker and housekeeping genes were determined in ELC cells from the DS1-treated dogs by semi-quantitative RT-PCR. Transcripts for VECAD (VE-cadherin), KDR, TIE2, VWF, and CD34 were detected. cDNA of the cells was normalized using beta actin and RT-PCR was run in duplicate for canine Actin at 22 cycles, and other genes at 35 cycles. Negative controls (without cDNA) show no band.
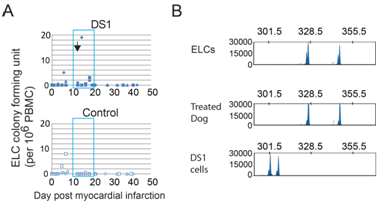
Figure 3 Endothelial-like cell (ELC) colony formation in DS-1-treated dogs.
Histological studies
All the dogs underwent full necropsy after being euthanized. Neither macroscopic nor microscopic evidence of tumor was detected. A single infusion of DS-1 cells did not enhance angiogenesis either in the infarcted area or in the border zone (infarcted area, DS-1 treated dogs vs. vehicle-treated dogs; 5.2±2.5 /mm2 vs. 3.3±1.8/mm2, p=0.34; border zone, DS-1 treated dogs vs. vehicle-treated dogs; 2.1±1.1/mm2 vs. 2.8±2.3/mm2, p=0.67; Figure 4A & 4B). Furthermore, the microsphere study at 4 weeks after treatment did not show a significant difference in blood flow in the infarcted myocardium between the control group and the DS-1-treated group (Table 1). These results suggest the improvement in systolic and diastolic function was not from enhanced angiogenesis or increased blood flow.
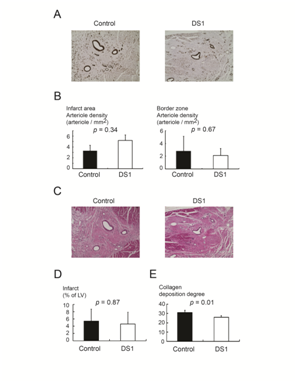
Figure 4 Histological studies of infarcted regions of heart from DS-1-treated dogs.
A&B: Representative immunohistochemical staining for α-smooth muscle actin in the infarcted regions. Scale bar 400μM. DS-1 cells treatment did not enhance arteriogenesis in the infarcted area or the border zone.
C&D: Hematoxylin and eosin (H&E) staining of the infarcted regions. Scale bar 400μM. The infarct size between the vehicle control dogs and the DS-1-treated dogs was not significantly different.
E: The angle deviation of the collagen fibers in the infarcted area was larger in the vehicle-treated dogs than in the DS-1-treated dogs.
H&E staining demonstrated the morphology of infarct and non-infarct regions of the control and the DS-1 cell-treated animals (Figure 4C). There was no difference between groups in infarct size (% of LV) at 28 days after cell therapy (DS-1 treated dogs vs. vehicle-treated dogs; 5.4±5.6 % vs. 4.6±5.7 %, p=0.87, Figure 4D).
Since the control dogs had worse LV diastolic function at the end of the study in comparison with DS-1-treated dogs, even though the infarct size was not different between groups, we examined the collagen fiber orientation in the infarcted myocardium in both groups. The angle deviation of the control dogs was larger than that of the DS-1-treated dogs (DS-1 treated dogs vs. vehicle-treated dogs; 25.9±3.1°vs. 31.1±4.1°, p=0.01, Figure 4E). This indicates that there was more parallel alignment of the collagen fibers in the treated dogs.
In separate studies we used Indium11 labeled DS-1 cells to follow the cells after i.v. infusion.1 We found that these cells were largely sequestered and then cleared from the lung by 48 hours. In the current study using a sensitive PCR assay we did not detect DS-1 DNA after 48-72 hours post infusion in the heart or blood of dogs given an infusion of DS-1 cells. This assay uses PCR amplification to detect variable numbers of tandem repeats (VNTR) in satellite DNA that distinguishes between DS-1 and other cell sources (Figure S4).
This study describes the therapeutic effect of intravenously infusing a cloned population of allogeneic marrow fibroblasts in a canine subacute MI (ischemia-reperfusion) model. The results indicate that a single infusion of DS-1 cells, 1) attenuated LV systolic function deterioration, 2) improved LV diastolic function, and 3) reduced the extent of collagen fiber disarrangement in the infarcted myocardium. All three parameters reached statistical significance despite the limited numbers of animals. While it is true that additional animals would make the analysis more robust and possibly detect significant differences in additional measurements, this potential benefit does not justify the use of additional dogs for this particular protocol. A better use may be a protocol with a longer-term follow-up.
DS-1 cells were selected for use in this study because of their transcriptome signature which resembles that of the human stromal (HS) line designated HS27a.Both the HS and DS series of stromal lines were isolated, cloned and expanded from primary stromal cultures immortalized by transduction of the HPV E6/E7 genes. We generated 20 different DS lines and selected one that showed consistent gene expression and cell growth over time, and closely resemble the human bone marrow fibroblast line HS27a. We previously showed that the HS27a cells induce a tissue macrophage phenotype in monocytes.19 Furthermore, these activated monocyte-derived macrophages express gene products associated with organ development. Both are unique from other DS or HS lines by their expression of CD146.
There have been many reports of MSC (mesenchymal stromal/stem cell)-based trials in small and large animals, as well as in patients. There are a number of significant variables among these studies that may confound the results, including the preparation of cells, their passage number and functional characteristics. The method and timing of delivery also varies. These studies are not only inconsistent but their interpretation remains controversial.34–38 The purpose of the current study was to control one source of variability, namely the composition of the cellular therapeutic. Previous data have shown that primary cultures of marrow stromal cells contain at least two functionally distinct populations of fibroblasts (CD146+ and CD146-) which can occur at variable ratios, plus 2-40% macrophage.19 The net function of cell products from primary cultures can be influenced by the relative frequency of three functionally distinct populations. By isolating and cloning a CD146+cell line we can control the source and quality of the cells infused.
There are hypothetical mechanisms to explain improvement in cardiac function following mesenchymal stromal cell (MSC) treatment.39–41 First, some MSCs are shown to have the immunoregulatory ability to suppress proliferation of activated T cells and to decrease immune-mediated post-MI cardiomyocyte losses.42,43 Second, some MSCs have an angiogenic/neovascularization effect in the border zone (peri-infarct region) to attenuate deterioration of post-MI cardiac functions.44,45 Third, MSCs may produce numbers of cytokines and chemokines which may rescue injured cardiomyocytes. This would suggest that after MI, MSCs might work at a distance. However our results suggest that DS-1 cells do not persist in the animal more than 48 hours, therefore they can only initiate the beneficial process. During the 48 hour time frame our data show DS-1cells activate circulating monocytes.
It is generally agreed that monocytes can transmigrate the endothelium and come under the influence of tissue environments they enter, producing activities and performing functions relevant to that tissue at that time.46–48 By acting through a monocyte there is no requirement for MSC engraftment, or retention in any other form.34,40
This proposed mechanism suggests that intravenous infusion of a defined population of fibroblasts may provide benefit while avoiding the risks of thoracotomy and intramyocardial injection. In addition the intravenous infusion of immortalized allogeneic cells in immune-competent dogs did not lead to any events. Importantly, compared to the vehicle-treated controls, DS-1 cell iv infusion improved post-MI LV diastolic function and attenuated the deterioration of LV systolic function. Based on these observations, we hypothesized that the beneficial effect of infusing DS1 cells is initiated by stimulating monocytes which occurs rapidly and is complete prior to the clearance of the DS1 cells.
Severe cardiac fibrosis is known to increase LV stiffness, leading to LV diastolic dysfunction.25,49,50 In this study the DS-1-treated dogs did not demonstrate smaller cardiac infarct size than the controls, but histological analysis showed more parallel alignment of collagen fibers in the infarcted areas of DS-1-treated dogs. Disarrangement of the heart’s collagen fibers is correlated with a stiffer LV and both systolic and diastolic dysfunction.31 Here we used echocardiography-derived TDI E/e’ to evaluate diastolic function and LV stiffness, as recommended by the American Society of Echocardiography.25 We speculate that the reduction in LV stiffness in the DS-1-treated dogs might be due to more uniform collagen fiber orientation in the infarcted area.
The major limitation of this study is the small sample size of each group. However, the results were sufficiently consistent to provide statistically significant differences in results between the two treatment groups, despite the small sample size. We believe the thoroughness with which we conducted these experiments, the careful characterization of the DS-1 cells, and the corroboration with the lung fibrosis study are sufficiently compelling to warrant communication.
In summary, our current study shows a therapeutic benefit of intravenously infusing DS-1 cells during the subacute MI period. While the precise mechanism responsible for this beneficial effect is not as yet defined, we do know that the DS-1 cells do not contribute directly to tissue repair since they are eliminated within 48 hours of infusion.1 We also know that infusion of DS-1 cells results in activation of monocytes. Therefore a more likely hypothesis is that the DS-1 activated monocytes give rise to tissue macrophages that contribute to the therapeutic benefit. This hypothesis needs to be tested. If proven true, identifying the signaling pathways involved in this monocyte/macrophage function could lead to the development of a reagent that could replace the DS-1 cells.
This work was supported by NIH grants HL099993 and DK056465 (to BTS), and P01 HL094374, R01 HL084642, P01 GM81619, U01 HL100405 and an award from the Fondation Leducq Transatlantic Network of Excellence(to CEM). The authors thank Dr. Michele Spector and the FHCRC Animal Health Research team for animal care, Dr. Mike Harkey and Debe Higginbotham for VNTR analyses, Dr. Jeff Delrow, Andy Marty and Ryan Basom for RNA-seq analysis. We also thank Baocheng Chu and Jennifer Newcomb for canine cardiac MRI examinations. The HS and DS cell lines are available for research purposes upon request.
The author declares no conflict of interest.

©2017 Liu, et al. This is an open access article distributed under the terms of the, which permits unrestricted use, distribution, and build upon your work non-commercially.