Advances in
eISSN: 2572-8490


Mini Review Volume 2 Issue 6
1Department of Metallurgical and Materials Engineering, Nnamdi Azikiwe University, Awka, Nigeria
2Department of Materials and Metallurgical Engineering, Federal University of Technology, Owerri, Nigeria
3Department of Engineering Research, Development and Production, PRODA Enugu, Nigeria
4Scientific Equipment Development Institute, Enugu, Nigeria
Correspondence: Nwoye CI, Department of Metallurgical and Materials Engineering, Nnamdi Azikiwe University, Awka, Nigeria
Received: June 08, 2017 | Published: August 29, 2017
Citation: Nwoye CI, Egole CP, Anene F, et al. Review of models and variables affecting phosphorus removal during processing of iron ores designated for production of orthopedics devices. Adv Tissue Eng Regen Med Open Access. 2017;2(6):261–264. DOI: 10.15406/atroa.2017.02.00046
A review has been carried out to show models and variables affecting phosphorus removal during processing of iron ores (in acid solution) designated for production of orthopedics devices. Review of literatures show that the level of phosphorus removal during iron ore processing in acid solutions is largely dependent on the initial and /or final pH of the leaching solution. A decrease in the final solution pH is indicative of increased phosphorus removal and dissolution in the leaching solution, hence increased acidity of the leaching solution. Scanning Electron Microscopy (SEM) of the dephosphorized iron ore depicted small caked particle clusters.
Keywords: Models; Variables; Phosphorus removal; Iron ore; Orthopedics devices
Studies1-4 have not only shown that metallic ion release occurs in vivo, but also presence of soluble and precipitated corrosion products, as well as metallic wear debris, in the liver, spleen, lungs, and even remote bone marrow of the iliac crest. Reports from these studies indicate that constant motion of the metal-on-metal prosthesis causes a wearing away of the passivated surface and an increase in metallic ion release.
Research5 on the most important metal components used in orthopedic implant devices such as titanium reveals that they are considered due to possession of reliable mechanical performance as replacement for hard tissues, favorable properties of high rigidity, fracture toughness and strength. The research also identifies major examples of titanium implants used in orthopedics to include prosthetic hip and knee replacements for various types of spinal fusion instruments for stabilizing degenerate and unstable vertebral segments, fracture fixation devices of such as plates, screws and intramedullary rods as well as arthritis affecting these joints.
Some orthopedics devices are made from stainless steel which is invariably a product of iron ore (concentrate) reduction and refining in the metallurgical industries, followed by addition of some alloying elements. Report6 has shown that steel from which stainless steel is produced is chiefly made up of iron, carbon and also impurities such as sulfur, phosphorus etc. Research7 has shown that application of stainless steel in biomedical engineering is restricted to temporary devices such as plates, screws, wires and fittings for orthopedics due to potential long term release of Cr6+, Cr3+, and Ni2+ into the body (Figure 1-4).
Presence of high phosphorus concentration in iron (above admissible level) designated for production of engineering materials enhances embrittlement when these materials are placed to strive under service conditions. Phosphorus is very poisonous. Therefore, usage of iron with high phosphorus content for production of stainless steel used in the manufacture of orthopedic devices endangers the health of the patient. This culminates from risk of steel fracture (due to embrittleness) and phosphorus ion release into some body fluids. This formed the basis for several attempts already made to reduce the concentration of phosphorus inherent in iron oxide ores designated for production of engineering materials and orthopedic devices.
Successful efforts have been made8-12 to clearly ascertain the possibility of quantifying the extent of phosphorus removal during processing of iron oxide ore, based on synergistic interaction between some process parameters.
An empirical model8 has predicted extent of phosphorus removal based on of the final leaching solution pH and weight input of the iron oxide during oxalic acid treatment of the ore. The derived model expressed as;
(1)
indicates that the removed phosphorus concentration, is inversely proportional to both the final pH of the leaching solution and weight input of the iron oxide and their product (Table 1).
(µ) (g) |
(a) |
Pexp(mg/Kg) |
PM(mg/Kg) |
Dv (%) |
2 |
2.98 |
62.7 |
61 |
-2.71 |
3.5 |
3.06 |
60.81 |
54.78 |
-9.92 |
4 |
3.19 |
59.6 |
46.53 |
-21.93 |
6 |
3.2 |
45.6 |
45.98 |
+0.83 |
8 |
3.29 |
44.2 |
41.41 |
-6.31 |
9 |
3.38 |
37.4 |
37.5 |
+0.27 |
10 |
3.45 |
31.6 |
34.84 |
+10.25 |
Table 1 Comparison between concentrations of phosphorus removed as predicted by model PM and as obtained from experiment Pexp [8].
Later work9 revealed that the level of phosphorus removal using the same acid solution could be successfully evaluated based on just the final pH of the leaching solution (Table 2). The evaluation was with the aid of a derived uni-factorial model that has its validity rooted in the relationship where both sides of the expression are approximately equal to 4. Predicted results by the model;
(2)
shows a maximum deviation ˂ 22% from experimental results of removed phosphorus concentration.
( µ ) |
( γ ) |
Pexp(mg/Kg) |
PM (mg/Kg) |
Dv (%) |
16 |
5.52 |
1.875 |
1.704 |
-9.12 |
20 |
6.42 |
1.5 |
1.1721 |
-21.86 |
22 |
6.38 |
1.13 |
1.0722 |
-5.11 |
24 |
6.34 |
0.79 |
0.9891 |
+25.2 |
28 |
7 |
0.77 |
0.7679 |
-0.28 |
32 |
6.99 |
0.74 |
0.6728 |
-9.08 |
36 |
6.85 |
0.61 |
0.6103 |
+0.05 |
Table 2 Comparison of predicted removed phosphorus concentration PM and the corresponding experimental values Pexp.9
Similar acid leaching of iron oxide ore to remove phosphorus, and computational analysis of generated experimental results10 using a derived model;
(3)
has predicted removed phosphorus concentration as an exponential function of the natural logarithm of final leaching solution pH (Figure 5) Equation 3. Phosphorus removal in both researches9,10 involved oxalic acid solution and are dependent on only the final leaching solution pH equations 2 & 3. However, in the later research, greater weight input of the iron oxide ore was observed (Tables 1 & 2). It is therefore strongly believed that this accounted for the variation in the derived model equations. The validity of the model was rooted in the expression .
The removed phosphorus concentration per unit mass-input of iron oxide ore as obtained from experiment and derived model are 3.8329 and 4.0614 mg/kg/g respectively (Figure 6). These are in proximate agreement.
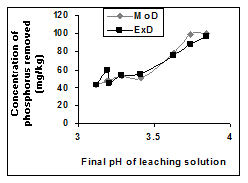
Figure 5 Comparison of removed phosphorus concentration (relative to final leaching solution pH) as obtained from experiment and derived model [10].
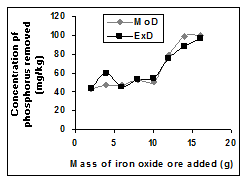
Figure 6 Comparison of removed phosphorus concentration (relative to mass input of iron oxide ore) as obtained from experiment and derived model [10].
A process assessment model11 clearly predicted the quantity of removed phosphorus P, during sulfuric acid leaching of iron oxide ore, based on the combined influence of the initial and final leaching solution pHs on the leaching process (Table 3). Evaluation of the model-predicted results show that the validity of the model is rooted in the mathematical expression; where both sides of the relationship are almost equal. The model is expressed as;
(4)
It indicates that the removed phosphorus concentration is dependent on the exponential values of the initial and final solution pH quotient.
(a) |
( γ ) |
Pexp(mg/Kg) |
PM (mg/Kg) |
Dv (%) |
0.41 |
0.52 |
180 |
190.91 |
+6.06 |
0.39 |
0.48 |
214 |
170.58 |
-20.29 |
0.4 |
0.52 |
203 |
209.96 |
+3.43 |
0.41 |
0.48 |
199.75 |
142.47 |
-28.68 |
0.41 |
0.53 |
232.25 |
205.4 |
-11.56 |
0.4 |
0.5 |
198 |
180.71 |
-8.73 |
0.4 |
0.47 |
183 |
144.3 |
-21.15 |
Table 3 Deviation of model-predicted removed phosphorus concentrations PM from the corresponding experimental values Pexp 11.
The removed phosphorus concentration during sulfuric acid leaching of iron oxide ore has also been predicted as a function of the final leaching solution pH γ12 (Table 4). Predicted results by the derived model indicate that the removed phosphorus concentration is an inverse logarithmic function of the final leaching solution pH equation 5. The validity of the model
(5)
is rooted in the expression where both sides of the relationship are approximately equal to 2.3. The maximum deviations of model-predicted values of removed phosphorus concentration from the experimental results were ˂ 8%.
(µ) (g) |
(a) |
Pexp(mg/Kg) |
PM (mg/Kg) |
Dv (%) |
4 |
0.48 |
214 |
215.18 |
+0.55 |
6 |
0.47 |
203 |
192.4 |
-5.22 |
8 |
0.48 |
199.75 |
215.18 |
+7.72 |
10 |
0.48 |
232.25 |
215.18 |
-7.35 |
12 |
0.47 |
198 |
192.4 |
-2.83 |
14 |
0.47 |
183 |
192.4 |
+5.14 |
Table 4 Variation of model-predicted removed phosphorus concentrations PM with associated deviations from experimental results Pexp12.
The scanning electron microscope (SEM) of residues from leaching processes associating derived empirical model equations 1-5 are shown as Figure 7a-7d respectively.
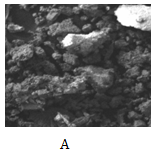
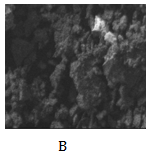
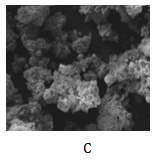
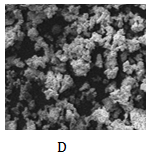
Figure 7 SEM of dephosphorized iron oxide ore associating derived model equations;
7a:
; 7b:
; 7c:
; 7d:
and
Figure 7a shows low level phosphorus removal, depicted by the presence of just two small whitish lumps within the ore matrix. The whitish lumps typify caked ore particles as phosphorus was removed from the iron ore matrix. Figure 7b revealed even a much lower level of phosphorus removal (Table 1 & 2). This is due to presence of very little whitish lumps in the ore residue matrix. Phosphorus removal associating equation 1 was greater than that of equation 2 because the final leaching solution pH was lower compared to that of equation 2 (Table 1 & 2). This implied increased acidity and overly suggested a greater dissolution concentration of removed phosphorus.
Figure 7C depicts large spread of the whitish lumps within the ore particles. These lumps indicate much greater level of phosphorus removal (compared to Figure 7a & 7b) depicted by greater level of particle caking. Furthermore, Figure 5 & 6 as well as Table 1 & 2 indicate that the final leaching solution pH in this case was much lower compared to the process associating model equation 2 and slightly higher to that of equation 1, but with much weight input of iron ore per unit kg. This basically implied greater dissolution of the removed phosphorus during the leaching process. Figure 7d shows much composition and spread of whitish lumps within the ore matrix. Phosphorus removal was also more prevalent and significant than in the processes associating model equations (1), (2) and (3). Comparative analysis of Figure 5 & 6 and Tables 1-4 shows that the final leaching solution pH in this case (processes associating model equations (4) and (5)) were same and much lower than what was obtained in the processes associating model equations (1), (2) and (3) (increased acidity). This invariably translates into greater phosphorus removal in processes associating model equations (4) and (5) compared to the leaching processes associating model equations (1), (2) and (3).
None.
The author declares no conflict of interest.

©2017 Nwoye, et al. This is an open access article distributed under the terms of the, which permits unrestricted use, distribution, and build upon your work non-commercially.