Advances in
eISSN: 2377-4290


Research Article Volume 2 Issue 2
Department of Ophthalmology, Gunma University Graduate School of Medicine, Japan
Correspondence: Hideo Akiyama, Department of Ophthalmology, Gunma University Graduate School of Medicine, 3 39 15 Showa machi Maebashi, Gunma 371 8511, Japan, Tel +81-27-220-8338
Received: February 01, 2015 | Published: March 19, 2015
Citation: Akiyama H, Itakura H, Kashima T, et al. Observation of the vitreous in diabetic macular edema using swept-source OCT. Adv Ophthalmol Vis Syst. 2015;2(2):49-53. DOI: 10.15406/aovs.2015.02.00037
Purpose: This study describes the relationship between the vitreous and diabetic macular edema (DME) using swept source OCT (SS-OCT).
Method: We examined 81 eyes of 58 consecutive patients diagnosed as DME. The condition of the posterior wall of the posterior precortical vitreous pocket (PPVP) was classified into 4 groups based on 12-mm horizontal and vertical scans through the macula using SS-OCT. Classifications were: Group 1, no posterior vitreous detachments (PVDs); Group 2, perifoveal PVD; Group 3, macular PVD; and Group 4, complete PVD. DME types, which included cystoid macular edema (CME) and serous retinal detachment (SRD), were also investigated in each group. The control group consisted of 46 eyes of 39 diabetic patients without DME as shown by OCT.
Result: The number of eyes diagnosed as DME for each of the groups was 18, 35, 6 and 22, respectively. OCT images revealed there were 35 (43%) out of 81 eyes with perifoveal PVD, that was accompanied by CME (94%) with or without SRD, which was statistically significant as compared with the other groups (P=0.0005). In Group 2, there were 21 (60%) out of 35 eyes with proliferative diabetic retinopathy (PDR), with this ratio significantly higher when compared to the other groups (P=0.034).
Conclusion: A significant correlation exists between CME associated with DME and perifoveal PVD.
Keywords: swept-source OCT, DME, CME, vitreous
DME, diabetic macular edema; SS-OCT, swept source optical coherence tomography; PPVP, posterior precortical vitreous pocket; CME, cystoid macular edema; PVD, posterior vitreous detachments; SRD, serous retinal detachment; PDR, proliferative diabetic retinopathy; DR, diabetic retinopathy; VEGF, vascular endothelial growth factor
Diabetic macular edema (DME) is the most common cause of visual loss in patients with diabetic retinopathy (DR) and is responsible for a decreased vision-related quality of life in working-aged people.1 Visual loss occurs due to the leakage of blood constituents from microaneurysms and the dilated macular capillary bed into the surrounding intraretinal or subretinal space, which leads to retinal thickening and macular edema with image distortion.2,3 Several treatment interventions have been utilized, including photocoagulation, vitrectomy, steroid, and anti-vascular endothelial growth factor (VEGF) agents. In addition to the breakdown of the blood-retinal barrier, the pathological changes in the vitreomacular interface play an important role in the persistent thickening or distortion of the neuroglial tissue in the macula.4,5 This has been shown to lead to the peeling of the posterior wall of the posterior precortical vitreous pocket (PPVP) during pars plana vitrectomy.6−11 Vitrectomy removes both the VEGF protein that is derived from ischemic retinal tissues and the cytokines involved with the inflammatory responses.12−15 Although the specific details of the condition between the DME and vitreous remain unclear, vitrectomy has been thought to be effective for DME.
Recent advances in optical coherence tomography (OCT) technology have enabled more detailed and precise quantitative assessments of optical structural changes. Swept-source OCT (SS-OCT) is a new generation of OCT that provides higher penetration into the choroid and sclera. SS-OCT also enables clearer visualization of the vitreous even if a patient has progressed cataract, although SD-OCT can observe the surface of the retina and the vitreous to a degree. Itakura et al.16 recently reported being able to make a precise and detailed observation of the PPVP when using SS-OCT. The current study used SS-OCT with the aim of examining the relationship the morphologic features of DME and the condition of the posterior wall of the PPVP. We also investigated whether SS-OCT is useful for observing of the surface of the retina and the vitreous in DME.
Patients
The protocol of the study was approved by the Institutional Review Board and Ethics Committee of Gunma University Graduate School of Medicine, and all investigations were conducted in accordance with the Declaration of Helsinki. Informed consent was obtained from all patients prior to all examinations. All subjects were examined at Gunma University from August 2012 to November 2013. In this study, our definition of DME is a condition of diabetic retinopathy with central foveal thickness more than 300 mm. The eyes of diabetic patients who were examined by OCT in our department and found to be without DME were designated as the control group. The cases with proliferative tissues observed using indirect funduscopy were divided into Proliferative diabetic retinopathy (PDR). No inflammation was observed in any of the eyes based on indirect funduscopy and slit-lamp biomicroscopy examinations.
SS-OCT imaging
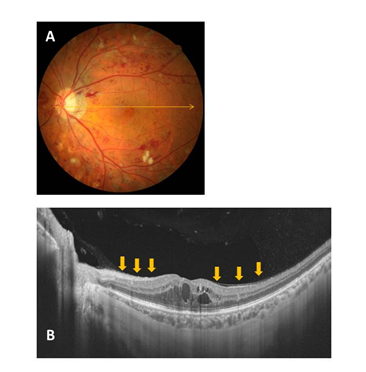
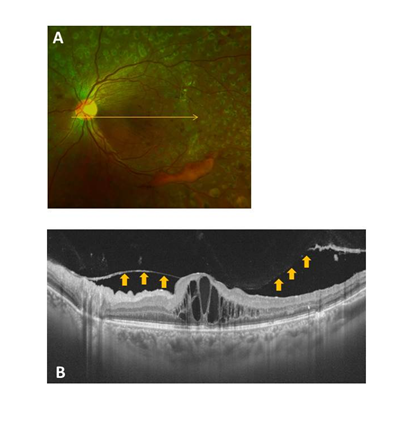
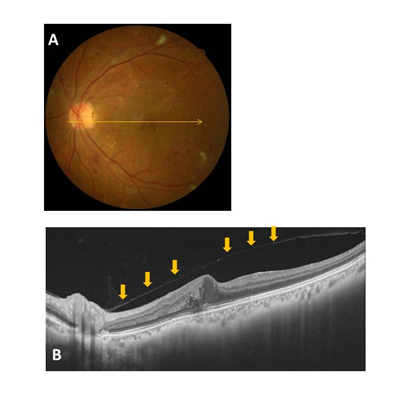
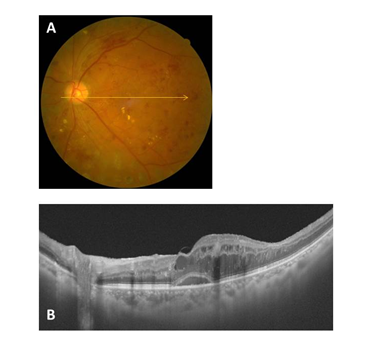
The OCT images of the eyes were obtained at the initial patient visit by SS-OCT (DRI OCT-1 Atlantis, Topcon, Tokyo, Japan) and used to investigate the posterior wall of the PPVP. This particular OCT system has an A-scan repetition rate of 100,000 Hz, with a light source that operates in the 1-μm wavelength region. The light source consists of a wavelength-tunable laser centered at 1,050 nm with a 100 nm tuning range. This system used an 8μm axial resolution and a 20 μm lateral resolution, with a 2.3 mm imaging depth in the tissue. The ocular fundus was examined by performing 12 mm horizontal and vertical scans through the fovea. Based on these scans, the condition of the posterior wall of the PPVP was classified into the following four groups: Group 1, no PVDs (Figure 1); Group 2, perifoveal PVD (Figure 2); Group 3 macular PVD (Figure 3); and Group 4, complete PVD (Figure 4).

Figure 1 Representative fundus photo and OCT image for a Group 1 (no PVD) case (A and B). The condition of the posterior wall of the PPVP is indicated by the arrows.

Figure 2 Representative fundus photo and OCT image for a Group 2 (perifoveal PVD) case (A and B). The condition of the posterior wall of the PPVP is indicated by the arrows.

Figure 3 Representative fundus photo and OCT image for a Group 3 (macular PVD) case (A and B). Vitreofoveal separation with persistent attachment to the optic disc is observed. The condition of the posterior wall of the PPVP is indicated by the arrows.

Figure 4 Representative fundus photo and OCT image for a Group 4 (complete PVD) case (A and B). The posterior wall of the PPVP is not observed.
The proportion of serous retinal detachment (SRD) and CME was also determined in each group. When cystic changes in the retina were found within 2mm from the fovea without serous retinal detachment, cases were classified CME group. Because the retinal thickness was increased to an extent in all cases, the morphological investigations in this study focused on only SRD and CME. We excluded all cases associated with vitreous hemorrhage, neovascular glaucoma, epiretinal membrane and proliferative membrane that generated obvious traction to the fovea.
Statistical analysis
Statistical analysis was performed using the Excel 2012 software (Microsoft Corporation, Remond, WA, USA). The Mann-whitney U test Student’s t-test were used to determine the significance of the differences between DME and No DME (control) groups. Statistical analysis of the CME, SRD and PDR incidence was performed using Chi-square tests, with P <0.05 considered significant.
Clinical characteristics
This study examined 81 eyes of 58 consecutive Japanese patients (35 males, 23 female) diagnosed with DME and 46 eyes of 39 diabetic patients (24 males, 15 females) without DME (Table 1). The mean central macular thickness of patients±SD was 434±139 mm (range, 302 to 800) in the patients with DME and 259±19 mm (range, 222 to 295) in the controls (P<0.0001). The Table 2 shows the prevalence of the different stages of PVD in patients with or without DME. There were no significant differences in the prevalence of each of the vitreous condition found between the series of patients with or without DME.
Variable |
DME |
No DME |
P Value |
No. of patients |
58 |
39 |
|
No. of eyes |
81 |
46 |
|
Sex of patients |
0.906 |
||
Male |
35 |
24 |
|
Female |
23 |
15 |
|
Age |
60.8±12.7 |
60.3±11.9 |
0.74 |
HbA1c |
7.8±1.7 |
7.9±2.0 |
0.638 |
Mean duration of diabetes±SD (years) |
13.3±6.9 |
13.0±8.4 |
0.831 |
Best-corrected visual acuity |
|||
Range |
60/2000~20/16 |
20/32~20/16 |
< 0.0001 |
Type of diabetic retinopathy (No. of eyes) |
< 0.001 |
||
No diabetic retinopathy |
0 |
16 |
|
Non-proliferative diabetic retinopathy |
43 |
26 |
|
Proliferative diabetic retinopathy |
38 |
4 |
|
Laser treatment (No. of eyes) |
< 0.0001 |
||
None |
31 |
72 |
|
Panretinal photocoagulation |
50 |
9 |
|
Focal laser |
0 |
0 |
|
Central macular thickness (mean±SD, mm) |
434±139 |
259±19 |
< 0.0001 |
Table 1 Characteristics of patients, Diabetes, and diabetic retinopathy in subjects with diabetic macular edema (DME) and No DME
Condition of PPVP |
DME% of series (No. of eyes) |
No DME % of series (No. of eyes) |
No PVD |
22 (18 years) |
35 (16 eyes) |
Perifoveal PVD |
43 (35 eyes) |
22 (10 eyes) |
Macular PVD |
8 (6 eyes) |
8 (4 eyes) |
Complete PVD |
27 (22 eyes) |
35 (16 eyes) |
Table 2 Prevalence of the different Stages of posterior vitreous detachment (PVD) in patients with diabetic Macular Edema (DME) and No DME
PPVP, posterior precortical vitreous pocket; PVD, posterior vitreous detachment
Table 3 shows characteristics of patients with DME. The age of patients in group 4 was significantly higher than those of the patients in group 2 (P=0.0002). There were 47 cases diagnosed as non-proliferated diabetic retinopathy (NPDR) and 34 diagnosed as proliferative diabetic retinopathy (PDR). In Group 2.21 (60%) out of 35 eyes were classified as PDR, with this ratio shown to be significantly higher than that observed in the other groups (P=0.034). At the initial visit, 50 of the 81 eyes with DME were found to have undergone pan retinal photocoagulation (PRP). There were no DM patients at their initial visit who were found to have received focal grid laser treatment, anti-VEGF injections, or steroid injections for DME. Cataract surgery had been performed prior to the initial visit in 13 of the 81 eyes with a median duration between the surgery and OCT examination of 33 months.
Age (average) |
Hb1c (average) |
Duration of Diabetes (Range)(Year) |
DR classification |
Prior treatment of PC |
Time between PC and initial Visit (Month) |
Previous severe illness at initial visit |
|||
(Group 1) PVD(-) |
62.5±6.0 |
8.3±2.1 |
15.4±9.1 (2~30) |
14 |
4 |
11 |
7 |
7.8±3.7 |
AMI 2 |
(Group 2) Perifoveal PVD |
54.9±14.3 |
7.8±1.8 |
13.2±6.9 (3~35) |
14 |
21* |
11 |
24 |
30.5±35.9 |
AMI 2 Collagen disease 1 Chronic renal failure 1 |
(Group 3) Macular PVD |
65.3±9.3 |
8.5±0.9 |
10.8±5.8 (5~20) |
4 |
2 |
2 |
4 |
27.3±15.0 |
|
(Group 4) Complete PVD |
67.5±11.8 |
7.2±1.1 |
12.9±5.8 (5~22) |
15 |
7 |
7 |
15 |
25.3±30.5 |
AMI 2 Cerebral infraction 1 |
Table 3 Characteristics of patients with diabetic macular edema (DME), age, HbA1C, classification of diabetic retinopathy (DR), photocoagulation, and the serious systemic diseases found in each group at the patient’s initial visit
*P=0.034
PC, photocoagulation; AMI, acute myocardial infarction
Anatomical results
For Groups 1 through 4, the number of eyes in each group was 18, 35, 6 and 22, respectively (Table 4A&B). The number of patients in each group was 12, 27, 5 and 14, respectively. OCT images indicated that 35 (43%) out of the 81 eyes had perifoveal PVD (Group 2). In contrast to the other groups, the Group 2 eyes were significantly accompanied by CME (94%) with or without SRD (P<0.05).
Morphology |
Total |
|||
SRD |
CME |
SRD +CME |
||
(Group 1) PVD(-) |
5 |
8 |
5 |
18 |
(Group 2) Perifoveal PVD |
2 |
25* |
8 |
35 |
(Group 3) Macular PVD |
0 |
4 |
2 |
6 |
(Group 4) Complete PVD |
13 |
6 |
3 |
22 |
Table 4A Morphological characteristics in each group
Previous studies have reported that breakdown of the BRB and cytokines such as VEGF might play an important part in the development of CME.4,5,17 The findings of our current study additionally suggest that CME and perifoveal PVD might be more closely related than previously thought. SS-OCT, which is a new generation of OCT that provides higher penetration into the choroid and sclera, has enabled more detailed and precise quantitative assessments of DME and the vitreous. In the current study, we defined DME as diabetic retinopathy with a central foveal thickness more than 300 mm. Since SS-OCT showed that CME or SRD existed in almost all of the cases treated clinically for these DMEs, we decided to focus on the CME or SRD configurations in DME. This enabled us to observe the condition of the vitreous and retina in detail regardless of the progressed cataract. In addition, the use of SS-OCT without indirect funduscopy and slit-lamp biomicroscopy made it possible to classify all of the DME cases into 4 groups. Gaucher et al.18 and Ghazi et al.19 have previously used OCT-1 or Stratus OCT to determine the relationship between DME and the vitreous, the resolution of these earlier devices is obviously inferior as compared to SS-OCT. While these previous studies included some cases of DME with ERM, our current study excluded ERM cases from our analysis, as we were attempting to investigate the specific relationship between the DME configurations and the vitreous.
Yamaguchi et al.20 reported finding three cases of CME associated with DME that were caused by vitreous traction. Their results showed that a resolution of the cystic cavities and restoration of the foveal depression occurred after a spontaneous separation of the hyaloid at the fovea. The OCT images in our current study revealed the presence of macular PVD in 6 of 81 eyes, with all of these cases confirmed to have CMEs. However, it was not possible to determine when the adhesion of the posterior wall of the PPVP to fovea has been released. In addition, we also could not completely follow the natural course of these cases due to the intravitreal injection of anti-VEGF or because of interruptions of the observation periods at our hospital. In our study, the 21 (60%) of the 35 eyes that showed perifoveal PVD were classified as PDR, with this ratio significantly higher than that observed in the other groups. There have been several other reports that have examined the occurrence of PVD following panretinal photocoagulation for diabetic retinopathy.21,22 For example, Tagawa et al.21 reported that complete PVD occurred primarily in NPDR, while partial PVD was primarily observed in PDR as the proliferation interfered with its development. In the current study, we found that the DMEs exhibiting CME were primarily accompanied by perifoveal PVD, thereby meeting the PDR classification of diabetic retinopathy. One potential limitation of our current study was that both eyes of the same subject were used as independent observations. In addition, it has been speculated that there may be numerous other factors involved in the mechanism of DME. Thus, further investigations will need to be undertaken in order to conclusively define the mechanism of DME.
Although we are unable to definitively determine the extent of the traction between the posterior wall of the PPVP and fovea, we can speculate that, in addition to vascular hyperpermeability, the vitreous might also be able to influence the development of CME associated with DME. We would like to emphasize the basis of CME or SRD is certainly present in vascular hyperpermeability, however the contact or traction of vitreous might be able to lead to morphologic changes of DME occasionally. Furthermore, SS-OCT appears to be useful for observing the surface of the retina and the vitreous in DME.
None.
Author declares that there is no conflict of interest.

©2015 Akiyama, et al. This is an open access article distributed under the terms of the, which permits unrestricted use, distribution, and build upon your work non-commercially.