eISSN: 2576-4543


Review Article Volume 6 Issue 1
1Department of Science Technology, Federal Polytechnic, Nigeria
2Department of Physics and Engineering Physics, Obafemi Awolowo University, Nigeria
Correspondence: LG Olatunbosun, Department of Science Technology, Federal Polytechnic, Ado-Ekiti, Nigeria
Received: January 19, 2022 | Published: January 25, 2022
Citation: Olatunbosun LG, Olabode AO, Ariyibi EA. Variability of Equatorial Electrojet (EEJ) at EIA regions. Phys Astron Int J. 2022;6(1):1-4. DOI: 10.15406/paij.2022.06.00241
The EEJ is a worldwide solar-driven wind that results in the solar quiet (Sq) current system in the E region of the earth’s ionosphere. The variability of some features such as EEJ, are very important in understanding the complex nature of the ionosphere, especially the low-latitude ionosphere. The magnetometer data from stations located near the equator and outside the edge of the electrojet strip for Africa and India stations were used to estimate and investigate the variability of EEJ in African and Indian Low-Latitudes. The stations are Addis Ababa, Ethiopia (geographic lat/long: 9.03oN/38.76oE) and at Mbour, Senegal for African region (geographic lat/long 14.392oN/343.042oE) and Hyderabad, India (geographic lat/long: 17.413oN/78.555oE) and Beijing Ming Tombs, China for Indian region (geographic lat/long: 40.3oN/116.2oE). The data in XYZ orientation was used to estimate the EEJ strength. The result shows that EEJ exhibits diurnal and seasonal variations and that its variability is stronger in African station than in Indian station, so also is the occurrence of counter electrojet (CEJ).
Keywords: Equatorial Elecrojet, Equatorial Ionisation Anomaly, Low-Latitude Ionosphere
The low latitude ionosphere is a site of important ionospheric phenomena, which includes the equatorial electrojet, equatorial plasma fountain, equatorial ionization anomaly, additional layers, plasma bubbles and spread F. In this study, emphasis is on the estimation and investigation of Equatorial Electrojet (EEJ) as applied to locations situated within the equatorial ionization anomaly (EIA) zone.
Equatorial Electrojet (EEJ) is the worldwide solar-driven wind that results in the solar quiet (Sq) current system in the E-region of the Earth's ionosphere (100–130 km altitude). Resulting from this current is an electrostatic field directed E-W (dawn to dusk) in the equatorial day side of the ionosphere. In the dayside ionosphere, the neutral winds set up a polarization electric field which usually points into the eastward direction. At the magnetic dip equator, where the magnetic field is exactly horizontal, this electric field has an interesting effect. The resulting upward drift of the electrons generate a negative charge at the top and a positive charge at the bottom of the ionospheric E-region. The electric field prevents the further upward drift of electrons. Instead, they are now propelled westward by the eastward electric field. This westward movement of the electrons constitutes an enhanced eastward current flow within ± 3o of the magnetic equator, known as the equatorial electrojet. The motion of the ions is largely inhibited at this altitude, due to their collisions with the neutral gas.
To study the equatorial electrojet (EEJ) variation, data for stations located near the equator and outside the edge of the electrojet strip for both African and Indian stations were obtained. For the African station, a locations at Addis Ababa, Ethiopia (geographic lat/long [9.03oN/38.76oE]) and at Mbour, Senegal (geographic lat/long [14.392oN/343.042oE]) were used, while Hyderabad station in India (geographic lat/long [17.413oN/78.555oE]) and Beijing Ming Tombs station in China (geographic lat/long [40.3oN/116.2oE]) were used for the Indian station. A one-minute resolution of the magnetic data was acquired from INTERMAGNET magnetometer. The data included the XYZ orientations of the magnetic field for the stations. The EEJ strength was estimated by obtaining vital quantities, such as the horizontal magnetic data (H), the daily baseline values ( ), the hourly departures of H from midnight baseline (∆ ). The hourly departure was corrected for non-cyclic variation, which will give the solar daily variation in H, or Sq(H) denoted by the solar quiet daily variation in H. The solar quiet daily variation in H was obtained for stations located near the equator (within the EEJ strip) and outside the edge of the electrojet strip.
Diurnal and seasonal variation of EEJ
The diurnal variations of EEJ over African and Indian stations during equinox, winter and summer in 2011 and 2012 are presented. In the Figures, the daily plots are in red colour while the seasonal mean diurnal values are in blue colours for the two years. The EEJ strength during equinox season in African station is higher than that at Indian station as shown in Figs. 1 and 2. The average values as indicated in blue colour was about 90 nT at African station and about 43 nT at Indian station for the both years. It was obvious from the Figures that EEJ exhibits diurnal variations as indicated in red colours. Counter electrojet was observed in the African station, with the amplitude value of about -40 nT for the average plot at about 13:00 UT in the two years. This was not the case in Indian station, where the counter electrojet was minimal, with amplitude value of about -5 nT and extended to the night period. The events occurred during the day, at about 11:00 to 16:00 UT as shown in Figure 1 and 2, hence known as afternoon counter electrojet.1-5
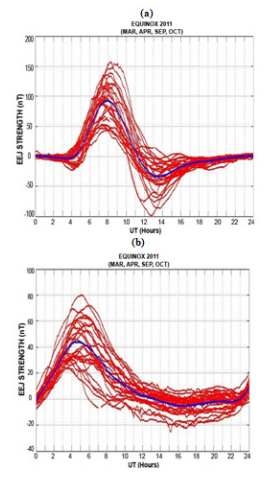
Figure 1 The EEJ Variations over (a) African and (a) Indian Stations During the Equinoctial Months of 2011.
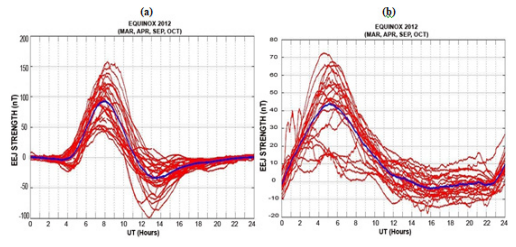
Figure 2 The EEJ Variations over (a) African and (b) Indian Stations During the Equinoctial Months of 2012.
Observations during winter and summer seasons were similar to that during equinox. The only difference was in the amplitude values of EEJ strength. The average values of the EEJ strength in African and Indian stations were 70 and 45 nT respectively during 2011 winter season (Figure 3). In 2012 also, as shown in Figure 4, EEJ strength in African station was higher (about 64 nT) than that in Indian station (about 39 nT). Occurrence of afternoon counter electrojet was also observed during winter, which was more pronounced in the African station.
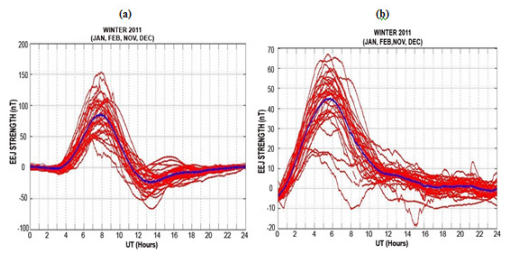
Figure 3 The EEJ Variations over (a) African and (b) Indian Stations During the Winter Months of 2011.
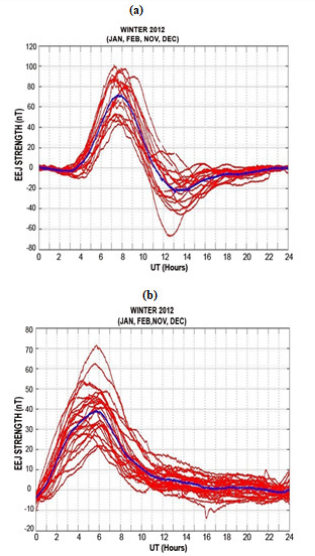
Figure 4 The EEJ Variations over (a) African and (b) Indian Stations During the Winter Months of 2012.
During summer however, the EEJ strength was about 70 nT in African station in 2011, while that at Indian station was about 64 nT as shown in Figure 5. However, the EEJ strength rose to 90 nT at the African station and dropped to about 32 nT at the Indian station.
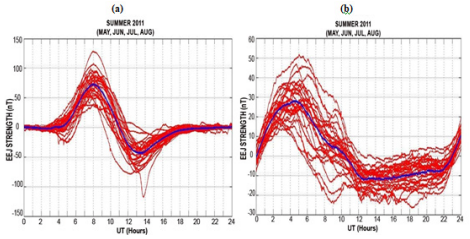
Figure 5 The EEJ Variations over (a) African and (b) Indian Stations During the Summer Months of 2011.

Figure 6 The EEJ and TEC Variations over (a) African and (b) Indian Stations During the Summer Months of 2012.
In general, the diurnal variations of EEJ over Africa also revealed that the CEJ events are frequent during all seasons. This is a slight deviation from the findings of Mayaud, Doumouya and Denardini,6-8 when they reported that CEJ events are more frequent and clear only during the Solstice months (winter/summer months) over African sector. It was also observed that CEJ events are more frequent during the early afternoon than during the pre-sunrise hours. The comparison of the diurnal variations of EEJ over African and Indian stations revealed that these events are more frequent in African station when compared to the Indian station. The variations in the amplitude of EEJ strength with seasons can be attributed to seasonal movement of the Sq foci northward and equator ward in a given year.
Monthly Mean Variation of EEJ
The monthly mean variations of EEJ for the two years were also investigated. Figures 7 and 8 show the variations of EEJ in African stations in 2011 and 2012 respectively. From the plots, the months of September, October and April recorded almost equal peak value of about 110 nT at about 08:00 UT in 2011. These months correspond to the equinox season. The same pattern of variation was also observed in 2012, where the months of September recorded the highest value of about 130 nT at about 08:30 UT, this was followed by the month of March, with a value of 115 nT and about 100 nT for the month of October. Observations also showed that the summer months recorded the least daytime peak. For instance, in 2011, the months of June and July recorded the least value of about 60 nT. The month of December (a winter month) also recorded low value of about 65 nT. It was also the case in 2012, where July recorded the least value of about 70 nT during the daytime maximum.
For the Indian station, the month of March recorded the highest EEJ value of about 62 nT at about 05:00 UT in the two years. In the two years also, the summer months recorded the least values, while the winter months are seen to be higher than some equinox months.
In general, there was significant day-to-day, month - to - month and seasonal variability in EEJ. The observations of counter electrojet predominant in African station are in agreement with the findings of Gouin and Mayand,1 where they found that the horizontal component of the Earth’s magnetic field (H) decreases rapidly for a few periods. This suggested a reversal of the current direction. This reversal of the east-west electric field during the CEJ events as explained by earlier works (e.g.8) is due to abnormal combination of global scale tidal wind modes. Mayaud7 observed that the counter electrojet is predominant during early morning and early afternoon hours in the African sector. In this work however, the counter electrojet was predominant during early afternoon in African station, while there was very little counter electrojet in Indian station, which also extended to night periods.
The observations of EEJ being dependent on seasons revealed that the equinoctial months recorded the highest value in the two stations. This was followed by winter months, except in 2012 in the African station where EEJ peaked at 85 nT in summer and 70 nT in winter. It is worthy to note that the variability of EEJ is stronger in African station than in Indian station, so also is the occurrence of counter electrojet.9,10
There was significant day-to-day, month - to - month and seasonal variability in EEJ, The variations of both EEJ during equinoctial months was consistently higher than that during winter and summer in the two stations. The occurrence of EEJ, as well as CEJ are more frequent and stronger in African station than in Indian station. The CEJ in African station was predominant during the early afternoon hours and the very few recorded in Indian station extended to night periods. The variability of EEJ is stronger in African station than in Indian station, so also is the occurrence of counter electrojet.
None.
None.

©2022 Olatunbosun, et al. This is an open access article distributed under the terms of the, which permits unrestricted use, distribution, and build upon your work non-commercially.