The sun is a star. Looking out into the night sky we observe many stars. However due to the great distance they appear much smaller and of reduced brightness as compared to the sun. It has been observed, that in the universe the stars are grouped into huge clusters called galaxies. Each galaxy has in average about 100 billion stars. The sun belongs to the milky way galaxy. In the night sky can be observed billions of such galaxies.
When observing light from distant object, if that object is moving away from us, the wave length of the light received will be greater than when it was emitted. If the object is moving towards us the wave length will be smaller than when it was emitted. This change in wave length is proportional to the velocity of the object.1,2
Sir Edwin Hubble in 1929 on observing galaxies noticed that there was a linear relationship between distance and velocity of the galaxies observed. The galaxies further from us were moving faster than galaxies closer. This observation came to be known as the Hubble law. These observations subsequently lead to the theory of the expanding universe or the big bang theory. This theory states that the universe started from a singularity or a single event and expanded 4 dimensionally creating both time and space and it continues to do so even now. The motion of the galaxies away from us is due to this expansion.
Thus in the currently held view, motion is understood as follows. Objects will be at rest or in relative motion to each other. Any change in the rate of motion is due to forces such as electrical, magnetic and gravity. This type of motion was first described by Sir Isaac Newton in his laws of motion. In addition to this, motion is also observed, as in the case of galaxies, due to the expansion of the universe.
Historically the story goes, that Sir Isaac Newton, on observing the fall of an apple, formulated the theory of gravitational force. He then went on to show that the motion of planets was also due to the same force of gravity, that makes an apple fall. The thought behind this paper is the following. Suppose Newton made the observation that Hubble did, that is galaxies are moving away from each other due to an expanding universe, would he have then tried to investigate if all motion, that is even the falling of an apple, can be due to the expanding universe?
It is this hypothetical question that is under investigation in this paper. Working with a hypothetical universe in which all motion is purely due to its expansion, leads to a change to the original equation put forward by Sir Edward Hubble. The presentation in this paper is in 2 main parts. In part 1, we investigate how well the new proposed equation fits the observed data. In part 2 we demonstrate how the equation is derived from the hypothetical universe.
Part 1: The proposed equation
(1)
D = Distance (Time taken for light to reach earth) T =Age of universe.
z = Red Shift
Hubble original equation rearranged.
(2)
H = Hubble’s Constant c = velocity of light.
z= Red shift.
The product zc in equation 2 gives the velocity of the galaxy.
The justification of the above equation shall be presented in 2 Parts. In part 1 the equation will be used to analyze available data. Its conformance with the data will give support to the theoretical concept leading to this equation given in part 2.
Conformance with data
The conformance with data will be carried out in 2 stages. In the first stage, Distance and red Shift observation will be used to calibrate the equation. In Stage 2 the calibrated equation will be used for prediction and comparisons.
Calibration
The constant T, is the age of the universe. In order to calibrate this value, observation where distance measurements, independent of Red Shift have been made will be used. It will be shown in part 2, that this equation is accurate when gravitational effects are low. As such high red shift data is preferable. However, there are no available red shift independent Distance measurements, for high red shift. As such we shall use 10 observations where the minimum red shift Z > 0.01. Table 1 gives the calibration data.
Description of columns
Column 1 Name: name of the stellar object
Column 2 Z: Red Shift = Wavelength of Received light/ Wavelength Sent Light Column 3
: Angular Distance (Explanation to follow in part 2).
Columns 4 to 6: Dmin, D, Dmax: The Distance measured via methods that do not depend on the use of red shift, Z
Columns 8 to 10: The Constant T or the age of the universe has been calculated using the inverse formula
for the 3 corresponding distances in Columns 4 to 6.
From this basic calculation it can be seen that T ranges 4000Mpc (14.4 Billion Light Years) to around 5000Mpc (16 Billion light years).
In this table a more detail analysis is carried out. The correlation coefficients (R) for the 2 relations:
(3) Hubble’s original version
(4) The proposed improvement
is calculated. It can be seen that both 1 and 2 give high values close to 1 for the correlation coefficients (R). Thus supporting both linear relationships. However, it is observed that for this data set, the proposed improvement (4) has a R value 0.993699854 > 0.992997374 the R value for the original equation (3).
The linear regression equation for the 2 cases can be seen to be
for (3)
for (4)
As can be seen in both cases the intercept for z = 0 will be ignored. Thus then the two equations become
(5)
Hubble’s original with Hubble’s Constant
(6)
Where T = 5038(Mpc) the age of the universe. The units of this constant can be in Distance unit or in Seconds. The conversion from distance to time is the speed of light C, just as the original equation. This value shall be taken as the calibrated value for the proposed equation.
It is important to recognize that equation 6 will give a distance measure in light years that is always less than the age of the universe as
Predictive test
In this section equation 5 and 6 shall be used to predict distances for
. The predicted distances shall be compared with published results. In Appendix 1 is given 225 objects with z and Distance measures by different formula.
Problems with published data for

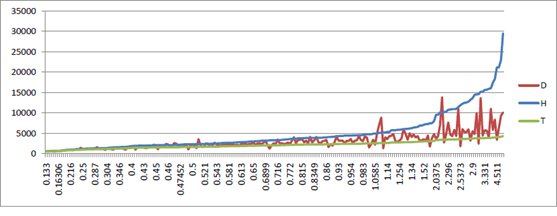
Figure 1 gives a graph of Distance vs z for this data set. From this graph, it is evident that a given value of z can give widely varying distance measurements. For example, GRB 980613 which has z = 1.09 has a distance measurement of over 7057Mpc using one method (GRB, ref 2006astro.ph.12285S), compare this with GRB 060607 that has z= 3.08 which is 3 times greater, yet has a distance measurement of only 4843Mpc (GRB 2006astro.ph.12285S), which is around 70% of GRB980613 distance given. Clearly not all formula can be right or it would have to be concluded that z alone cannot predict distance.
Further with the published data, take for example GRB 050904, it has z = 6.29 and a distance measurement of 10122Mpc = 32.99 billion light years. Now what does this value actually mean? If it corresponds to the distance the object is at currently, then this is a worthless measurement as it may well be that this object no longer exist. On the other hand, it cannot correspond to the actual time it took for the light to reach earth, as it is much higher than the highest estimates given for the age of the universe. Does it mean the age needs to be revised?
Comparison of equation 1 and 2 with published data

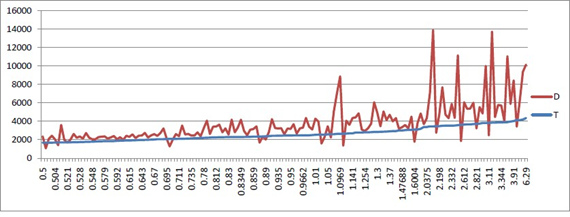
Figure 2 shows a graph of the published distance (D) together with Hubble’s original equation (H) and the new proposed equation (T). It can be seen immediately that Hubble’s equation gives values much larger than the published data. On the other hand, the proposed equation gives values that are generally less. However, it should be noted, that as the published data has a wide variation, the data does have values that correspond to the proposed equation for all ranges of z.

Figure 3 gives a plot for Z> 0.5 of just the published data (D) and the predicted values from the proposed equation (6). As can be seen, there are published values that match the predicted values.

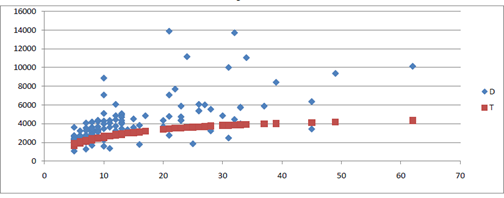
Figure 4 In order the compare the variation of the published values for a given z value, the published data has been grouped into z ranges of 0.1 each. That is all object with for example
has been put in Z group 1. are
in Z group 2 etc.
It can be seen from the scatter plot of Distance vs Zgroup, that the variation within groups is high. Further there are for example values in group 30 less than distance values in group 10. Superimposed on this scatter plot is the proposed equation (6). It can be see that, while the predicted values are generally less, there are published values that fall within the predicted range. Thus it can be concluded in comparing with published data, there is no reason to dismiss the proposed equation (6).
Part 2 The theoretical basis for equation 1

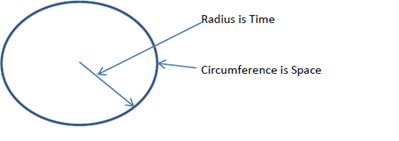
Figure 2.1 A 2D universe with 1 dimension of Time and l dimension of space.
Consider the following hypothetical model of a 2 Dimensional universe (UH) that starts as a point (similar to the Big Bang) and is expanding symmetrically, forming an expanding 2 Dimensional Circle. Let “time” be the radial Dimension. Let all of “space at present” be represented by the 1D Circumference of the circle. Thus each point in “space at present” would be a boundary point. Now the expanding universe would correspond to an increase in the radial dimension or time. If the circle is to remain a circle, then it would have to be accompanied by an equal increase of the circumference or space.
Thus the size of this 1D of space at any time t would be given by
(Constant = 1 if the unit measure for time and space is the same)
Thus
(7)
Let this CONSTANT = C = Speed of light UH
Now take the square of both sides, then we obtain the metric for a photon travelling in empty space (special relativity).
The above holds in our universe, in areas free of matter. Drawing a parallel with our universe it could well be that C the speed of light, is the ratio in which space/time is created and maintained by the expansion of the universe.
Hubble’s law
Consider again the case of the 2 dimensional universe UH. As stated previously d(space)/d(time) = C. Now consider 2 objects on the circumference. As this universe expands, these 2 objects will also move apart. However, the angle of the arc will always remain constant.
Let
be the distance between them at some time
. Then
= angle between points at the center of the circle = Constant = θ
Dividing by and rearranging gives
(8)
That is
. This velocity is the angle θ at the origin or big bang. Which is Hubble’s law where
Hubble’s Constant
Red shift and distance
Consider a segment of space or a length
at some time
. This segment of length will always subtend a fixed angle
at the origin with the progress of time. Thus consider it length
sometime later at
. The angles
is constant as given in equation (8). Thus we have
(9)
Rearranging
( where z = redshift)
Time Taken
(10) The proposed equation (1).
Special relativity
Consider again the case of the 2 dimensional universe. UH
Consider 2 reference frames O and O’ such that at some time
O’ is
distance from O. Thus from (8) above its velocity as seen by O is given by
which is a constant.
It is worth noting that this corresponds to Newton’s first law as
will remain constant with expansion. Let the units of the Time dimension be such that the constant in 7 is
. (It has the same unit’s as S that is space as such it correspond to a simple circle).
Thus we have
the Circumference of the circle or total of all space at the time
.
will be maintained as this 2d universe UH expands.
Consider a beam of light leaving O at T0 and Travelling towards O’ at a velocity
or the speed of light in this universe.
In O’ this light beam would have to travel a distance
. Let’s say it takes a time
’. Then we get
(11)
Consider the passage of the light as seen by O. As in the time the light travels, O’ is moving away from O at a velocity
, it will see as having to travel a greater distance. Thus we get
Substituting from 11
Rearranging
Dividing both sides by
we get
(12)
12 is the time dilation equation of special relativity. To see the correspondence with our universe we can equate the constants
as it is a ratio and should be the same. Thus if O’ is moving away from O at a velocity
we get.
(13)
Where C is the velocity of light in the common coordinate system. Squaring both sides and solving 5 for
(14)
It can be seen by substitution when
the velocity of light in this coordinate system we get
the velocity of light, as is to be expected.
By substituting
We get
(15)
Which is length contraction of Special relativity.
The intent of the demonstration above is not to propose that the shape of the universe is spherical but rather to demonstrate that if the universe had a shape and maintained that shape with the expansion, then the expansion alone can account for the laws of motion.
General relativity
Around matter this expansion is changed, that is d(space)/d(time) is not equal to C. It could well be that matter is none other than those areas in which this constant is made less than C. Thus matter would be seen to attract each other or gravity would be proportional to the extent that matter has altered this constant C around it. Thus the curvature of general relativity is a direct consequence of a reduction in the ratio of space/time in the expansion around matter.
To give an example, take the following solution by Sir Arthur Stanley Eddington to the General Relativity field equations.
(15)(2.11)
Setting
gives the metric for a beam of light, which is proposed to be also the ratio of space/time creation in the localized expansion around matter.
Thus
(16)(2.12)
The increase in entropy or disintegration of matter would be a direct result of the rate of expansion within matter tending towards the rate C which is the rate of empty space Time.


