The first thing that attracts attention when considering these spectra is that unlike the translational spectra of noble gases and mixtures of H2 with Ar, Kr, and Xe,2 practically the entire absorption band with a maximum and wings up to a level of 5–10% with respect to absorption at the maximum. An exception is the spectra of N2 and N2 + Ar at room temperature, whose high–frequency wing at the boundary of the investigated range had an intensity only half the intensity at the maximum.
The spectra of CO2 and CO2 with argon, because of the large quadrupole moment of the CO2 molecule, are almost an order of magnitude stronger than the spectra of N2 and N2 +Ar. Spectra of pure N2 and CO2 more intense than the spectra of the mixtures with argon. While the intensity of the spectrum of the CO2 + Ar mixture differs several times from the intensity of the CO2 spectrum, the intensity of the N2 + Ar spectrum differs insignificantly from the N2 spectrum.
This fact reflects the difference in the polarizability of CO2 and argon: αco2=2.93∙10–24cm3, αAr=1.63∙10–24cm3, and the proximity of the polarizability of N2 and argon (αN2=1.74∙10–24cm3). In this case, as in the case of mixtures of H2 with Ar, Kr and Xe, we are dealing here with spectra induced by the electrostatic mechanism–quadrupole induction, but in contrast to the spectra of mixtures of H2 with Ar, Kr, and Xe in the spectra of N2 and CO2 and their mixtures with argon, individual rotational lines will no longer be resolved and not because of the insufficient resolution of the spectrometer
, but because these lines, for example, in the case of N2 from each other by 8 cm–1,10 will be significantly broadened by the translational effect. According to,11
, where d is the collision diameter, M is the reduced mass of the colliding particles. Assuming the value of d to be proportional to the value of the parameter σ of the Lennard–Jones potential, it is easy to compare it with the width of the rotational lines of H2: for nitrogen,
, for carbon dioxide
.
The temperature behavior of the spectra is in agreement with their assignment to the rotational–translational class induced by the quadrupole field. With decreasing temperature, the spectrum shifts to the low–frequency region in accordance with the redistribution of molecules along rotational levels. It should, however, be pointed out that the maxima of the recorded absorption bands, due to the asymmetric broadening of the rotational lines, by the translational effect, are shifted to the high–frequency region with respect to those predicted by the theoretical rotational spectrum. (In Figure 2–7, the theoretical rotational spectrum is shown by vertical lines). To learn from the spectra of further information, a computer calculation of the integrated absorption intensities was carried out. From the theory of rotational–translational spectra developed by Kiss & Van Kranendonk12, it follows that the binary absorption coefficient of a mixture of diatomic molecules with monatomic
(1)
where
,and L(J) is the result of averaging over the rotational states of the molecule; I, Iʹ, F, Fʹ, K, Kʹ, and D are configuration integrals, similar to the integrals F, F′ in expression (7); Q is the quadrupole moment of the molecule; α is the polarizability; γ–anisotropy of polarizability; i is the moment of inertia.
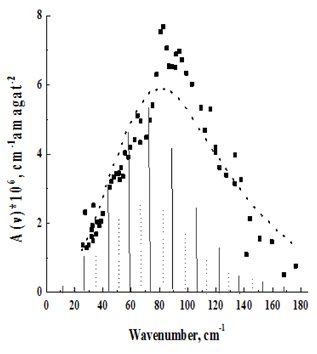
Figure 2 Rotational–translational spectrum N2 at T=1380 K.
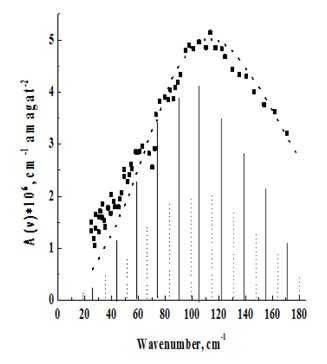
Figure 3 Rotational–translational spectrum of N2 at T=2980 K.
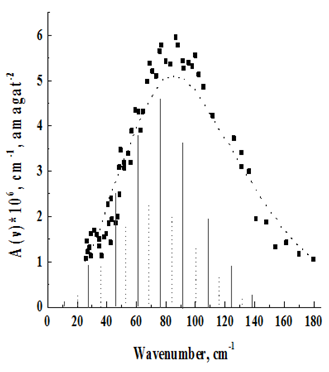
Figure 4 Rotational–translational spectrum N2+Ar at T=1380 K.

Figure 5 Rotational–translational spectrum of N2 + Ar at T=2980 K.
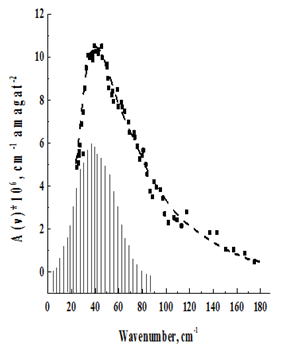
Figure 6 Rotational–translational spectrum CO2 at T=2150 K.
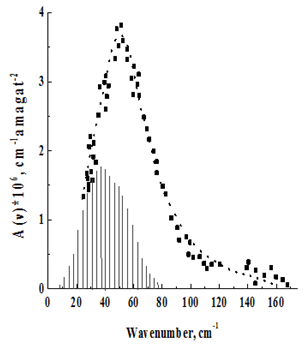
Figure 7 Rotational–translational spectrum of CO2 + Ar at T = 2150 K.
The first term in (1), proportional to the integral I–is the contribution of the overlapping mechanism, the second and third, proportional to the integrals F and F', are respectively translational and rotational contributions to the spectrum due to the quadrupole induction mechanism. The terms proportional to the integrals K and K' are respectively translational and rotational contributions to the interference spectrum between the quadrupole mechanism and the overlapping mechanism. Finally, the last term, in square brackets, is the term proportional to the integral F' is the contribution of the double transitions due to the anisotropy of the polarizability: ΔJ1=2, ΔJ2=2 or ΔJ1=2, ΔJ2=0.
Since the contribution to the band is due to absorption due to quadrupole induction, according to formula (2),
(2)
where p are the Boltzmann factors and Z is the Racah`s coefficients for the quantum numbers J, V (R) is the pair interaction potential of the Lennard–Jones or Kihara type, which is obtained from (1) when only the electrostatic induction mechanism is taken into account, the relative intensities of the rotational lines of the branches S(J), O(J) and Q(J) are determined. (The branch O(J)–(transitions ΔJ=–2) corresponds to stimulated emission, which plays an important role in the formation of the total contour of the band at not too low temperatures, especially near zero frequencies. The branch Q(J)–(transitions ΔJ=0) gives a line at one frequency ν=0; however, due to broadening, its high–frequency wing must also be taken into account when calculating the total spectrum. In principle, the branch Q(J) corresponds to purely translational transitions). Each rotational line was then "broadened" on the PC and described purely formally, as in the case of spectra of mixtures of H2 with Ar, Kr and Xe, a curve of the form:
(3)
Proposed in Kouzov13, The parameters of this contour B, £, and v0 were varied so that the experimental contour was combined with the calculated one in the best way. The values of B, £, and v0, together with the values of the integrated intensities found in the calculation, are given in Table 2.
Spectra
(Parameters of the contourof the line in equation (3)) |
N2
(T=1380K) |
N2
(T=2980K) |
N2+Ar
(T=1380K) |
N2+Ar
(T=2980K) |
CO2
(T=2150K) |
CO2+Ar
(T=2150K) |
|
3,3 |
4,2 |
2.9 |
4,0 |
400,0 |
103,4 |
|
1,0 |
0,7 |
1,0 |
0,3 |
1,0 |
1,0 |
|
21,6 |
25,7 |
23,5 |
25,3 |
13,2 |
25,0 |
|
5,65 |
6,45 |
5,25 |
5,80 |
71,0 |
18,6 |
Table 2 The integrated intensities of spectra.
Having the values of the integral intensities now it is possible, if the quadrupole moments of the N2 and CO2 molecules are known, to assess the role of the induction mechanisms in the formation of the rotational–translational spectrum. For the N2 molecule, the values of the quadrupole moments1 obtained by different methods differ somewhat from each other.
So, from the quantum mechanical calculations, we obtain
14 obtained from the second virial coefficient and from measurements of the spin relaxation of
.15,16 Intermediate values were found using data on induced spectra: on the vibrational–rotational spectrum of H2 + N2 at: room temperature
;17 on the rotational–translational spectrum of N2 at room temperature–
,11
18 and
.19
We set ourselves the task, having set the induction mechanism, to determine the quadrupole moment of the N2 molecules from the integrated intensity of the spectra recorded by us. We recall that according to (1), the following induction mechanisms take part in the formation of the rotational–translational spectrum. The first term in (1), which is proportional to the integrals I and I', is the contribution of the overlapping mechanism. The second and third terms proportional to the integrals F and F' are, respectively, translational and rotational contributions to the spectrum due to the quadrupole induction mechanism. The terms proportional to the integrals K and K' are translational and rotational contributions of the interference between the quadrupole induction mechanism and the overlapping mechanism. Finally, the last term, in parentheses, is the term proportional to the integral F', which is the contribution of the double transitions due to the anisotropy of the polarizability: ΔJ1=2, ΔJ2=2 or ΔJ1=2, ΔJ2=0.
In,11,18,19 calculating the quadrupole moment of the N2 molecule, it was assumed that the contribution of the overlapping mechanism to the spectrum of pure nitrogen is negligible. Indeed, in the collision of two identical particles, the coefficient characterizing the main part of the dipole moment of overlap is zero for symmetry reasons.
The contribution of transitions due to polarizability anisotropy to the total absorption intensity does not exceed, apparently, 1–2%. Thus, according to the data of,3 in the induced rotational spectrum of CO2, the polarizability anisotropy of which is larger than for N2, only 5% of the intensity is associated with these transitions.
Neglecting the contribution of the overlap mechanism and the contribution of the transitions due to the anisotropy of the polarizability, from (1) we obtain the following expression for the binary absorption coefficient of the rotational–translational band:
(5)
Hence, knowing the integral intensity of the N2 spectrum, we can determine QN2. Using the integrals F and F′ calculated with the Lennard–Jones potential, tabulated,12,20 we obtain from the intensity of the N2 spectrum at room temperature:
, the intensity of the N2 spectrum at T = 1380 K is
.
In determining QN2 from the spectra of the N2 + Ar mixture, the assumption of a negligible contribution of the overlapping mechanism should apparently remain in force: in the case of collision of N2 with Ar, practically isoelectronic particles interact. If we use the correlation we found between the difference between the polarizabilities of the colliding atoms and the dipole moment parameter λ, from the graph of Figure 6 of the article21 with
, we can obtain
. The intensity calculated for this λ is no more than 1% of the recorded absorption2>. Thus, if the overlapping mechanism is neglected, using equation (4) for the intensity of the N2 + Ar spectrum at room temperature, we obtain
, and from the intensity of the N2 + Ar spectrum at
. These values are close to those obtained by other methods.
Moreover, the values determined from the low–temperature spectra of N2 and N2 + Ar agree better. A few overestimated values, found from spectra recorded at room temperature, seem to reflect the effect of absorbing impurities, which could not be eliminated during nitrogen purification. If we assume that the assumption of the predominant role of the quadrupole induction mechanism in the formation of the rotational–translational spectrum is also valid in the case of CO2, calculation by formula (4), analogous to the calculation of QN2, leads to the following QCO2 values: from the induced spectrum of pure
, from the spectrum of a mixture of CO2 with argon
.
These quantities, generally speaking, are close to those obtained by other authors from the rotational–translational spectrum of CO2:
;22
,
3 but slightly differ from the most accurate of the currently known values of
.
23
To clarify our calculation of
in terms of the intensity of the spectrum of the CO2 + Ar mixture, we took into account the fact that this spectrum is due to its origin in addition to quadrupole induction, also the induction of overlap. Indeed, in contrast to the interaction of two isoelectronic particles of type N2 and Ar in the collision of CO2 and Ar, the isotropic part of the dipole moment of overlap is obviously not equal to zero. Evidence for this can be found in Bar-Ziv24, in which a high–frequency wing from the center of a mixture of CO2 + He was investigated at room temperature. It shows that in the region of 250 cm–1, the binary absorption coefficient of the CO2 + He mixture is only 3 times lower than in the pure CO2 spectrum, whereas in the case of the small contribution of the overlapping mechanism it must differ in
times. The intensity of the rotational–translational spectrum with allowance for the contribution of the induction of overlap is determined by the expression (1). From it, roughly estimating the graph of Figure 6 of the previous work, the parameter
and using the integrals I, I′, F, F′, K and K′ tabulated in Poll et al.21 and,12 we have:
.
To correct the calculation of the QCO2 value from the intensity of the rotational–translational spectrum of pure CO2 as the interaction potential, instead of Lennard–Jones, the potential of Kihara was used:
(6)
with the following parameters:
,26 which, as was shown in Kihara27 & Datta et al.28 more precisely than the Lennard–Jones potential, conveys the features of the interaction of molecules of similar CO2.
When the Lennard–Jones potential G(R)=exp [–V(R)/ kT] is replaced by the Kihara potential, the integrals F and F1 in expression (4) become:
(7)
where x=R / σ; b=2a / σ.
Calculating them on a PC and substituting in (4), we have obtained
.
1In this paper, the molecular quadrupole moment is determined by the expression:
(4)
where ρ is the charge density, r and θ are the polar coordinates with respect to the center of mass molecule (the polar axis is directed along the internuclear axis), and dτ is the volume element.
2Recall that the correlation between λ and Δα, shown in work21 was established from the translational spectra of mixtures of He and Ar, Kr and Xe, and we use it here only for estimating calculations. In the calculations, and relied on the basis of the data of ,25 are the same.


