Analytic result
In the model of AB interstitial alloy with the face–centured cubic (FCC) structure, the A atoms with large size stay in the peaks and the face centers of cubic unit cell and the C interstitial atoms with smaller size stay in the body center. In6,7 we derived the analytic expressions of the nearest neighbor distance, the cohesive energy and the alloy parameters for atoms B, A, A1 (the atom A in the face centers) and A2 (the atom A in the peaks).
The equation of state of the AB interstitial aloy with FCC structure at temperature T and pressure P is described by
(1)
At 0K and pressure P, this equation has the form
(2)
Knowing the form of the interaction potential
,equation (1) allows os to determine the nearest neighbor distance
at 0K and pressure P. Knowing
we can determine the parameters
at 0K and pressure P for each case of X. The displacement
of atoms from the equilibrium position at temperature T and pressure P is determined.6,7 From that, we can calculate the neares neighbor distance
at temperature T and pressure P as follows
(3)
The mean neares neighbor distance between two atoms in AB interstitial alloy with FCC structure is approximately determined by
(4)
The free energy of AB interstitial alloy with FCC structure and concetration condition
has the form
(5)
where
is the free energy of A atom in A pure metal,
is the free energy of B atom in interstitial alloy,
and
respectively are free energy of A1 and A2 atoms and Sc is the configuration entropy of AC interstitial alloy.
The pressure is calculated by
(6)
Setting
(7)
Here,
is the Grüneisen parameter of ABalloy. Then,
(8)
From the condition of absolute stability limit
hay
(9)
we can derive the absolute stability temperature for crystalline state in the form
(10)
In the case of zero pressure,
(11)
Because the curve of absolute stability limit for crystalline state is not far from the MS of crystal, the Ts temperature usually is large and
at
. Therefore,
(12)
That is the equation for the curve of absolute stability limit for crystalline state. Therefore, the pressure is a function of the mean nearest neighbor distance
(13)
Temperature Ts (0) at zero pressure has the form
(14)
where the parameters
are determined at
. Temperature Ts at pressure P has the form
(15)
Here,
is the Boltzmann constant,
dare determined at
. Approximately,
. In order to solve equation (15), we can use the approximate iteration method. In the first approximate iteration,
(16)
Here
is the temperature of absolute stability limit for crystalline state at pressure P in the first approximate iteration of equation (15). Substituting Ts1 into equation (15), we obtain the better approximate value Ts2 of Ts at pressure P in the second approximate iteration
(17)
Analogouslty, we can obtain the better approximate values
of Ts at pressure P in the thierd, fourth, etc. approximate iterations. These approximations are applyed at low pressures.
In the case of high pressure, the MT of alloy at pressure P is calculated by
(18)
where
and
respectively are the MT at pressure P and zero pressure,
and
respectively are the rigidity bulk modulus at pressure P and zero pressure,
is the isothermal elastic modulus at zero pressure,
is the isothermal elastic modulus at pressure.
Numerical results for alloys AuSi and AgSi
For alloys AuSi and AgSi, we use the n–m pair potential
(19)
where potential parameters are given in Table 1.8
Material |
m |
n |
width="130" |
|
Au
Ag |
5.5
5.5 |
10.5
11.5 |
6462.540
4589.328 |
2.8751
2.8760 |
Si |
6.0 |
12.0 |
45128.340 |
2.2950 |
Table 1 Potential parameters
of materials
Considering the interaction between atoms Au(Ag) and Si in the above mentioned alloys, we use the potential (19) but calculating approximately
. Parameters
and
are taken empirically.
At 0.1 MPa, Au has a FCC structure with
at 300K and the melting point at 1337 K. The melting curve of Au is determined up to 1673 K and 6.5 GPa with the slope dT/dP = 60 K/GPa9,10 and up to 1923 K and 12 Gpa.11
At 0.1 MPa, Ag has a FCC structure with
at 300K and the melting point at 1235 K. The melting curve of Au is determined up to 1563 K and 6.5 GPa with the slope dT/dP = 60 K/Gpa.9
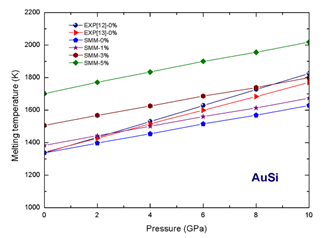
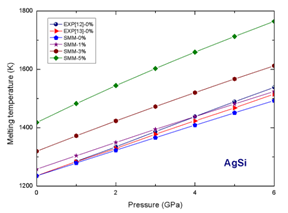
Our numerical results are summarized in tables from Table 2 to Table 3 and illustrated in figures from Figure 1 to Figure 2. The concentration of interstitial atoms changes from 0 to 5% and the pressure changes from 0 to 10 GPa for Au and from 0 to 6 GPa for Ag.

Figure 1 Dependence of melting temperature on pressure and concentration of interstitial atoms for alloy AuSi.

Figure 2 Dependence of melting temperature on pressure and concentration of interstitial atoms for alloy AgSi.
x(%) |
P(GPa) |
0 |
2 |
4 |
6 |
8 |
10 |
0 |
SMM |
1337.33 |
1397.27 |
1454.33 |
1514.75 |
1568.48 |
1629.22 |
|
EXPT [31] |
1337.33 |
1432.90 |
1530.15 |
1628,63 |
1727.10 |
1824.36 |
|
EXPT [44] |
1340.30 |
1426.80 |
1515.77 |
1599,80 |
1683.84 |
1770.34 |
1 |
SMM |
1382.99 |
1443.15 |
1500.10 |
1560,32 |
1613.50 |
1673.78 |
3 |
SMM |
1505.78 |
1567.89 |
1625.75 |
1686,56 |
1739.30 |
1799.29 |
5 |
SMM |
1701.80 |
1771.20 |
1834.58 |
1900,23 |
1955.89 |
2018.94 |
Table 2 Dependence of melting temperature on pressure and concentration of interstitial atoms for alloy Au–xSi
x(%) |
P(GPa) |
0 |
2 |
4 |
6 |
0 |
SMM |
1234.93 |
1322.75 |
1408.68 |
1492.95 |
|
EXPT[31] |
1234.93 |
1334.42 |
1438.19 |
1538.81 |
1 |
SMM |
1257.82 |
1349.70 |
1438.34 |
1524.38 |
3 |
SMM |
1319.47 |
1423.32 |
1520.45 |
1612.43 |
5 |
SMM |
1418.12 |
1544.47 |
1659.14 |
1764.81 |
Table 3 Dependence of melting temperature on pressure and concentration of interstitial atoms for alloy Ag–xSi
According to our numerical results for alloy AuSi at the same concentration of interstitial atoms Si when pressure increases, the melting temperature increases. For example at
when P increases from 0 to 10 GPa,
of alloy AuSi increases from 1701.8 K to 2018.94 K. At the same pressure when the concentration of interstitial atoms Si increases, the melting temperature increases. For example at P=10 GPa, when
increases from 0 to 5%,
of alloy AuSi increases from 11629.22 K to 2018.94K.
According to our numerical results for alloy AgSi at the same concentration of interstitial atoms Si when pressure increases, the melting temperature increases. For example at
when P increases from 0 to 6 GPa,
of alloy AgSi increases from 1418.12 K to 1764.81 K. At the same pressure when the concentration of interstitial atoms Si increases, the melting temperature increases. For example at P=6 GPa, when
increases from 0 to 5%,
of alloy AuSi increases from 1492.95 K to 1764.81K (Table 3).
At zero concentration of interstitial atoms Si, the melting temperature of alloys AuSii and AgSi respectively becomes the melting temperature of metals Au and Ag. The melting temperature of substitution alloys AuCu and AgCu is smaller than the melting temperature of metals Au and Ag, respectively. The dependences of melting temperature on pressure and concentration ò interstirtial atoms Si for alloy AuSi and AgSi are shown in (Figure 1) (Figure 2).
The calculated results for the melting temperature of metals Au and Ag are in goog agreement with the experimental data12 (deviation is about sereral percents) (Table 4) (Table 5).
Metal |
Au |
Ag |
–SMM
–EXPT[12] |
1400
1336 |
1190
1234 |
Table 4 The melting temperatures of metals Au and Ag at zero pressure
P(GPa) |
Method |
1 |
2 |
3 |
4 |
5 |
6 |
Au |
SMM
EXPT[12] |
1476
1383 |
1543
1455 |
1602
1513 |
1651
1575 |
1693
1625 |
1728
1667 |
Ag |
SMM
EXPT[12] |
1282
1300 |
1367
1353 |
1443
1403 |
1513
1462 |
1575
1509 |
1631
1549 |
Table 5 The melting temperatures of metals Au and Ag under pressure


