eISSN: 2576-4543


Research Article Volume 7 Issue 1
International Arctic Research Center, University of Alaska Fairbanks, Alaska, USA
Correspondence: Syun-Ichi Akasofu, International Arctic Research Center, University of Alaska Fairbanks, Alaska, USA, Tel 907-474-6012, Fax 907-474-5662
Received: February 18, 2023 | Published: February 24, 2023
Citation: Syun-Ichi A. Propagation of Solar disturbances in the heliosphere to a distance of 100 au. Phys Astron Int J. 2023;7(1):39-44. DOI: 10.15406/paij.2023.07.00282
Explosive solar activities cause heliospheric disturbances. A simple scheme of simulating the propagation of shock waves in the heliosphere is devised to study such disturbances caused by solar flares. This scheme, the HAF scheme, is capable of simulating the propagation of many shock waves generated during extended periods up to a distance of 100 au (200 days) during periods when many solar disturbances can occur. The capability of the scheme is demonstrated in reproducing: (1) Multi-events with multi-satellite data within 2 au: (2) The heliospheric conditions at Ulysses/ Cassini within 10 au. (3) A successful reproduction of a Pioneer 11 event at 30 au. (4) The heliospheric condition up to 100 au in 2004, in addition to (5) reproducing recurrent geomagnetic srorms. Thus, the method presented here is simple enough in predicting a rough overall pattern of heliospheric disturbances on a day-to-day basis without MHD simulations. In this paper, we assembled systematically (in terms of distance from the sun) the above multiple results during the development of the HAF scheme in different periods by many researchers. It is hoped that much better schemes will be developed by extending and improving the HAF scheme.
Keywords: heliosphere, shock wave, CME, solar flare, Pioneer 11
It is worthwhile to look back our knowledge of space weather and heliospheric disturbances before the early 19560s. It was thought then that interplanetary space was basically vacuum, except the presence of intermittently ejected solar gases and long-life streams; Figure 1. In 1958, the solar wind was introduced by Parker.1
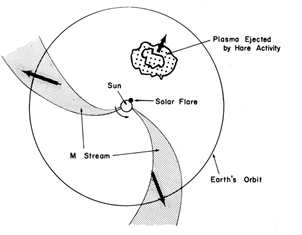
Figure 1 The heliosphere in the early 1950s. The space was considered to be vacuum, except occasional gas clouds and streams, ejected by the sun; Akasofu.2
A few statistical results of solar-terrestrial relationship were available about that time. One of them is the arrival time of the shock waves, which is estimated from the time of inferred solar flare and sudden commencement (ssc) of geomagnetic storms. Figure 2 shows such an example; in this study, one of the difficulties was the identification of responsible flare for each geomagnetic storm, in particular when the sun was very active. Nevertheless, it can be seen that the average arrival time is about 40 hours.
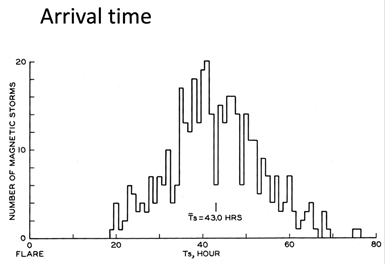
Figure 2 The arrival time of solar gases after solar flares; Yoshida and Akasofu.3
Another example is the relationship between the location of solar flares with respect the central meridian and the intensity of resulting geomagnetic storms. For this purpose, the intensity of geomagnetic storms measured by the magnitude of the main phase decrease DR (recorded at the Honolulu observatory [published yearly by the USGS in 1950-1970] and solar flare data [published monthly by the NOAA/Boulder, Colorado in the 1950-1970]) were examined. This is a very important result, which shows how widely the energy of coronal mass ejections (CMEs) spreads (Figure 3); it is limited to the angle of about 60°; Yoshida and Akasofu.3 However, as shown later by space probs and by simulation studies, the shock waves associated with CMEs are known to spread over much wider angles.
Another crucial point in Figure 3 is that intense flares (circle with dot; caused solar cosmic ray events and the Polar cap absorptions [PCA]) located around the center line of the sun do not necessarily produce in Intense geomagnetic storms. This is mainly because the storm intensity depends greatly on the power generated by the solar wind-magnetosphere interaction (or the orientation of the interplanetary magnetic field or the Bz component of the IMF). Thus, without predicting the magnitude of the Bz component, an accurate forecasting of the intensity of geomagnetic storms, one of the main purposes of space weather forecasting, is practically not possible. This will be further discussed in Section 5.
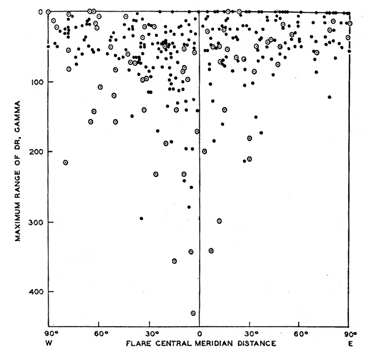
Figure 3 The geomagnetic storm index (DR), the main phase decrease observed in Honolulu, dependence on the central meridian distance; Yoshida and Akasofu.3
When extensive MHD simulations of the propagation of solar flares initiated by Dryer,4 Hakamada and Akasofu5 explored a much simpler way (as a first approximation) to infer the propagation of shock waves caused by several solar flares within several days, because MHD simulation methods could not handle well multiple solar events, particularly when the sun was very active for extended periods. The method thus developed is called the HAF (Hakamada-Akasofu-Fry) scheme. There have been several attempts to improve the scheme; Akasofu and Fry.6
Several tests of the scheme were conducted by examining its results with MHD simulation results and others for many solar flare events by comparing the simulated arrival time of shock waves with observations. Although the simulation of the propagation of shock waves has become now a routine project at NOAA, Boulder, Colorado, it is shown in this paper that the HAF scheme could reproduce reasonably well the propagation of shock waves within 2 au by comparing simulated multi-shock waves with observed ones by multi-space probes. Further, as shown later, the heliospheric condition within a distance of 10 au (Ulysses, Cassini) was constructed. The heliospheric disturbance at a distance of 30 au (Pioneer 11) was well reproduced. Furthermore, it is attempted to reproduce heliospheric disturbances to a distance of 100au in the early 2004 (2004 days); the scheme is stable enough to be extended to 100 au, about 200 days of events.
The scheme was also extended to study a 3-D observation based on interplanetary scintillation.
(a) The basic scheme
Although the basic principle of the HAF scheme is given in Hakamada and Akasofu5 and Akasofu and Fry,6 the basic concept of the HAF scheme is briefly given here.
First of all, the velocity distribution of the solar wind is assumed on the source surface (concentric sphere of radius of 3 solar radii); Figure 4 (upper, the Carrington Rotation map on the source surface). Such a sinusoidal distribution can be seen for an extended period of the solar cycle, particularly during the declining period of the cycle.
In Figure 4 (upper), as the sun rotates, a fixed point in space (not fixed on the sun near the photospheric surface observes two half-sinusoidal variations of the speed as a function of time during one rotation of the sun (Figure 4, lower). Thus, the sun sends out two half-sinusoidal waves into the heliosphere per each rotation as Figure 4 (lower) shows.
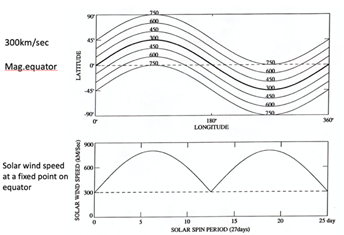
Figure 4 Upper: The speed distribution of the solar wind on the photosphere. Note that the magnetic equator (the speed is 300 km/s) is inclined from the ecliptic equatorial plane. Lower: The speed variation during one rotation of the sun at a fixed point near the photospheric surface, but not fixed on the sun.
As the two half-sinusoidal waves propagate outward, the speed of each wave as a function of distance from the sun can be simulated by an ordinary MHD simulation by Dryer,4 as shown in Figure 5; a distinct shock wave structure is formed at a distance of about 7 au in this case.
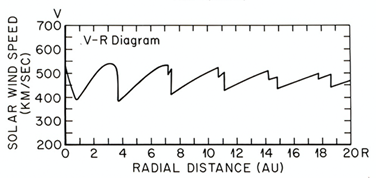
Figure 5 The resulting speed distribution of one of the half-sine wave as a function of distance from the sun. Note that a distinct shock is formed at about 7 au in this case.
As a test, the pattern of the interplanetary magnetic field (IMF) within 2 au for the above initial conditions is shown in Figure 6a. It shows Parker spiral structure and two co-rotating structures. Figure 6b shows the Carrington map of the magnetic field; when the wind distribution on the source surface is available, it is used instead of Figure 4. Figures 6c shows the heliospheric current sheet (HCS) to a distance of 2 au, which is based on the magnetic equator on the source surface (Figure 6b). Since the earth is located above or below during one solar rotation period, the expected IMF polarity is well reproduced; Akasofu and Fry.7
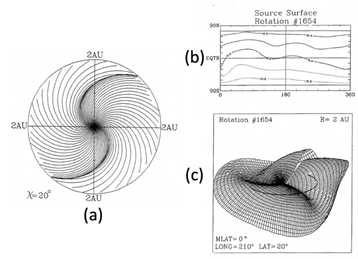
Figure 6 (a) The resulting interplanetary magnetic field lines within the distance of 2 au. Note two co-rotating structures. (b) The magnetic field distribution on the source surface. (c) The corresponding heliospheric current sheet based on Figure 6b; the earth’s orbit is shown; Akasofu and Fry.7
(b) Simulated geomagnetic storms
Figure 7 (left) shows the computed solar wind variations (IMF magnitude, angles) at the distance of the earth during the period of one solar rotation for the conditions shown in Figure 4; Figure 7 (right) shows the corresponding observed 27-day variations; the agreement is reasonable, Akasofu et al.8 For corresponding geomagnetic disturbances, it is assumed that the IMF angle changes with respect to the magnetic equator of the earth are represented by sine waves and the resulting magnetic disturbances (AE/Dst) are produced from the estimated Bz and the empirical relationship between IMF Bz and AE/Dst indices. The observed solar wind changes and two geomagnetic storms during one Carrington rotation period (27 days) are reasonably well reproduced by the HAF method.
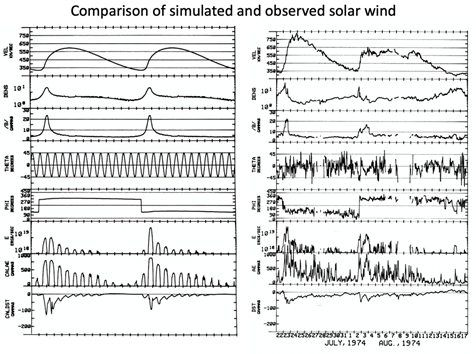
Figure 7 Left: The resulting solar wind speed, density and the IMF B during 27 days. The angle with respect the heliomagnetic equator is assumed to be sinusoidal variations. For the simulated AE/Dst, see the text. Right: An example of the observed solar wind and the AE/Dst indices.
The magnetic equator during the sunspot cycle was studied by Saito et al.9 on the basis of the Wilcox Solar Observatory (WSO) observation. It is shown in Figure 8. It can be seen that the magnetic equator and magnetic equatorial plane tilt considerably during the solar cycle. The magnetic dipole axis rotates 180°. These changes can be represented approximately by a sinusoidal magnetic equator in the Carrington map as shown in Figure 4. Thus, depending the epoch of the solar cycle, Figure 4 should be modified or use the WSO data for the studying epoch to estimate the magnetic equator on the source surface.
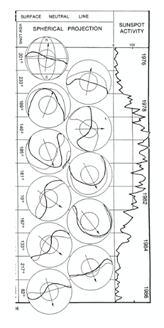
Figure 8 The solar cycle variation of the magnetic equator on the source surface, determined by the spherical harmonic analysis, based on the neutral line on the photosphere (WSO) and the sunspot number; Saito et al.9
(c) Solar flares: Shock waves
A solar flare is represented by adding a circular speed distribution at the reported location of flares (longitude, latitude in the Carrington map in Figure 4 [Upper]), as shown in Figure 9a. Then, the simulation is made by taking into account of the relative location of the earth with respect to the central meridian distance at the time of flare as the sun rotates. The intensity of flares can be adjusted in terms of the radius of the circle and the speed at the center of the circle. Time variations of the flare intensity can be included by following the intensity variation of the Ha emission. A sequence of flares, if they occur, can be added in the same way as mentioned on the same day, next day or after weeks or months later.
Figure 9b shows an example of the simulated multi events. The HAF scheme is simple enough to adjust those parameters (the initial speed, time variation) until the arrival time agree with the observation. All the parameters are adjusted to the observed arrival time of the shock waves. The simulated results thus obtained are reasonably accurate and thus useful in studying the propagation of the shock waves between the sun and the earth. The red lines indicate the IMF is directed away (positive) from the sun, and the blue lines indicate the IMF is directed toward (negative) the sun.
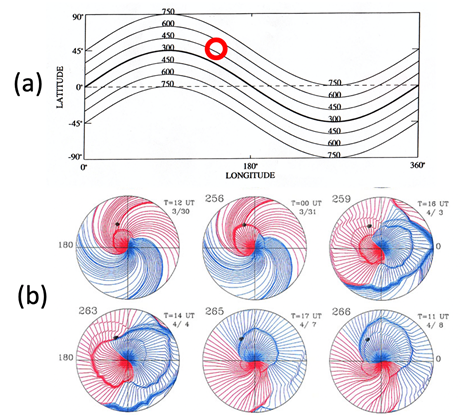
Figure 9 Simulation of a flare. Upper: The reported location of the flare is shown as a circle. The intensity of flare is given in terms of the size of the circle and the speed at its center. The simulation is made by taking into account the relative location of the flare and the earth. Lower: An example of simulation in the case of multiple flares. The red lines indicate positive (away from the sun), and blue negative (toward the sun).
Figures 10 compares a multi-space prove observation with the reproduced HAF simulation on the basis of the observed flare times. Three shock waves are observed by two space probes, HELIOS A, B and the earth. The inference by the observation by Bulraga et al.10 can fairly well be reproduced by the simulation. The agreement between the two suggests that both inferences support each other (one based on the observation and the other simulation support each other).
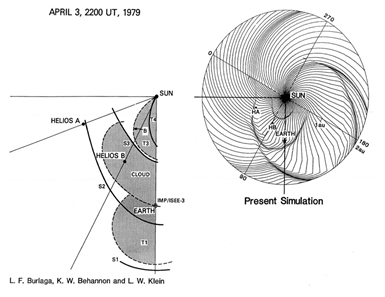
Figure 10 An example of multi-shock wave event during the end of March to the beginning of April of 1979 [Bulraga et al.10] and its simulation result. Three shock waves are reasonably well reproduced. Note that the simulation provided the shock structure in the whole area of 2 au.
This test result shows that we can reproduce reasonably well these complicated events over a wider range in the heliosphere more than limited areas by space probe observations. Thus, such attempts are useful in understanding multi-events (even in complex ones over a much wider region), although it is not possible to add events which occur on the back side of the sun.
The HAF scheme is simple enough to study the propagation of shock waves in a 3-D space. Fortunately, Hewish and Duffett11 observed interplanetary scintillation events of radio stars and projected the scintillation area in a sky map. Figure 11a shows the scheme, and their sky map is shown Figure 11c; the location of the high scintillation is shown by “H”.
Akasofu and Lee12 attempted to reproduce the corresponding shock wave in a 3-D space, and the resulting shock waves were projected on a sky map. Figure 11b shows the results. Comparing Figure 11c with Figure 11b, it can be seen that the simulated expanding shock wave is located where the observed expanding scintillation is high (H). Figure 11d shows the configuration of the shock wave in a 3-D space; actually, after the event by Hewidh and Duffett-Smith11 observed, the sun produced another flare, and its shock wave is also shown.
This study suggests that the radio star scintillation, together with the HAF scheme, may help in inferring the propagation of shock waves (or CMEs) between the sun and the earth. At the present time, without space probe observations, there is no simple way other than the above to infer the propagation of shock waves (and CMEs) between the sun and the earth in order to predict accurately the arrival time at the earth. Innovative methods of tracking the shock waves and CMEs at the earth on a continuous basis are needed in space weather prediction. Although the importance of space weather has been emphasized, continuous observations of space disturbances between the sun and the earth is missing.
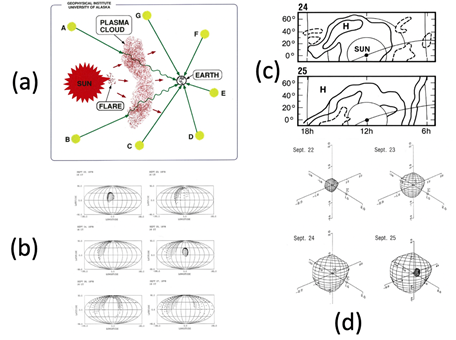
Figure 11 (a) The concept of using the radio star scintillation in predicting the location of shock waves between the sun and the earth. (b) The corresponding 3-D simulation of the scintillation event on a sky map (Hewish and Uuffett,1987 in (c). (d) The simulated shock in 3-D space; date ’September’ should be ‘August’; Akasofu and Lee.12
In predicting the intensity of geomagnetic storms, the magnetic configuration of CMEs in a 3-D space is the most crucial problem in space weather in predicting the intensity of magnetospheric disturbances, including geomagnetic storms, ionospheric disturbances and auroral activities. Without this knowledge, an accurate prediction of the intensity of magnetospheric disturbances is not possible.
This point is clear in Figure 3. Even intense flares around the central distance do not produce intense disturbances; Yoshida and Akasofu.3 This is because we know so little about the magnetic configuration of CMEs or MCs. The situation has not progressed much even today in spite of many observations. In the related studies, it appears that the term the flux rope is most often used, so that it is likely that many of them are attached to the photosphere. Thus, we consider here that they are attached to the photosphere.
In considering the magnetic topology of CMEs/MCs, one possible way is to consider electric currents along the flux rope originated on the photosphere; Chen and Krall.13 The reason for introducing electric currents in studying CMEs/MCs/flux ropes is that there is a phenomenon called “disparition brusques, (DB)”; Svestka.14 The dark filament (current loop) between two-ribbon of the Ha emission is blown away at flare onset.
If an expanding current-carrying flux rope or loop (originated from the exploding dark filament) could be identified as the main CME/MC by future studies, it may eventually be possible to construct a magnetic topology of CMEs in terms of flux ropes rooted on the photosphere.
As an example, Figure 12a shows the expanding shock wave associated with the May 28, 1997 event based on the HAF scheme, Saito et al.15
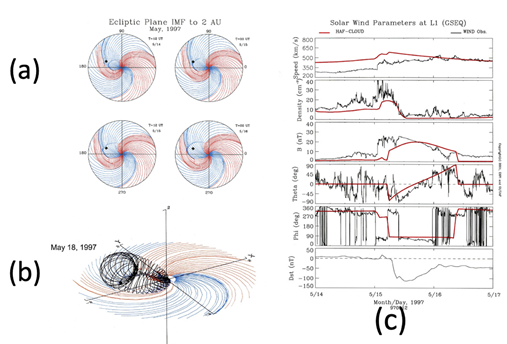
Figure 12 (a) The simulated propagation of shock wave on the May, 1997 event red -IMF outward, blue inward); the location of the earth is indicated by a dot. (b) The magnetic configuration of corresponding CME by assuming the passage of a loop current of 109 A on the basis of observed and simulated results of the solar wind data (black-observation, red-simulation). (c) The comparison of the observed and simulated changes of the solar wind.
The above humble and primitive attempt by trials and errors may be one of the ways to obtain some idea about the pitch of flux ropes and the current intensity of the flux ropes. In fact, if we can determine the current intensity, it may be an important progress in studying the flux ropes and also causes of solar flares. It is hoped that the electric currents along the flux rope is further pursued, in addition to MHD-based simulation studies.
There have been a number of space probes at a distant heliosphere during active periods of the sun. There are several studies on the propagation of CMEs/MCs beyond 10 au; Wang and Richarson (16). Thus, it is worthwhile to know how space probes were located in disturbed heliosphere, specifically in terms of the distribution of shock waves. This requires the propagation of a large number of shock waves prior to the time of observations. As an example, Figure 13 shows the heliospheric disturbances on November 6, 2003, when Ulysses and Cassini were within 10 au. Since it is possible to construct such a map quickly on a day-by-day basis by the HAF method, it may be useful in interpreting their observations by knowing some idea about the passage of the past shock waves at the location of Ulysses and Cassini. This will help interpreting their data in a detail study later by knowing events prior to a particular event. An example is shown in the next section with Pioneer 11. As mentioned earlier, the propagation speed is adjusted by knowing the arrival time of the shock wave at the earth.
In Figure 14a, the interplanetary disturbances are reproduced to a distance of 30 au during the period of June-August,1982, and the results are compared with the Pioneer 11 observations. Figure 14b shows the comparison between the observation and the HAF results. In spite of the simple HAF scheme, the shock observation at Pioneer 11 and the HAF result agree reasonably well. During the same period, the sun was very active and several shock waves were propagating in a wider directions; Akasofu et al.17
This example demonstrates the usefulness of the simple HAF method, encouraging us to extend it to 100 au. This is partly due to the stability of the solar wind and the interplanetary magnetic field in spite of occasional solar disturbances.
The HAF scheme is extended to explore disturbances within a distance of 100 au, which includes about 200 days of events in an early 2004 (Figure 15). Shock waves tend to merge together at great distances as later shock waves with some faster speeds catch up with the older ones, establishing a ‘magnetic’ barrier. This might be useful in explaining the Forbush decrease; the intensity of cosmic rays has a large 11-year cycle decease. In this case, it can be seen after a disturbed period, a quiet condition had resumed as shown by a steady spiral structure in the inner interplanetary space.
It is hoped that much better schemes will be developed on the basis of the concept of the HAF scheme or much more advanced scheme.
In concluding, it is emphasized that we have to improve the knowledge of the magnetic configuration of CMEs in forecasting the intensity of geomagnetic storms and auroral activities. The field of space weather has been established for this particular purpose. Both solar, interplanetary (solar wind) and magnetospheric physicists should work together for this purpose.
The author would like to thank a number of people in developing, testing and applying the HAF scheme for many solar events, particular, K. Hakamada, G. Fryer, M. Dryer, L.-H. Lee, C. S. Deehr, L. F. Burlaga, S. Yoshida and T. Saito. The author claims that there is no conflict of interest in this paper. All the data used here are acknowledged in the quoted papers.
None.

©2023 Syun-Ichi. This is an open access article distributed under the terms of the, which permits unrestricted use, distribution, and build upon your work non-commercially.