eISSN: 2576-4543


Review Article Volume 7 Issue 3
International Arctic Research Center, University of Alaska Fairbanks, Alaska, USA
Correspondence: Syun-Ichi Akasofu, International Arctic Research Center, University of Alaska Fairbanks, Alaska, USA, Tel 907-474-6012, Fax 907-474-5662
Received: August 07, 2023 | Published: August 14, 2023
Citation: Syun-Ichi A. Propagation of solar disturbances and heliospheric storms. Phys Astron Int J. 2023;7(3):175-183. DOI: 10.15406/paij.2023.07.00106
In this paper, we review solar disturbances (solar flares) and their propagation towards the earth and to the heliosphere. For solar flares, we consider that a photospheric dynamo supplies the power and that high speed streams are caused by the basic solar wind (modified by the solar magnetic field), not from coronal holes. These new views allow us to predict the occurrence of solar flares and the 27-day recurrent storms more accurately than in the past. It is suggested that the explosive aspect of solar flares, the phenomenon, called ‘diparition brusques (DB)’, is the source of coronal mass ejections (CMEs)/magnetic clouds (MCs) and of heliospheric disturbances, namely heliospheric storms. It is also suggested that some CMEs have a magnetically helical structure, which are rooted at the sun. For the inner heliospheric storms, a simple method, called the HAF method, is used to study the propagation of solar disturbances and tested by various simultaneous space probes, such as IMP, HELIOS A, and B for the inner heliosphere. For the middle heliosphere, the same method is tested at a distance 7 au with the Pioneer 11 data; the result is satisfactory. The method is further extended to 100 au in an early 2004; thus, it is possible to envisage the whole heliospheric disturbances over 200 days.
Keywords: space, weather, solar flares, magnetosphere, auroral substorms, geomagnetic storms
There has been a great progress in solar physics, interplanetary physics and magnetospheric physics in recent years. However, we are still very far from in understanding solar flares to begin with. In this paper, solar flares are a result of the sequence of photospheric dynamo (power supply), transmission (currents/circuits) and dissipation (solar flares) by Akasofu and Lee.1 This allows us to predict at least the intensity by observing the time variation of the accumulating power/magnetic energy better than before; an example is shown.
Further, it has long been thought that a coronal hole is the source of high speed streams. However, coronal holes are the least active region of the sun. Thus, even they have an open field structure, there is no simple way of generating high speed streams. On the basis of the Ulysses observation, Akasofu and Lee2 found that high speed streams are the basic solar wind pattern. Thus, it is possible to predict high speed streams by observing the magnetic field distribution on the source surface (a concentric spherical surface of three solar radii), since the magnetic field pattern modifies the wind pattern.
The magnetic configuration of CMEs/MCs is most crucial in predicting the intensity of magnetospheric disturbances. There have been many theoretical and observational studies, but their structure is still under controversies. In this paper, it is assumed that some CMEs/MCs have a magnetic loop structure rooted at the photosphere, and that electric currents of 1012 A flows along the loop. It is shown that the pitch of a helical magnetic structure and geomagnetic disturbances (Dst) can be reproduced. For the propagation of solar disturbances to the heliosphere, we devised a simple method, called the HAF method. The method is tested within a distance of a few au and 10 au. Since results are reasonably satisfactory, the HAF method was extended to 100 au, covering about 200 days.
We consider that solar flares are a result of the sequence of dynamo (power supply), transmission (currents/circuit) and dissipation (solar flares), since solar flare a manifestation of electromagnetic phenomenon. The power of solar flares is supplied by a photospheric dynamo. The basic model of the dynamo for solar flares is a magnetic arcade-mode dynamo.1 Plasma flows along the neutral line under a magnetic arcade are about 1.5 km/s; (Figure 1). Spotless flares have the basic feature of solar flares and our dynamo theory can supply the power, so that magnetic reconnection is not needed.

Figure 1 Photospheric dynamo process under a magnetic arcade along the neutral line. (b) The generated field aligned currents along the magnetic field lines of the arcade, which can produce the Ha emission at the feet of a magnetic arcade, namely two-ribbon flare. (c) Spotless flare (Svestka.3)
One of the important reasons to consider a photospheric dynamo is that field-aligned currents with the double layer are needed to ionize chromospheric hydrogen atoms. The dynamo configuration in Figure 1 can produce field-aligned currents, so that the basic flare phenomenon, such as two-ribbon flares, can be reproduced without sunspots or preexisting magnetic energy. It is unfortunate that photospheric dynamo theories had been abandoned a long time ago since or earlier than 1958.
The power of a dynamo is defined by the Poynting flux P (erg/s or w) is given by:
P = ∫ (E × B)·dS = BzBy(A)/4p
where A (the area of typical two-ribbon of the emission) A = 2 x 2 x105 km x 2.5 x 104 km = 1016 m2; and ByBz = (15 G)2 and photospheric plasma speed V = 1.5 km/s, With these paramers, the power P is 2.0 x 1026 erg/s. Thus, the photosppheric dynamo can supply the power for two-ribbon flares without magnetic reconnection. It may be noted that it is essential to have field-aligned currents with the double layer (Alfven4) to produce energetic electrons of 10-100 keV in order for them to penetrate into the chromosphere; even if magnetic reconnection can produce a high speed flow of plasma, it is doubtful that it can produce two-ribbon flares.
In addition to the magnetic field-aligned currents along the magnetic arcade, the dynamo process in the magnetic arcade model produces a loop current along the two-ribbon emission. It flows along the dark filament between the two ribbons, but above them (Akasofu and Lee1). The importance of the photospheric dynamo is that it can also generate this loop current (Figure 2).

Figure 2 (a) The dark filament current between two ribbons, but above them. (b) A typical dark filament current above the two ribbons (Alfven, 1950). (c) An example of dark filaments. Note that a weak flare is in progress (The Norikura Solar Observatory, E. Hiei).
Thus, the exploding loop current along the dark filament is generated by our photospheric dynamo. The loop current can have enough accumulated magnetic energy produced by the dynamo (as shown below) and that the disappearance of the dark filament occurs at about the time when the two-ribbon emission is greatly enhanced. This phenomenon described in detail by Svestka3 (p.229) as ”disparitions brusques, (DB). It is known that the dark filament is located between the two-ribbons, but above it; it is also known that electric current flow along the filament, evidenced by its helical structure (Figure 3).
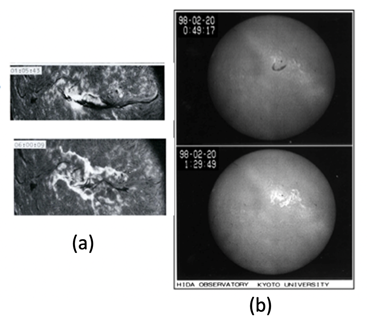
Figure 3 (a) Upper: The dark filament prior to flare onset. Lower: Soon after flare onset. (b) Upper: an image just before flare onset; note the dark filament. Lower: the maximum epoch of a two-ribbon flare; note that the dark filament was blown away (The Norikura Solar Observatory, E.Hiei). This is a typical example of disparition brusques
DBs are likely to be caused by a current instability in the loop current such as the kink instability. The disappeared filament on the solar disk reappears as a bright prominence beyond the disk. It is known that the exploding prominence of a helical structure shows an unwinding feature, indicating reduction of the current and thus reduction of the loop energy. The loop current has magnetic energy of W = (1/2) I2L, where I and L denote the current intensity and inductance, respectively. For a typical vale I = 1011 A (Chen and Krall6) and L = 2000H (Alfven1,5), W= 1032 erg, so that the loop current along the dark filament can have enough energy for flares.
Therefore, the magnetic arcade dynamo model can generate both the field-aligned currents along the arcade magnetic field lines (producing a two-ribbon flare) and a loop current along the dark filament. Thus, the photospheric dynamo can accumulate a significant part of flare energy in the dark filament for the explosive feature as well. It is unfortunate that DBs have been forgotten for a long time.
(b) Flare prediction
The importance of the photospheric dynamo theory is that a semi-quantitative method of predicting the occurrence and intensity may eventually become possible; many of the needed factors can be measured or inferred (or will become available in future).
In the following, we attempt to estimate the power and the accumulated energy prior to an observed flare onset based on the work by Wang et al.7 Figure 4 shows the data set. They observed an increase of the shear angle of the photospheric magnetic field from 40° to 45° in a rectangular area of 6.5 x 10⁸ km2 (50° x 25° = 3.6 x 104 km x 1.8 x 104 km) for about 5 hours before flare onset. From the magnetic shear observation, it is possible to infer the speed V of the photospheric plasma. In this case, the speed is estimated to be 1.3 km/s. This speed is similar to the flow speed, 1.5 km/s. The magnetic field intensity is about 100 G and the width of the arcade 1.8 x 10⁴ km (the distance of two flare ribbons). Thus, the estimated power P is 2.8 x 10¹⁹ J (1026 erg/s).

Figure 4 (a) An example of developing magnetic stress, indicating accumulation of magnetic energy. (b) Time development of the stress. Flare onset is indicated by red arrow, (Wang et al.7)
The power accumulation period was about 5 hours, so that the accumulated energy is estimated to be 1,2 x 1025 J (1.2 x 1032 erg), for an intense flare as observed; Akasofu and Lee.1 Thus, if one can infer the power and the accumulation period, it may become possible to predict the released energy just at the time of flare onset; say, 1023 J for a weak flare, 1024 J a medium intensity flare and 1025 an intense flare. The occurrence can be inferred semi-quantitatively by locating regions, where magnetic stress is the region where the magnetic stress is accumulating. Thus, at the time of flare onset, it is possible to infer its intensity. BY being to observe the accumulation, it may also be possible to infer semi-quantitatively the occurrence as well. There have been many qualitative efforts in predicting flares in active regions. It is possible to make the prediction a little more quantitative in knowing the power of dynamo as a function of time. Most of the factors here could be simultaneously measured, if necessary by a few observatories together.
(a) Basic flow pattern of the solar wind
In the first part of this section, we show that the high speed streams (800 km/s) are not from coronal holes, but is the basic flow pattern of the solar wind. In a study of the solar wind, there is an important observation of the solar wind speed near the sun by the Ulysses pace prove; Figure 5. Fortunately, this observation was made when the sun was extremely quiet (when the ecliptic equator coincides with the magnetic equator). Its simplicity suggests that it must be indicating the feature of the basic driving process. The uniform part of the flow is called the UF flow (uniform flow) here.; for details, see Akasofu and Lee.2
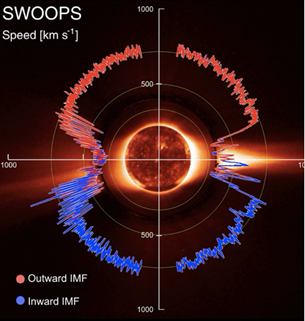
Figure 5 The Ulysses observation of the solar wind speed as a function of latitude during the lowest solar activity period. In low latitudes, the wind distribution has a ‘gap’, where the equatorial streamer is present (McComas et al).8
In Figure 6, this wind distribution can be shown in a graphic form on the source surface (a spherical surface of three solar radii), called the Carrington map (latitude-longitude, 360° = 27 days [the solar rotation period seen from the earth]); the solar magnetic equator coincides with the ecliptic equator. The earth’s location (with the seasonal change of ± 7°). The earth scans it from left to right in 27 days as the sun rotates; in this case, the earth is confined within the speed region of 400 km/s.
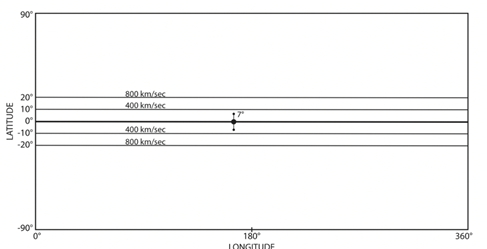
Figure 6 A graphic representation of the above observation in the Carrington map. The earth’ location is projected with its seasonal change of ± 7°.
However, the solar wind speed varies considerably from 350 km/s to 800 km/s. In order to understand why the earth encounters such a great variety of the solar wind speed, it is necessary of learn about the magnetic equator of the sun. Saito et al.9 projected the magnetic equator on the source surface during the whole sunspot cycle 21, which was determined by the Wilcox Solar Observatory (WSO). The magnetic equator deviates greatly from the ecliptic equator during most of the cycle period. The equivalent dipole axis (based on the magnetic equator) rotates by 180° during the cycle; it is known that the magnetic polarity changes every 11 years, the solar cycle; Figure 7. In Figure 7 (right), the magnetic equator for CR 1720 in 1982 (Figure 7 (left) is compared with a simple sinusoidal case. For details, of the sinusoidal structure, see Akasofu et al.10
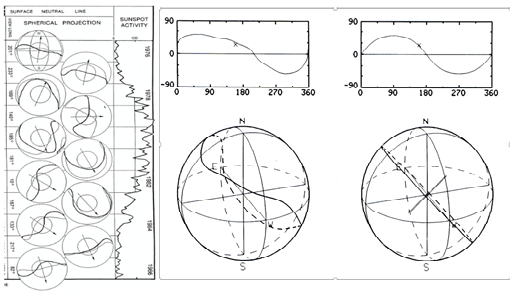
Figure 7 (Left) The solar cycle variation of the magnetic equator on the source surface (the solar cycle 21), based on the neutral line on the photosphere (WSO), together with the sunspot number (Saito et al.10) (Right) The magnetic equator CR 1720 in 1982 (left figure rotated for the purpose of presentation) comparted with a simple sinusoidal case.
In spite of its complexity, it can be seen that the magnetic equator can be represented approximately by a sinusoidal curve on the source surface (and the corresponding warped plane), particularly after the peak of sunspot cycle (Akasofu and Lee2). Hakamada and Akasofu11 and Akasofu and Fry12 developed a simple simulation method, called the HAF scheme. The basic concept of the HAF scheme is briefly given here.
In Figure 8 (upper), a sinusoidal speed pattern is shown; the highest speed is 750 km/s. As the sun rotates, a fixed point in space (not fixed on the sun near the photospheric surface observes two half-sinusoidal variations of the speed as a function of time during one rotation of the sun (Figure 8, lower); if necessary (or the observations are available), the amplitude of the pattern can be changed, depending on solar conditions during the sunspot cycle by knowing the magnetic equator on the source surface (a spherical surface of 3 solar radii); the magnetic equator tends to deviate from the ecliptic equator as shown in Figure 7 during the solar cycle. Thus, the sun sends out two half-sinusoidal waves into the heliosphere per each rotation as Figure 8 (lower) shows.

Figure 8 Upper: The speed distribution of the solar wind on the photosphere. Note that the magnetic equator (the speed is 300 km/s) is inclined from the ecliptic equatorial plane. Lower: The speed variation during one rotation of the sun at a fixed point near the photospheric surface, but not fixed on the sun.
Based on Figure 8 (upper), the earth observes two long periods of the UF flow (one flow is from the northern hemisphere and the other from the southern hemisphere (this is checked by the IMF azimuth polarity) and two very slow speed between them (350 km/s). The IMF pattern based on a similar sinusoidal pattern is shown below; it shows two co-rotating structures.
It is this UF flows which we had considered in the past as the high speed streams from the coronal holes.
As the two half-sinusoidal waves propagate outward, the speed of each wave as a function of distance from the sun can be simulated by an ordinary MHD simulation (cf. Dryer13), as shown in Figure 9; a distinct shock wave structure is formed at a distance of about 7 au in this case.
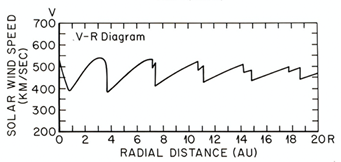
Figure 9 The resulting speed distribution of one of the half-sine wave as a function of distance from the sun. Note that a distinct shock is formed at about 7 au.
As a test, the pattern of the interplanetary magnetic field (IMF) within 2 au for the above initial conditions is shown in Figure 10. It shows Parker spiral structure and two co-rotating structures.
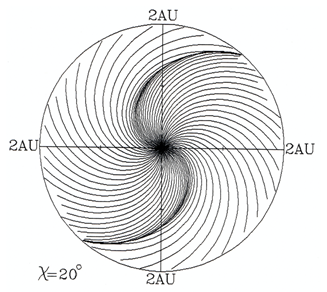
Figure 10 The interplanetary magnetic field line configuration (Hakamada and Akasofu11).
Figure 11 (left) shows the computed solar wind variations (IMF magnitude, angles) at the distance of the earth during the period of one solar rotation for the above conditions; Figure 11 (right) shows the corresponding observed 27-day variations; the agreement is reasonable. Both show two high speed flows. It has been thought that these flows are high speed streams from coronal holes. Figure 11 shows also that the HAF scheme works reasonably well up to 1 au.
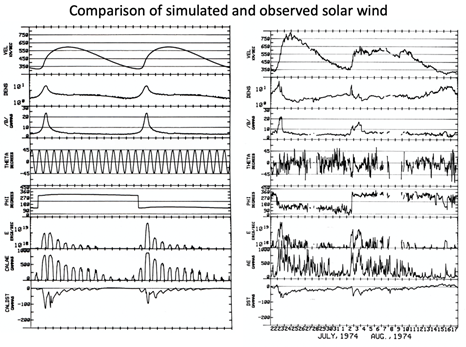
Figure 11 Left: The resulting solar wind speed, density and the IMF B during 27 days. The angle with respect the heliomagnetic equator is assumed to be sinusoidal variations. For the simulated AE/Dst, see the text. Right: An example of the corresponding observed 27-day variations.
The IMF angle changes with respect to the magnetic equator of the earth are represented by sine waves, and the resulting magnetic disturbances (AE/Dst) are produced from the estimated Bz and the empirical relationship between IMF Bz and AE/Dst indices. The observed solar wind change and two geomagnetic storms during one Carrington rotation period (27 days) are reasonably well reproduced by the HAF method. The similarity of the computed and observed AE/Dst suggests that it is possible to predict the development and intensity of geomagnetic storms caused by high speed streams may be possible.
Thus, the variety of the speed observed during sunspot cycles can partly be explained by the quasi-sinusoidal solar wind distribution, together with its variations of the amplitude of the sinusoidal variation; in more disturbed situations, the sinusoidal curves may deform from the simple curve (Akasofu and Lee2). Therefore, it may not be necessary to consider different causes and locations for different wind speed source such as coronal holes, although it has long been considered that a high speed wind blows out from coronal holes, which has no sign of solar activity, even if they have ‘open’ field configuration.
Although there are many MHD simulation studies of the propagation studies of the propagation studies, we show that the HAF method is useful. This is particularly useful, when the sun is very active and produce many flares; MHD methods may be difficult to handle well such complicated cases. A solar flare is represented by adding a circular speed distribution at the reported location of flares (longitude, latitude in the Carrington map in Figure 8 (Upper), as shown in Figure 12a. Then, the simulation is made by taking into account of the relative location of the earth with respect to the central meridian distance at the time of flare as the sun rotates. The intensity of flares can be adjusted in terms of the radius of the circle and the speed at the center of the circle. Time variations of the flare intensity can be included by following the intensity variation of the Ha emission. A sequence of flares, if they occur, can be added in the same way as mentioned on the same day, next day or after weeks or months later.
Figure 12b shows an example of the simulated multi-events. The HAF scheme is simple enough to adjust those parameters (the initial speed, time variation) until the arrival time agree with the observation. The results thus obtained are reasonably accurate and thus useful the propagation of the shock waves between the sun and the earth. The red lines indicate the IMF is directed away (positive) from the sun, and the blue lines indicate the IMF is directed toward (negative) the sun.
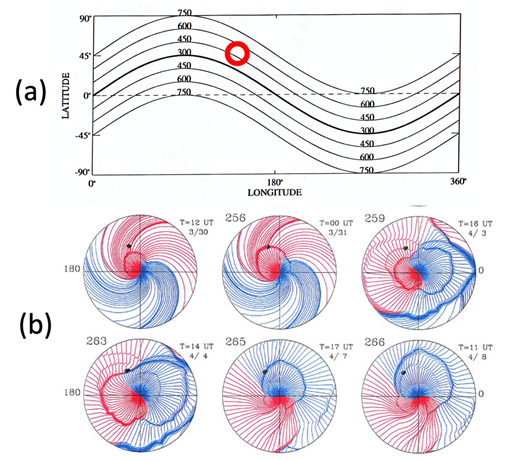
Figure 12 Simulation of a flare. Upper: The reported location of the flare is shown as a circle as an example. The intensity of flare is given in terms of the size of the circle and the speed at its center. The simulation is made by taking into account the relative location of the flare and the earth. Lower: An example of simulation in the case of multiple flares. The red lines indicate positive (away from the sun), and blue negative (toward the sun).
In any forecasting scheme (including MHD simulations) without an accurate set of initial conditions on the sun, it is not possible to forecasting accurately the arrival time of the shock waves; it is known that the speed of CMEs has a wide range. Figures 13 and 3.8 compare two multi-events and multi-space prove observations with the corresponding HAF simulations on the basis of the observed flare times.
In Figure 13, three shock waves are observed by two space probes, HELIOS A, B and the earth. The inferred shocks by the observation (Bulraga et al.14) can fairly well be reproduced by the simulation. The agreement suggests that both inferred and simulated results support each other.
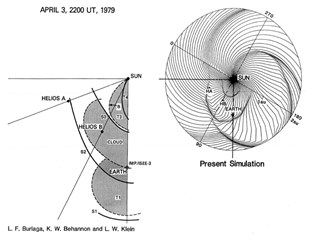
Figure 13 An example of multi-shock wave event during the end of March to the beginning of April of 1979 (Bulraga et al.14) and its simulation result. Three shock waves are reasonably well reproduced. Note that the simulation provided the shock structure in the whole area of 2 au.
In Figure 18, three shock waves were observed by HELIOS 1, 2 space probes and the earth (IMP satellite). The agreement of both results is reasonable, again supporting the inferred situation of multiple shocks by the observations and the simulation; note that the IMP location is the earth’s location. However, “the piston” (CME) cannot be simulated in this case.

Figure 3.8 Another example of multi-shock event and its simulation. Note that the location of IMP is t18location of the earth.
These test results show that we can reproduce reasonably well these complicated events over a wider range in the heliosphere more than limited areas by space probe observations by the simple HAF scheme. Thus, such attempts are useful in understanding multi-events even in complex ones over a much wider region, although it is not possible to add events which occur on the back side of the sun.
The intensity of geomagnetic storms depends greatly on the central meridian distance of the flare location. This is often forgotten in forecasting the intensity. Figure 13 shows the relationship between the location of solar flares with respect the central meridian of the sun and the intensity of resulting geomagnetic storms. For this purpose, we used the intensity of geomagnetic storms measured by the magnitude of the main phase decrease DR (recorded at the Honolulu observatory [published yearly by the USGS in 1950-1970] and solar flare data [published monthly by the NOAA/Boulder, Colorado in the 1950-1970]); this old study was made before the magnetic indices AE and Dst were well developed, but the general trend is expected to be similar with Dst.
Figure 13 shows two crucial factors. The first well-known factor is that the intensity of magnetospheric disturbances depends strongly on the location of solar flares with respect the central distance. The second factor is also the well-known fact that intense flares in any place on the sun (circle with dot caused solar cosmic ray events and the Polar cap absorption [PCA]) do not necessary produce intense magnetospheric disturbances (DR), including the fact that intense flares in the central meridian do not necessarily produce intense magnetospheric disturbances. As we show in the following, this is mainly because the intensity of produced disturbances depends greatly on the power generated by the solar wind-magnetosphere interaction or the north-south component of the interplanetary magnetic field (IMF Bz component).

Figure 13 The geomagnetic storm index (DR), which the main phase decrease observed at Honolulu. It shows the dependence of DR on the central meridian distance of solar flares (Yoshida and Akasofu15).
Although these factors are generally known, but are often forgotten in forecasting even today; intense geomagnetic storms and auroral activities are often predicted after intense flares.
The ejected solar gas by solar flare activities is called coronal mass ejection (CME) or magnetic cloud (MC). This study was initialed by Burlaga et al.14 and Marubashi.16,17 However, their topology (both geometric and magnetic and also attached to or detached from the sun) is not yet very clear, in spite of a large number of theoretical and observational papers:
(1) Their origin (Chen and Krall;6 Lugas and Roussev18[modeling & obs]; Xu et al.19 [obs]; Webb et al.,20 [obs.];
Zhang et al.21),
(2) The axis (Lepping et al.;22 Lepping et al.;23 Janvier et al.24,25),
(3) The orientation (Zhang et al.21 [obs.]),
(4) The cross-section and its shape (Hidalgo et al.,26 Janvier et al.24,25
(5) Cylindrical or twisted models (Nishimura et al.,27 Al-Haddad et al.,28, [modeling])
(6) Their evolution during their transit (Davies et al.;29 Nackwacki et al.,30 Isavnin et al.31).
(7) Modeling (Vandas et al.,32,33 Wu et al.34-37).
(8) Flux lopes (Howard;38 Owens39).
It has been considered by some researchers that some of CMEs/MCs are rooted on the photosphere. An important point here is that in such cases, electric currents are expected to flow along its expanding magnetic loops from the sun, because they are likely to be an expansion of disparition brusques (DBs), as discussed in the above. However, electric currents in CMEs/MCs have hardly discussed in the past. Saito et al.40 attempted to construct the spiral magnetic field structure of CMEs/MCs by assuming that an expanding current loop from the sun has electric currents of 109 A at the distance of the earth (initially, perhaps 1012 A); they tried to determine the helical structure by trials and errors in such a way that the helical structure thus constructed agrees with the IMF changes during its passage; it was a very humble effort as shown in Figure 14.
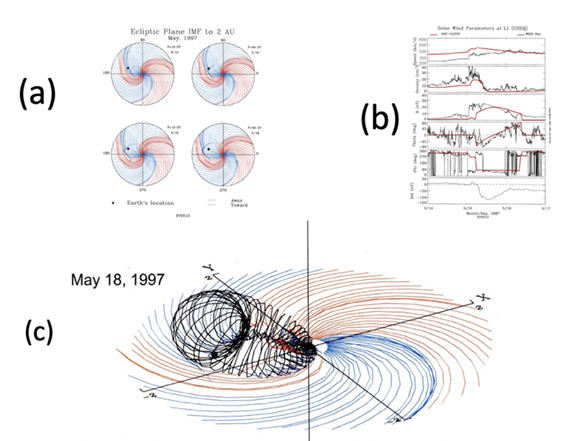
Figure 14 (a) The simulated propagation of shock wave on the May, 1997 event (red -IMF outward, blue inward); the location of the earth is indicated by a dot. (b) The comparison of the observed (black) and simulated (red) changes of the solar wind; the location of the earth is indicated by a dot. (c) An example of helical structure which agrees with the observed (black) magnetic changes in (b).
It is hoped that it will become possible to predict such a helical structure of CMEs/MC in the future. It is such a helical magnetic structure, which determines the intensity of geomagnetic storms and the auroral activity, in particular the helical magnetic field and its southward Bz component. The success of space weather forecasting depends on forecasting the magnetic topology of CMEs/MCs.
Figure 15 shows another example. These very humble attempts by trials and errors may be one of the ways to obtain some idea about the pitch of flux ropes and the current intensity of the flux ropes. In fact, if we can determine the current intensity, it may be an important progress in studying the flux ropes and also causes of solar flares. It is hoped that the electric currents along the flux rope is further pursued, in addition to MHD-based simulation studies.
(a) Heliospheric magnetic configuration
First of all, it is important to know the magnetic configuration of the heliosphere (Parker’s spiral) during a quiet time. Figure 16 show the IMF spiral pattern to a distance of 20 au.
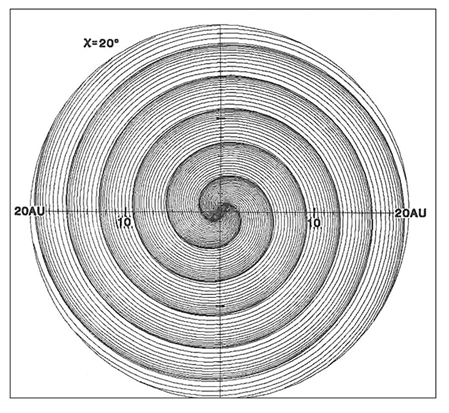
Figure 16 Parker’s spiral feature within a distance of 20 au; Hakamada and Akasofu11.
The heliospheric magnetic configuration has often been described by extending the concept of the magnetosphere, in which the heliosphere is moving in interstellar space. However, the magnetic configuration within the heliosphere has not been well discussed much. In this Chapter, taking the electric current approach, we examine the 3-D magnetic configuration of the heliosphere. For this purpose, we consider the solar unipolar inductor (Alfven4,5 ). Its 3-D magnetic field configurations are calculated under various conditions, including the interstellar magnetic field of 0.01 nT. Figure 17 shows some examples; the spiral magnetic field lines are projected on the equatorial plane.
Its 3-D magnetic field configurations are calculated under various conditions, including the interstellar magnetic field of 0.01 nT. Figure 17 shows some examples; the spiral magnetic field lines are projected on the equatorial plane.
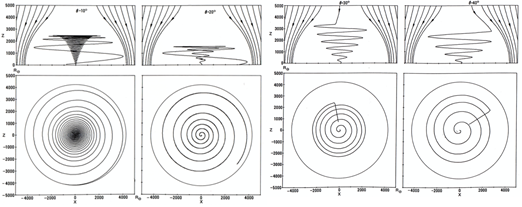
Figure 17 Heliospheric magnetic field configuration in interstellar space. The latitude of the computed field lines is from the left, the polar angle 10°, 20°, 30°and 40°. The field lines are projected on the equatorial plane. Left: part; heliospheric field lines are not linked with interstellar field lines. Right: part; heliospheric field lines are linked with inter stellar field lines (Akasofu and Covey41).
(b) Heliospheric disturbances to a distance of 10 -30au
We have already described the propagation of shock waves to a distance of 2 au. There are many studies of CMEs/MCs and/flux ropes beyond 10 au, as we discussed in Section 5. Here, we show our simulation of shock waves up to 10 au, when both Ulysses and Cassini were operating; Figure 18.
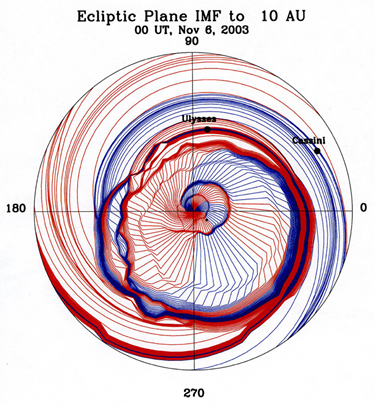
Figure 18 Several propagating interplanetary shock waves up to 10au. when Ulysses and Cassini were operating.
In Figure 19a, interplanetary disturbances are simulated to a distance of 30 au, and the results are compared with the Pioneer 10 and 11 observations. Figure 19b shows the comparison between the observation and a simulation result. In spite of the simple HAF scheme, the observation of speed at Pioneer 11 and the simulated result agrees reasonably well. During the same period, the sun was very active and several shock waves were propagating in all directions.

Figure 19 (a) Simulation of interplanetary disturbances to a distance of 30 au; the location of Pioneer 10 and 11 is indicated. (b) Comparison of the observed and simulated disturbances at the location of Pioneer 11 (Akasofu et al.42).
(c) Heliospheric disturbances to 100 au
The HAF scheme is extended to examine disturbances within a distance of 100 au, which includes about 200 days of events in an early 2004. Figure 20 shows the results, which superposed all the events during about 200 days prior to February 16, 2004. Shock waves tend to merge together at great distances, as later shock waves with faster speeds catch up with the earlier ones, forming a ‘magnetic’ barrier’.
In Figure 20, it can also be seen that after the disturbed period, a quiet condition had resumed as shown by a steady spiral structure in the inner interplanetary space.
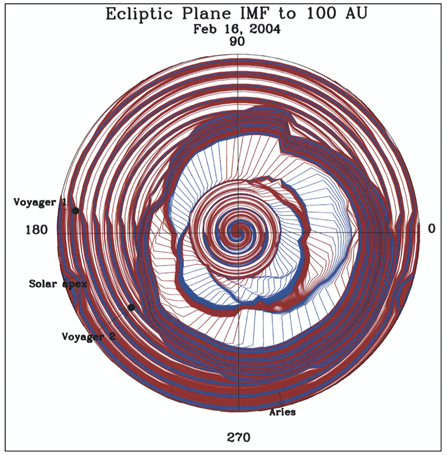
Figure 20 Simulation of heliospheric disturbances on February 16 in 2004 up to 100 au; all the event prior that date are superposed.
It is hoped the HAF or more improved simulations will be used for future deep space prove observations, because the method is simple enough to infer heliospheric conditions in studying the data on a daily basis as demonstrated in Figure 20.
The produced barrier may prevent the entry of cosmic-rays to penetrate into the inner part of the heliosphere and might be useful in explaining the 11-year variation of the intensity of cosmic-rays. The intensity of cosmic-rays decreases during geomagnetic storms. It is called Forbush decrease. This occurs when the magnetosphere is inside CMEs/MCs/flux ropes; it is likely that magnetic fields of CMEs prevent cosmic-rays to enter into CMEs.
In this paper, we examined several issues on apace weather prediction/forecasting.
(1) Solar flares: It may be possible to predict/forecast the intensity (perhaps, also the occurrence) of solar flares on the basis of a photosspheric dynamo theory.
(2) High speed streams: They are not originated from coronal holes, but are likely to be the basic solar wind. It may be possible to predict/forecast the occurrence of highspeed streams on the basis of the magnetic equator on the source surface.
(3) CMEs/MCs: It is likely that some CMEs/MCs are associated with a loop currents rooted in the photosphere, and thus, they have a helical magnetic field.
(4) The HAF method is used to study the propagation of solar disturbances to distances of 2, 10, 30 and 100 au.
The author would like to thank a number of people in developing, testing and applying the HAF scheme for many solar events, particular, K. Hakamada, G. Fryer, M. Dryer, L.-H. Lee, C. S. Deehr, L. F. Burlaga, S. Yoshida and T. Saito.
The author claims that there is no conflict of interest in this paper. All the data used here are acknowledged in the quoted papers.
None.

©2023 Syun-Ichi. This is an open access article distributed under the terms of the, which permits unrestricted use, distribution, and build upon your work non-commercially.