eISSN: 2576-4543


Research Article Volume 1 Issue 1
1Department of Science Technology, Federal Polytechnic, Ado-Ekiti, Nigeria
2Department of Physics and Engineering Physics, Obafemi Awolowo University, Ile-Ife, Nigeria
3Department of Electronic and Electrical Engineering, Obafemi Awolowo University, Ile-Ife, Nigeria
Correspondence: Lilian Olatunbosun, Department of Science Technology, Federal Polytechnic, Ado-Ekiti, Nigeria, Tel 2348037772119
Received: July 11, 2017 | Published: August 16, 2017
Citation: Olatunbosun LG, Ariyibi EA, Olabode AO, et al. Investigation of scintillation occurrence during intense Geomagnetic storms at low latitude stations. Phys Astron Int J. 2017;1(1):32-37. DOI: 10.15406/paij.2017.01.00005
GPS-derived scintillation index from three low latitude stations located at the Equatorial Ionisation Anomaly (EIA) region has been analysed with a view to knowing the contribution of geomagnetic storms on scintillation occurrence. Results showed that scintillation at low latitude stations was dependent on location, the phase of the storm and time of occurrence of storm. Addis Ababa recorded moderate values of , ranging from 0.42 to 0.45 during the storm events considered. Ile-Ife recorded both low and moderate values of , ranging from 0.2 to 0.42, while Bangalore station recorded the least scintillation occurrence, with values ranging from 0.1 to 0.3. Results also revealed that scintillation occurrence during storms can be inhibited or triggered depending on the phase of the storm. Comparative result between scintillation occurrence during storm and that during quiet time showed that scintillation was more pronounced during quiet periods over all stations.
Keywords: ionospheric scintillation, equatorial ionisation anomaly, global positioning system and low latitude
The Earth’s ionosphere can cause serious challenges to radio wave propagation due to its variations and refractive properties. This has called for a very active research, especially in regions located within the equatorial ionisation anomaly (EIA). The low latitude ionosphere is prone to serious disturbances, especially during geomagnetically disturbed conditions.1 As the radio waves transverse the disturbed ionosphere, the received signals experience rapid fluctuation in amplitude and phase.2 These fluctuations are collectively known as ionospheric scintillation. This is a major problem that affects many satellite communication systems, particularly GPS receiver because of the transmitting frequency. When the fluctuations are intense, it can cause GPS receivers to stop tracking the signals from GPS satellite, leading to navigation errors and in some cases, cause navigation failure.
The irregularities producing scintillations are predominantly in the F-layer. The Earth’s magnetic field has a major influence on the occurrence of scintillation. The equatorial anomaly (region located approximately 15o N and S of magnetic equator)3 experience the most significant activity, including deep signal fades that can cause GNSS receiver to briefly lose track of one or more satellite signals. This effect at equatorial anomaly region is as a result of the combination of electric and magnetic fields, which cause free electrons to be lifted vertically and then diffuses northward and southward. This action reduces the ionisation directly over the magnetic equator and increases the ionisation over the anomaly regions. The maximum occurrence of ionospheric scintillation is at night.4 In low latitudes, amplitude scintillations and long term fades are a dominant issue, while large phase variations are more in the auroral and polar cap region.5 values less than 0.3 indicate weak scintillation and as approaches 0 scintillation becomes non-existent and does not affect the signal. Although there is no upper limit for the coefficient, values between 0.3 and 0.6 indicate moderate scintillation, and values greater than 0.6 are indicative of strong scintillation and are likely to affect GPS signals. Investigation of ionospheric response in terms of TEC and S4 at Ile-Ife low latitude stations has been made.6 They revealed that the occurrence of scintillations at Ile-Ife station was closely linked to the peak value of TEC during the daytime.
The data obtained from dual frequency SCINDA NovAtel GSV 4004B GPS receivers installed at Obafemi Awolowo University, Ile-Ife (7.52oN, 4.28oE), Addis Ababa University, Addis Ababa (9.04oN, 38.77oE) and Indian Institute of Science, Bangalore (13.03oN, 77.57oE) were processed using GPS-TEC application analysis software. The application plots vertical TEC on the screen and writes ASCII output files, such as CMN and STD files. The CMN file writes the calculated TEC ascii file, while the STD file writes the diurnal average TEC asscii file in the destination directory. The CMN file contains records of vertical and slant TECs and for different pseudo random numbers (PRNs). The values of recorded as -99.00, signified ‘no record’ and were treated such during the analysis. This observation was predominant at Addis Ababa and Bangalore stations. The data for Addis Ababa and Bangalore are about 0.008 minute resolution, while that at Ile-Ife was about 0.02 minute. The geomagnetic dipole coordinates for 2012 showed the stations geomagnetic latitude and longitude as: Ile-Ife (10.14oN; 73.90oE), Addis Ababa (11.69oN; 74.75oE) and Bangalore (15.48oN; 76.08oE). The geomagnetic indices of Dst and Kp sourced from World Data Center (WDC), for geomagnetism was used to identify and classify storm events. Also obtained were solar wind parameters of IMF-Bz and Vp from OMNI website (omniweb.gsfc.nasa.gov/vitmo/iri_vitmo.html). This was used to ascertain the condition of the ionosphere during the study periods. The GPS signal at the receiver is expressed as;7
(1)
Where is the nominal received signal and is the scintillation signal with amplitude and phase . The strength of the amplitude scintillations is quantified by scintillation index . It is the ratio of the standard deviation of the signal power to the mean signal power computed over a period of time. It is given by:
(2)
Where is the signal intensity and the brackets indicate ensemble averaging, which can be approximated by the time averages of (I). The refractive component of the GPS signal phase deviation produced during transit of the ionosphere is
(3)
Where is the TEC, q is the charge of the electron, is the mass of the electron, is the permittivity of free space, c is the speed of light and f is the system operating frequency. The index for tabulating phase variation measurements is called the sigma-phi , which is the standard deviation of the scintillation phase variations. However, the GPS-TEC application software used for processing gave only the index values.
The Figure 1 shows the approximate locations of the three stations used for the study in the world map.
The study considered different intense storms that occurred in 2011 and 2012 in the three low latitude stations situated at the equatorial ionisation anomaly (EIA) zone. Comparative results of the occurrence of ionospheric irregularities and the roles of storm events on the formation of such irregularities in the three stations were presented. The effects of such ionospheric irregularities on GPS receivers in the three stations were also investigated.
Magnetic storm conditions on 6 August, 2011
Figure 2 describes the ionospheric conditions during the storm period of 4–8 August, 2011. The duration was to ascertain the condition of the ionosphere before and after the storm event that occurred on 6 August. The plot consists of four panels of Dst, Kp, IMF-Bz and Vp. The Dst identified the storm event, which was preceded by storm sudden commencement (SSC) at about 19:00 UT on 5 August. The main phase of the storm lasted for about 7 hours and ended with minimum Dst value of -115 nT at 03:00 UT on 6 August. The Kp index measured the severity of the storm event, with maximum Kp value of 8 during the main phase of the storm. The IMF-Bz turned southward at the commencement of the storm, attaining minimum value of about-19 nT. Also, during the main phase of the storm, the IMF-Bz also turned northward. This implies that both under- and over- shielding conditions took place during the main phase of the storm.8 The Vp plot indicated an abrupt increase in plasma speed from about 400 km/s to about 600 km/s at the commencement of the storm. During the under-shielding condition, there was sudden generation of region 1 current, which could not be shielded by region 2 current.10 This lead to the prompt penetration of interplanetary electric fields to the low latitudes.11 During the over-shielding condition, the existing region 2 currents penetrate the low latitudes and equator.12–15 In the plot, Dst was positive before the SSC, implying compression in the field, which was an indication that the factors generating the positive phase have a bearing on southward turning of the IMF-Bz.
Magnetic storm conditions on 9 March, 2012
Different storm events occurred during the period of 7 – 11 March 2012 as shown in Figure 3. The first and second was on 7 March, with minimum Dst values of about -75 and -72 nT respectively. The storm however recovered fully before the commencement of the third storm event on 9 March. It started with SSC at about 02:00 UT on 9 March and attained minimum Dst value of about -131 nT. The maximum Kp value was 8, registered during the main phase of the storm. The IMF-Bz showed southward turning during the storm days, with the highest value of about –16 nT registered during the main phase of the storm on 9 March. The plasma speed remained high from about 12:00 UT on 8 March to about 12:00 UT on 9 March, with maximum value of about 740 km/s. From the Figure 3, the Kp also started rising before the southward turning of IMF-Bz, it remained high even when the IMF-Bz changed direction and it decayed more slowly than it rose. This is evidence that Kp index is correlated with southward turning of the IMF-Bz to a large extent.16 The prompt penetration of electric field operated on the time scales of about 6 hours during the storm event on 9 March. Regarding the categorization of the geomagnetic storm based on minimum Dst index values, the storms on 7 March was a moderate storm, while the storm event on 9 March was an intense storm.17
Magnetic storm conditions on 1 October, 2012
Figure 4 showed that the storm event on 1 October was preceded by SSC at about 22:00 UT on 29 September. It attained minimum Dst value of about -119 nT at about 05:00 UT on 1 October. The Kp index attained maximum value of 7 at 00:00 UT on 1 October. The IMF-Bz turned southward even before the commencement of the storm and attained minimum value of about -18 nT and thereafter turned northward during the main phase of the storm. The Vp jumped abruptly from about 320 km/s at about 21:00 UT on 30 September to about 410 km/s on 1 October. The Figure 4 showed that the storm on 1 October recovered more slowly than it rose.
Scintillation occurrence and its impact on GNSS
To ascertain to which extent geomagnetic storm contributes to the occurrence of scintillation, storm events were compared with quiet periods in the three stations.
Scintillation occurrence during 6 August, 2011 storm event and 19 August, 2011 quiet period
Figure 5 represents the scintillation index variation with time of the day during the storm event on 6 August 2011 and quiet period of 19 August 2011 for given PRN. In Ile-Ife station, the scintillation index ranged from about 0.05 and 0.2 during 18:00 to 23:00 UT. This signified weak scintillation. In Addis Ababa station, the scintillation index ranged from about 0.05 to 0.45. The scintillation was maximum at about 17:30 UT, with value of about 0.45. This value signified moderate scintillation. The maximum scintillation in Bangalore was about 0.3 recorded during the 23:00 UT. Comparing the scintillation occurrence in the three stations, Addis Ababa recorded maximum , with highest level of occurrence, while Ile-Ife recorded the least , which can be said to be very minimal. However, scintillation occurrence was more quiet during period on 19 August 2011 in the two stations of Ile-Ife and Addis Ababa, with maximum values of 0.6 and 0.66 respectively. There was no values at Bangalore station on 19 August. The storm events on 6 August started at about 19:00 UT, which was after sunset. The rise in F-layer height was not disturbed and irregularities were formed in the different manner as on an undisturbed night.
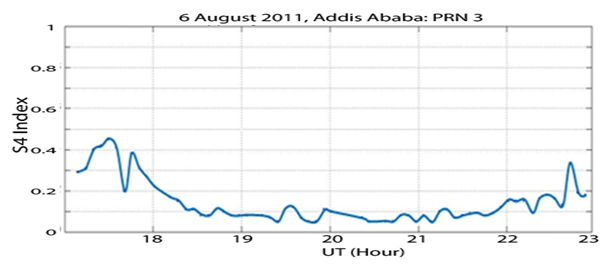
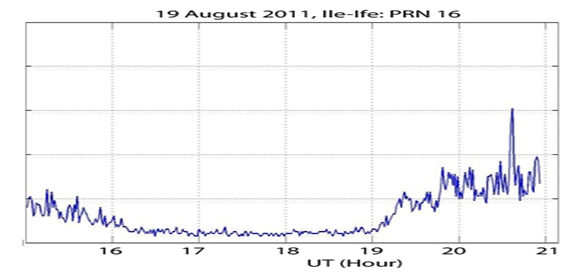
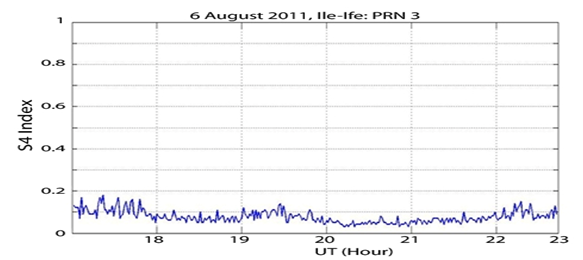
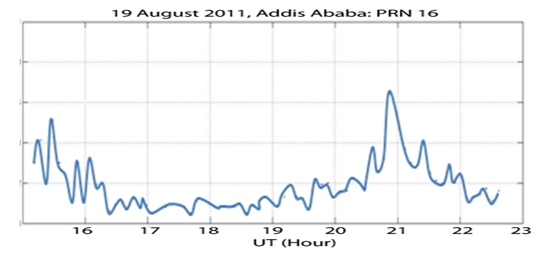
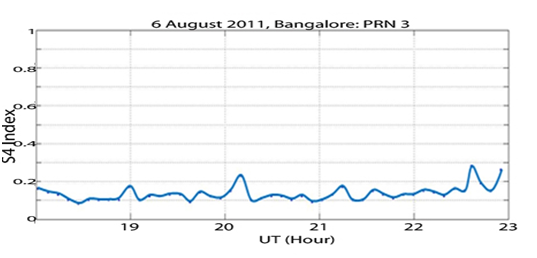
Figure 5 Scintillation Occurrence during the Storm Event on 6 August 2011 and Quiet Period of 19 August 2011 in the Stations.
Scintillation occurrence during 9 March, 2012 storm event and 20 March, 2012 quiet period
Figure 6 represents the scintillation index during the storm event on 9 March, 2012 and quiet period on 20 March, 2012 in the three stations. In Ile-Ife station on 9 March, the scintillation index ranged from about 0.05 to 0.25, signifying low scintillation. On the other hand, Addis Ababa station recorded moderate scintillation of about 0.45 at about 17:00 UT, and remained low for the rest of the night. For the Bangalore station, scintillation was weak with values of less or equal to 0.1. The observed in Addis Ababa station during the storm event was an indication of moderately high formation of irregularities of electron density in the ionosphere. The Figure 6 also indicates that the scintillation occurrence during quiet period on 20 March 2012 was above 0.6 in Ile-Ife and Addis Ababa stations and was less than 0.2 at Bangalore station. The storm on 9 March occurred post-midnight period, implying that the rise in F layer height and then falls created the irregularities.18
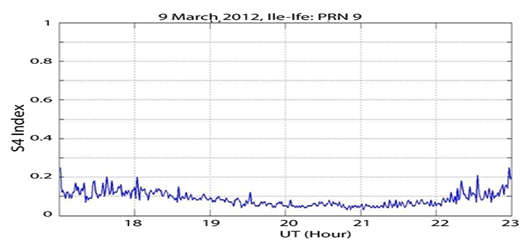
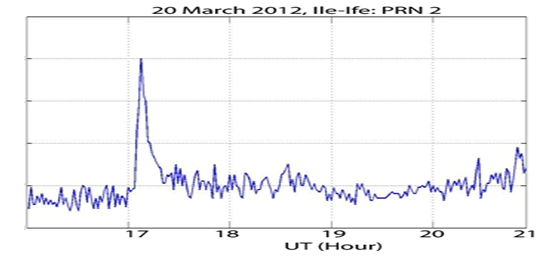
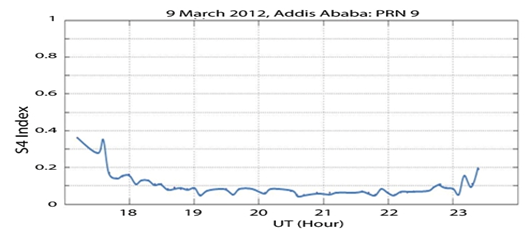

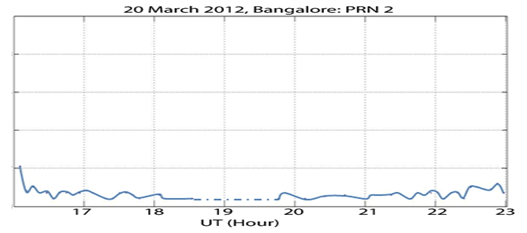
Figure 6 Scintillation Occurrence during the Storm Event on 9 March 2012 and Quiet Period on 20 March 2012 in the Stations.
Scintillation occurrence during 1 October, 2012 storm event and 5 October, 2012 quiet period
The amplitude scintillation during the storm event on 1 October, 2012 is shown in Figure 7. In the period of observation, Ile-Ife and Addis Ababa stations experienced moderate scintillation. It was about 0.42 in Ile-Ife and Addis Ababa. The magnitude of occurrence was equally high, though higher in Ile-Ife than in Addis Ababa station. The situation was diffferent in Bangalore station, as the scintillation was low (maximum was about 0.26) and the magnitude of occurrence was very low. The period of increased scintillations in Ile-Ife and Addis Ababa was during the recovery phase of the storm event. The storm event, which was preceded with SSC occurred at 05:00 UT, post-midnight.
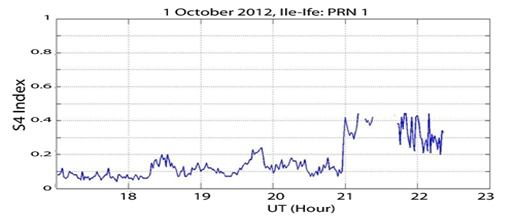
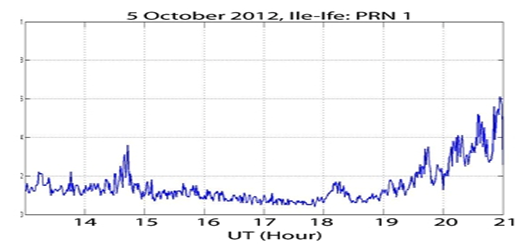

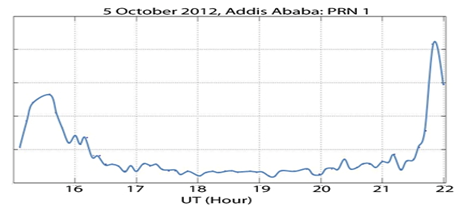
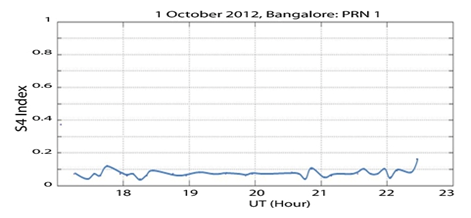
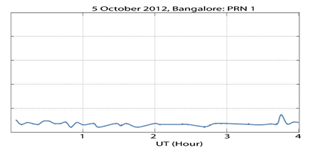
Figure 7 Scintillation Occurrence during the Storm Event on 1 October 2012 and Quiet Period on 5 October 2012 in the Station.
Generally, scintillation at low latitude can either be inhibited or triggered during storm, depending on the phase of the storm and its local time of occurrence. Triggered scintillation may increase navigation errors or, in some cases, cause navigation failure.
Impacts of Scintillation on GNSS
Scintillations can cause degraded receiver tracking performance and in extreme cases, ‘loss of lock’. It then becomes an issue to GPS and other GNSS users, especially stations within EIA. From the analysis in this work, it was obvious that scintillation was dependent on location and the condition of the ionosphere. GPS recievers located at Addis Ababa may likely experience some degree of ionospheric scintillation more than that at Ile-Ife and Bangalore stations when tracking satellites at low elevation angles to the north. The results of the scintillations during geomagnetic storms considered does not pose serious threat to GPS receivers like that during quiet conditions in the three stations.
The scintillation occurrence during intense geomagnetic storms at low latitude stations (regions located within EIA) revealed that scintillation can be inhibited or triggered during geomagnetic storms depending on the phase of the storm and time of occurrence. It also depends on the geographyical location, with Addis Ababa recording the highest scintillation index during the periods of study. The comparative results between storm-time and quiet-time scintillation occurrence showed that scintillation occurs more during quiet time over all the stations, with Addis Ababa recording the highest values in the days considered. This observation of highest occurrence of scintillation at Addis Ababa is particularly note worthy, considering the respective positions of the stations to the EIA crest. One would have expected the scintillation occurrence to be more at Ile-Ife, since it is farther away from EIA crest compared to Addis Ababa and Bangalore stations. This observation can be as a result of the complexity in EIA morphology. The results from this work will be useful to adjust existing scintillation models. The GPS receivers can then be designed to operate in scintillating environments.
The authors are grateful to Scripps Orbit and Permanent Array Center (SOPAC) for the GPS data for Addis Ababa and Bangalore stations. We acknowledge Prof. P. Doherty of the Institute of Scientific Research, Boston College, USA, and the Air Force Research Laboratory (AFRL), USA, for making available the GPS device for research at Ile- Ife, Nigeria. We also thank G.K. Seemala for making available the GPS TEC software. We also acknowledge the World Data Center, Kyoto, Japan, and OMNI centre for providing data which was employed in classifying geomagnetic events. We also acknowledge the critical review of the manuscript by Prof. M. O. Olorunfemi, Department Geology, OAU, Ile-Ife.
Authors declare that there are no conflicts of interests.

©2017 Olatunbosun, et al. This is an open access article distributed under the terms of the, which permits unrestricted use, distribution, and build upon your work non-commercially.