Review Article Volume 6 Issue 4
Biomathematical analysis on the error of 3D printing
during COVID-19 pandemic
Bin Zhao,1
Regret for the inconvenience: we are taking measures to prevent fraudulent form submissions by extractors and page crawlers. Please type the correct Captcha word to see email ID.

Xia Jiang2
1School of Science, Hubei University of Technology, China
2Hospital, Hubei University of Technology, China
Correspondence: Dr. Bin Zhao, School of Science, Hubei University of Technology, Wuhan, Hubei, China, Tel +86 130 2851 7572
Received: October 07, 2022 | Published: October 13, 2022
Citation: Zhao B, Jiang X. Biomathematical analysis on the error of 3D printing during COVID-19 pandemic. Phys Astron Int J. 2022;6(4):131-133. DOI: 10.15406/paij.2022.06.00265
Download PDF
Abstract
3D printing technology brings vitality to the innovation of design, and is a demonstration of the integration of science and art innovation in industrial design. In this paper, the control range of different types of printers on the accuracy of toy product parts is studied, and the accuracy of the specified types of machines is judged by the calculation and analysis of test data and comparison. By realizing 3D printing combined with industrial design practice, the innovative use of 3D printing technology and art provides a scientific reference for the improvement of the manufacturing level of the basic disciplines of industrial design during COVID-19 pandemic.
Keywords: 3D printing, building block toys, design practice, precision analysis, industrial manufacturing
Introduction
a. Background of the subject
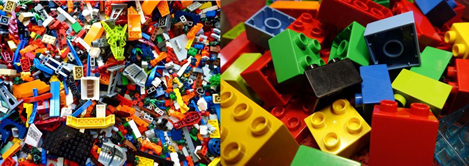
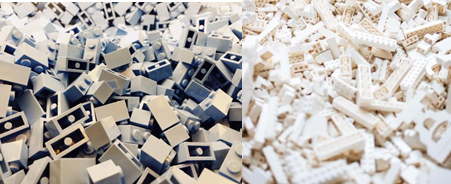
The development of 3D printing technology has revolutionized the future of manufacturing, where the shape and structural design of specific types of toy products are not constrained by traditional manufacturing processes; designs can be made into realistic products from conceptual solutions by 3D printing equipment, thus greatly improving the efficiency of design simulation. Block toys are usually cubic wooden or plastic solid toys (Figure 1), which allow for different arrangements or for construction activities, and blocks come in various styles, which have a great role in children's intellectual development during COVID-19 pandemic.

Figure 1 Reference toy intention diagram.
The new manufacturing technology, represented by 3D printing technology, provides a new direction for the transformation of the traditional manufacturing model. There are two different types of 3D printers (Figure 2) with different accuracy for parts processing, and experiments and analysis are needed to confirm the optimal choice of printer as the designated processing.

Figure 2 Printer type and parameters.
b. Importance of the problem
In order to pass on the traditional toy culture to the next generation in a more reasonable way, it is imperative to adopt a fun and enlightening approach to guide and cultivate this group's psychological characteristics. Children and adolescents can perceive, understand, and master a series of knowledge and skills related to this craft through the manipulation of such toys.
Based on the collation and comparison of experimental data, analysis of 3D printing processing on the error brought about by the degree of accuracy of product parts, the trend of design groundedness will break the limited manufacturing level of the previous design team, the design studio organization processing, analysis of parts more free and reliable. In the manufacturing process, if the amount of consumables is equal to the amount estimated at the time of design, then there will be no waste. This not only benefits the environment, but also saves the manufacturer's production costs.
c. Relevant scholarship
3D printing technology refers to the computer-controlled stacking of materials such as metal, plastic, ceramics, resin, wax, paper, sand, etc. Using specific machines, the printed materials are stacked layer by layer in a layer-by-layer fashion, eventually printing the 3D model in the computer as a physical object. There are already innovative methods of research on the basis of existing technologies regarding the personalized design of products. Analysis of printer error accuracy enables optimization of models, such as parametric design, which plays an important role in 3D printing.
Parametric as a new design thinking and design style should establish a deeper interaction between object and user through some kind of demand. In the process of collaborative development and collaborative innovation design of new products, 3D printing technology has diverse features such as low cost, low risk, short cycle time and fast adjustment. The calculation of the accuracy and effect of different models can greatly improve the production efficiency, and such research methods have a great impact on 3D printing.
d. Model assumptions
Based on the questions posed in this paper and the analysis of the problems above, we make the following assumptions.
- there will be no other external factors in the printing device that will affect our
- The error of the dimensional result of the part measurement will not be greater than 1mm.
- The accuracy of the measurement is only based on the length of the same index, and other dimensions are not
Method
Dimensional measurements of the models processed by different printers were performed to compare the error fluctuations of the prototypes produced by the two machines by means of mathematical statistics. A printed block product part was formulated (Figure 3), assuming that a single part needs to meet the assembly requirement of 20mm total length, and noting Shape1 as machine A and Shape1 HD as machine B. First, the same part was processed from both 3D printers using the same raw material under equal conditions, with 20 copies printed from each machine, and a 95% confidence interval was calculated for taking the average part length of 20mm.

Figure 3 Intentional drawing of the printed part.
a) Acquisition of samples
Measure and organize the dimensional data (Figure 4&5), assuming that the data for the length of the toy part printed by these two printers are known to match
.

Figure 4 Measured length values of parts processed by A printer (unit: mm).

Figure 5 Measured length values of parts processed by B printer (unit: mm).
b) Description of data collation
The two sets of data from the measurements were analyzed and processed separately in spss software (Figure 6). Output of the statistical data in spss software (Figure 7).
Results
a. Organizing data
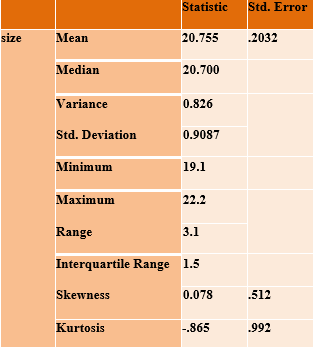
After the software has crunched the data, the following results are listed (Figure 8&9).

Figure 8 Statistics of the parts produced by printer A.

Figure 9 Statistics of the parts produced by printer B.
b. Data processing and calculation
Data for Group A:
Taking the 95% confidence interval of the mean length of the part calculate:
∵1-α=0.95,∴α=0.05,α/2=0.025,n=20
Calculated from the above spss software: s=0.5145,
t0.025(19)=2.0930,
Data for Group B:
Taking the 95% confidence interval of the mean length of the part calculate:
∵1-α=0.95,∴α=0.05,α/2=0.025,n=20
Calculated from the above spss software: s=1.9843,
t0.025(19)=2.0930,
c. Results of the analysis and corrections
After comparing the results of the analysis of the two sets of data, the 95% confidence interval of the mean length of the parts was calculated as (20.330, 21.180) for group A and (20.254, 20.736) for group B. It was judged that printer B was more accurate than printer A. To ensure that the experimental results are more accurate, the experiment can be repeated several times and the average of each data can be judged again, which in turn can make the data results more convincing.
d. Model evaluation and extension
This validation uses an algorithm that calculates confidence intervals by comparing the interval ranges of two groups of sizes, and the smaller interval range group is determined to be more accurate. In addition, a hypothesis test can be performed by setting (X1,X2,... Xn1) be a sample from printer group A, (Y1,Y2, .... ...Yn2) is a sample from printer group B. Since
and
are independent and conform to the F-distribution property, the results of the statistics are as follows:
where
and
are known by the previous SPSS calculation, and comparing the difference between
and
can also make a judgment on the results.
Discussion
The future of 3D printing technology not only fundamentally changes the modern manufacturing model that has lasted for nearly a century, but also affects every aspect of the design field from the deepest level, and future designers will no longer have their imagination sealed in the cage of the product processing process, and designers' imagination and creativity will be stimulated as never before.
Independent designers can rely on 3D printing technology to turn their ideas into real products, thus giving rise to a large number of independent designers and design brands. The trend of socialization of design will break the rigid structure of the previous design organization, and designers will be able to judge the specifications of prototypes more easily, so that the design will be more deeply into all aspects related to people's life and production. The design and manufacture of toys will also be more scientific and rational. This experiment uses toy parts as an example, and introduces a method for judging the processing accuracy of 3D printers and comparing equipment errors through the use of mathematical and scientific knowledge, which can play an auxiliary reference role for design research.
The above is the calculation method and verification results of this statistical problem related to the effect inspection in product design, please correct me if there is any deficiency.
Conflicts of interest
We have no conflict of interests to disclose and the manuscript has been read and approved by all named authors.
Acknowledgments
This work was supported by the Philosophical and Social Sciences Research Project of Hubei Education Department (19Y049), and the Staring Research Foundation for the Ph.D. of Hubei University of Technology (BSQD2019054), Hubei Province, China.
References
- WANG Ke, LIU Yang. Synergistic Development of Parametric Design and 3D Printing[J]. Packaging Engineering. 2017;38(16):147–151.
- GU Fang-zhou, ZHAO Jiang-hong, ZHAO Dan-hua. Parametric Design and Parametric Style[J]. Zhuangshi. 2020(4):16–20.
- WANG Xin-fei. Study on Children's Toys Design Based on the Growth of Cognition[D]. Qingdao: Qingdao Technological University, 2016.
- YANG Da-wei. Play and Intelligence: the Influence of Modular Trait of Building Toys on Children's Creativity[J]. Art & Design Research. 2017;4:84–85.
- LIU Guan-zhong. Science of Human Affairs[M]. Changsha: Central South University Press, 2006.

©2022 Zhao, et al. This is an open access article distributed under the terms of the,
which
permits unrestricted use, distribution, and build upon your work non-commercially.


