eISSN: 2576-4543


Research Article Volume 2 Issue 2
1V.E. Zuev Institute of Atmospheric Optics of the Siberian Branch of the Russian Academy of Sciences, National Research Tomsk State University, Russia
2National Research Tomsk Polytechnic University, Russia
3Institute of Monitoring of Climatic and Ecological Systems of the Siberian Branch of the Russian Academy of Sciences, Tomsk State University of Control Systems and Radioelectronics, Russia
Correspondence: Nikolay P Krasnenko, Institute of Monitoring of Climatic and Ecological Systems SB RAS, Tomsk State University of Control Systems and Radioelectronics, 634055, Tomsk, 10/3, Akademicheskii pr., IMCES SB RAS, Russia, Tel 7 (3822) 492 418
Received: September 28, 2017 | Published: March 16, 2018
Citation: Belov VV, Burkatovskaya YB, Krasnenko NP, et al. Application of the monte-carlo method for solving problem of acoustic radiation propagation along vertical paths in the atmosphere. Phys Astron Int J. 2018;2(2):68-73. DOI: 10.15406/paij.2018.02.00064
Difficulties of the analytical approach to a solution of the problem of acoustic radiation transfer through the outdoor atmosphere call for the application of numerical methods, from which the most promising, in our opinion, is the method of statistical simulation (Monte Carlo). This method allows sound scattering on refractive index fluctuations caused by wind and temperature in homogeneities to be correctly taken into account for the most realistic models of the propagation medium and geometrical parameters of the problem to be solved. A review of authors’ works devoted to the application of the Monte Carlo method to a solution of the problem of acoustic radiation transfer through the lower 500-meter layer of the plain-stratified turbulent atmosphere is presented in the report. The acoustic model of the atmosphere is considered, and the structure and special features of the computational algorithm of the Monte Carlo method are discussed. The influence of the outer scale of atmospheric turbulence on the distribution of the transmitted acoustic radiation intensity is investigated for sound frequencies in the range 1–4 kHz. Regional and seasonal variations of the contribution of multiple scattering to the transmitted radiation intensity as well as the effect of cloudiness and source altitude are investigated. The calculated dependences of the transmitted acoustic radiation intensity and of the multiple scattering contributions on the angle of source divergence and source altitude above the Earth’s surface are discussed. Calculations were performed for a point sound source and a source with circular aperture and uniform and Gaussian radiation distributions. Good agreement of calculated values of the total sound attenuation with the available experimental data confirms the reliability of the results of statistical simulation. PACS: 43.28.-g; 43.28.+h
Keywords: atmospheric acoustics, monte-carlo method, statistical simulation, acoustic radiation transfer
Investigations of sound propagation in the atmosphere are necessary for its prediction, finding direction to a sound source, and quantitative interpretation of results of acoustic sounding.1 In the outdoor atmosphere, the sound propagation is influenced by a great number of factors, the main of which are the vertical atmospheric stratification, viscosity, turbulence, and angular beam divergence. Difficulties of analytical approach call for the application of numerical methods from which,2,3 by our opinion, the Monte Carlo method first used in4 for statistical estimation of the multiple scattering contribution to the distribution of the transmitted acoustic radiation intensity over detector zones depending on the sound frequency and outer scale of atmospheric turbulence is most promising. This method allows sound scattering on the acoustic refractive index fluctuations caused by wind velocity and temperature in homogeneities to be taken into account for the most realistic models of the atmosphere and concrete geometry of numerical experiment.
The main results obtained by the authors can be found in.4–11 Calculations by the Monte Carlo method were performed for the acoustic model of the atmosphere based on the theoretical estimates of sound scattering by the atmospheric turbulence presented in12 for the von Karman model of the spectra of atmospheric temperature and wind velocity fluctuations. In calculations of the vertical profiles of the acoustic absorption and scattering coefficients, the vertical profiles of the atmospheric temperature, pressure, and sound velocity were taken from the standard model of the mid-latitude summer atmosphere. Both conventional computational procedures13 and procedures developed in6,14,15 with allowance for the specifics of the interaction of sound with the atmosphere were used. The flow chart of the computational algorithm was presented in.10 Calculations were performed for a point source with coordinates , where , and a source with circular aperture 1 m in diameter and power of 1 W, sound frequencies , and the outer scale of atmospheric turbulence L0=10–100 m. The angle of source divergence was . The receiver was placed at an altitude of 500 m. The radiation distribution over the horizontal plane of the detector depending on the distance Нfrom the vertical axis passing through the source (over the detector zones with H =10–100 m with a step of 10 m and then with a step of 50 m to H =500 m) was estimated with allowance for the contribution of multiply scattered radiation. The acoustic radiation of the source propagated through the plane-parallel atmospheric layers with constant within these layers coefficients of classical, and molecular absorption, and scattering on turbulent fluctuations of the temperature, and wind velocity, where . The 500-meter plain-stratified turbulent atmosphere was subdivided into 25 layers 20 m each. Calculations were performed on a personal computer for 106–107 phonon histories that provided error in the range 3–10%. Time of calculating the individual realization did not exceed 15 min.
As an example, Figure 1 shows the altitude dependence of the total attenuation coefficient for frequencies in the range 1000-4000 Hz and outer scale of turbulence L0 = 80 m (a) and the phonon scattering probability (b). Results of calculations demonstrated that for a frequency of 2 kHz, most often used in sodars, the turbulent attenuation becomes comparable with the molecular absorption in the surface layer of the atmosphere already for L0 = 15 m ( ). For L0 = 80 m, in the examined frequency range (Figure 1). In the surface layer, the total attenuation coefficient increases approximately by an order of magnitude when L0 increases from 10 to 80 m.
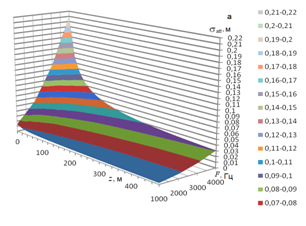
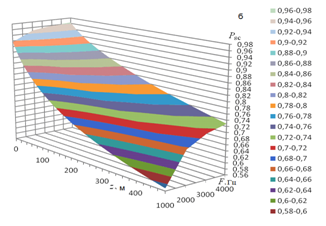
Figure 1 Altitude dependence of the total sound attenuation coefficient (a) and phonon survival probability (b) for frequencies F=1000–4000 Hz and outer scale of turbulence L0=80 m.
Figure 2 shows the normalized phase functions of sound scattering on temperature (a) and wind velocity fluctuations (b). Results of calculations demonstrated that their elongation in the forward direction increases with the outer scale of turbulence. Thus, the portion of radiation scattered in the forward direction increases by a factor of 15 when L0 increases from 10 to 40 m; it increases by a factor of 63 for L0=80 m. it should also be noted that good agreement of the calculated coefficients and scattering phase functions with the available experimental data was demonstrated.12
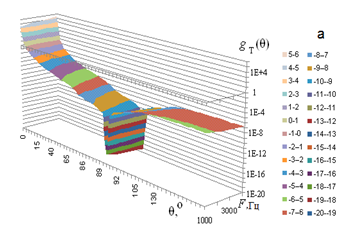
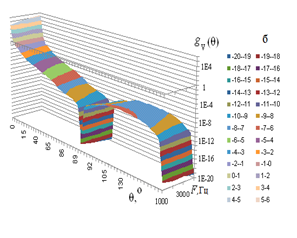
Figure 2 Normalized phase functions of sound scattering on temperature (a) and wind velocity fluctuations (b) for frequencies F =1000–4000 Hz and outer scale of turbulence L0 = 80 m.
Results of calculations by the Monte Carlo method of the total attenuation of acoustic radiation, in dB, for vertical sound propagation at frequencies of 2800 Hz (the dashed curve) and 4000 Hz (the solid curve) are shown in Figure 3. Symbols here show the results of measurements16 with a tethered balloon. Good agreement of the results of our calculations by the Monte Carlo method with the experimental data can be seen, which confirms the efficiency of the suggested computational algorithm.
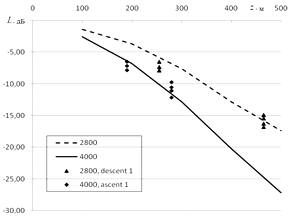
Figure 3Total sound attenuation for its vertical propagation. Here the dashed curve shows the results of calculations by the Monte Carlo method and closed triangles show the data measured13 with the ascending tethered balloon at F =2800 Hz; the solid curve shows the results of our calculations and closed diamonds show the data measured13 with the descending tethered balloon at F =4000 Hz.
The influence of the source aperture and the form of radiation distribution is illustrated by Figure 4 which shows the distributions of the transmitted (Itr) and multiply scattered (Imsc) radiation intensities, in W/m2, over the detector zones for the point sound source and the source with the circular aperture 1 m in diameter and uniform and Gaussian radiation distributions over the source aperture for F=3000 Hz, , and L0=10 m. From the figure it can be seen that the intensity of transmitted radiation in the first detector zone Itr ( ) increases by 66–68% for the source with the circular aperture and Gaussian radiation distribution in comparison with the point source. For the source with the circular aperture and uniform radiation distribution, it remains almost unchanged.
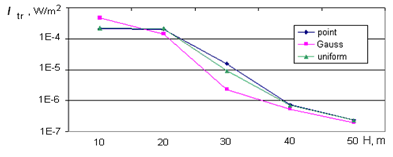

Figure 4 Distributions of the intensity of transmitted (Itr) and multiply scattered (Imsc) acoustic radiation over the detector zones for the point source and the source with circular aperture and uniform and Gaussian radiation distributions over the source aperture.
Figure 5 from10 shows the dependence of the distribution of transmitted and multiply scattered radiation over the detector zones for frequencies of 1.7 and 4 kHz and angles of source divergence and 15°. Results of calculations demonstrate that for F=1.7 kHz, the contribution of multiple scattering to the transmitted radiation intensity increases with the outer scale from ~10% for L0=10 m to ~90% for L0=60 m; for L0=80 m, the transmitted radiation intensity is almost completely determined by the contribution of multiple scattering. In this case, the sharp decrease of Itr is caused by the exit from the source radiation cone.
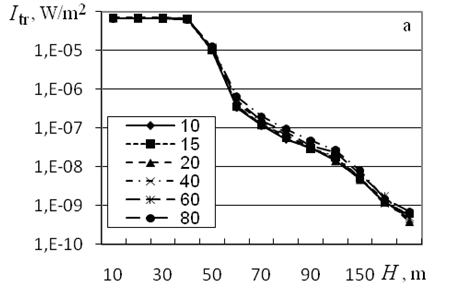
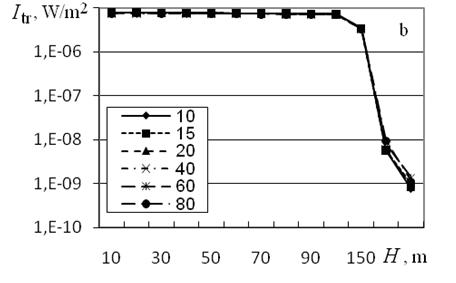
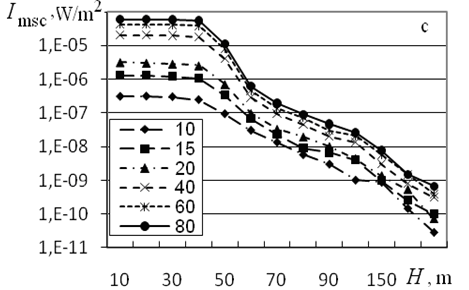


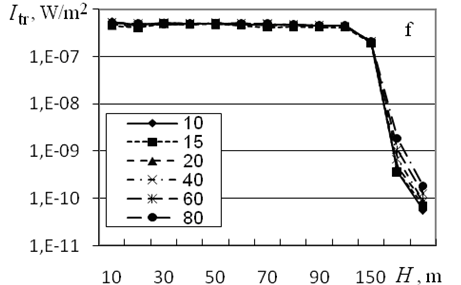
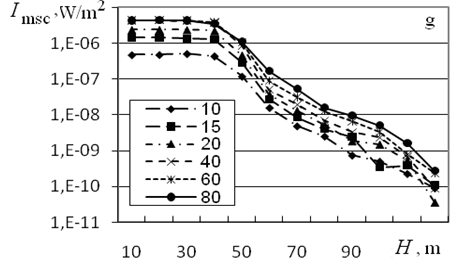
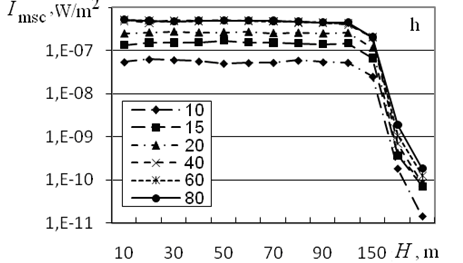
Figure 5 Distributions of the transmitted (Itr, W/m2) and multiply scattered radiation intensity (Imsc, W/m2) over the detector zones for F =1.7 kHz, (a and c) and 15 (b and d); F = 4 kHz, (e and g) and 15 (f and h) and indicated values of the outer scale of turbulence, in meters.
The contribution of multiple scattering within the source radiation cone increases from 4.7×10⁻⁷ to 4.3×10⁻⁶ W/m2, that is, by 89% when L0 increases from 10 to 80 m. This increase in the multiple scattering contributions compensates for the corresponding decrease of the transmitted radiation intensity due to the increase in the outer scale of turbulence and, as can be seen from Figure 5A, Itr for m remains virtually independent of L0.
The dependence of the transmitted radiation intensity for the first detector zone on the angle of source divergence is well described by a quadratic power-law dependence: , where is in W/m2 and is in degrees. Thus, for F=1000, 2000, 3000 and 4000 Hz, A =2.8×10⁻³, 1.4×10⁻³, 2×10⁻⁵ and 4×10⁻⁶, respectively. When the angle of source divergence increases from 5 to 25°, decreases by 96%, which confirms the necessity of application of massive protective shields in sodars.
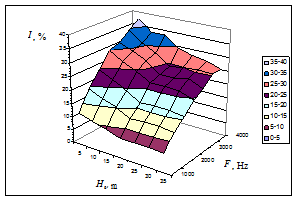
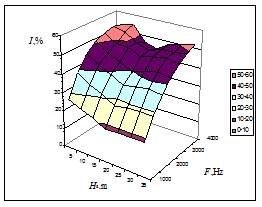
Figure 6 from5 shows the calculated dependences of the multiple scattering contribution (I,%) to the transmitted radiation intensity for the first detector zone with radius H=10 m on the source altitude Hs for L0=10 Figure 6(A) and 20 m Figure 6(B). Sound frequencies F are plotted on the y axis. From the figure it can be seen that the multiple scattering contribution essentially decreases as the source altitude increases from 5 to 20 m. With further increase in the source altitude, it changes only slightly. Therefore, the source altitude Нs=20 m can be recommended as optimal for acoustic sounding taking into account that the multiply scattered signal represents noise in the interpretation of the data of acoustic sounding.
A B
Figure 6 Dependence of the multiple scattering contribution to the transmitted radiation intensity on the source altitude Hs above the Earth’s surface for L0 =10 (A) and 20 m (B).
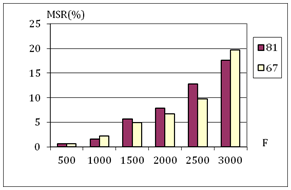
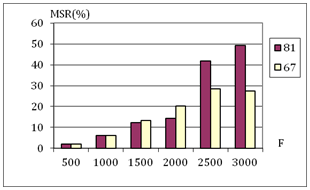
The influence of cloudiness is illustrated by Figure 7 which shows statistical estimates of the multiple scattering contribution, MRS, in %, to the transmitted radiation intensity for frequencies in the range 500–3000 Hz in clear and cloudy winter days (for the average relative surface air humidity in winter u = 67 and 81%.17
A B
Figure 7 Contribution of multiple scattering to the transmitted acoustic radiation intensity in the first detector zone in clear and cloudy days for Hs = 35 m and L0 =10 (A) and 20 m (B).
From the figure it can be seen that for L0=20 m and sound frequency of 3000 Hz, variations of the multiple scattering contribution caused by cloudiness are ~20%; moreover, the contribution of multiple scattering increases in cloudy days. To investigate seasonal variations of the multiple scattering contribution, calculations were performed with summer18 and winter17,19 standard mid-latitude models of the atmosphere. Results of calculations are shown in Figure 8.8
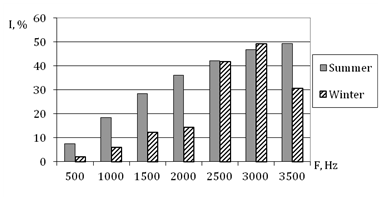
Figure 8 Seasonal (winter-summer) variability of the multiple scattering contribution to the transmitted radiation intensity for the first detector zone, Hs =35 m, and L0 =20 m.
From the figure it can be seen that in summer for L0=20 m the contribution of multiple scattering to the transmitted radiation intensity is by 4–17% larger than in winter. In addition, the seasonal dependence is complex in character. For larger L0 values, the seasonal dependence is intensified. For L0=5 m, the difference does not exceed 4%; for L0=10 m, it is 10% for the acoustic frequency F=2500 Hz; and for L0=20 m, it reaches 17%.
Statistical estimates of the regional variability of the multiple scattering contributions were obtained for Moscow and Novosibirsk. It was established that in winter for L0=20 m and F=3000 Hz, the contribution of multiple scattering for the first detector zone was 34% for Moscow and 50% for Novosibirsk, which demonstrates its essential regional variability.
Results were obtained with support under Project No. 5.3279.2017/PSN of the Assignment of the Ministry of Education and Science of the Russian Federation and under the Project No. IX.138.2.5 of the Program of Basic Research of the Siberian Branch of the Russian Academy of Sciences.
Authors declare there is no conflict of interest.

©2018 Belov, et al. This is an open access article distributed under the terms of the, which permits unrestricted use, distribution, and build upon your work non-commercially.