eISSN: 2576-4543


Review Article Volume 3 Issue 6
Fryazino branch of the Federal state budget, Institution of science Institute of Radio engineering and electronics, Russia
Correspondence: Sergey N Antonov, Fryazino branch of the Federal state budget, Institution of science Institute of Radio engineering and electronics, Russia
Received: October 30, 2019 | Published: November 11, 2019
Citation: Antonov SN, Kotelnikov VA. A review of physical principles and applications of acousto-optic deflectors on the basis paratellurite. Phys Astron Int J. 2019;3(6):235-249. DOI: 10.15406/paij.2019.03.00189
Deflectors based on Bragg non-axial anisotropic diffraction in a paratellurite crystal are considered. Practically significant relations connecting the main parameters are obtained, the factors limiting the diffraction efficiency and the angular scanning range are determined. The mode of multibeam acousto-optic diffraction as a method of creating a multichannel optical information output system is considered. A review of several new, practically implemented methods for increasing the main functional parameters of deflectors is presented. The possibility of using the diffraction mode in the second Bragg maximum in terms of sound amplitude to extend the scanning band is shown. The two-crystal scheme of the deflector, which can significantly improve the efficiency of diffraction, expand the scanning range and create a polarization-insensitive deflector, is considered. Acousto-optic switch of fiber-optic channels was developed. The possibility of using multibeam acousto-optic diffraction to improve the energy efficiency of laser radiation by modifying its profile is established
Keywords: acousto-optic, acousto-optic deflector, piezoelectric transducer, diffraction efficiency, light polarization, fiber optics
AO, acousto-optics; AOD, acousto-optics deflector; RFS, radio frequency signal; SM, switch-multiplexer; FO, fiber-optic; ETI, energy threshold of impact
Applied acousto-optics (AO) - control of optical radiation parameters by ultrasonic waves propagating in transparent media.1–8 In practice, the acoustic frequency range is in the range of units to hundreds of megahertz, and optical - from ultraviolet to tens of microns. Well studied use of AO in the analyzers of signals, spectral processing of optical images, optical processors, etc. However, it can be argued that the technological revolution in optoelectronics has replaced the rest and to date has left only two practically significant areas of AO: control of the intensity of the laser beam (modulators) and its angular position (deflectors). The principal features of AO devices are: the ability to control intense laser radiation with a power density of tens and hundreds of kW/cm2, a sufficiently high speed (up to tens of ns), the absence of mechanically movable elements, small light losses (several percent), small size and weight. AO modulators are used for Q-switching of lasers, external modulation of radiation, AO deflectors (AOD) are intended for scanning of a laser beam in systems of processing of materials and an output of images. As an example, the original page of the foreign passport of the Russian Federation is made by laser using AOD (developed by the author of the article). The main material of modern AO devices is single crystals of paratellurite (TeO2). The crystal has a phenomenally large value of AO quality M2=1000•10-18s3/g at diffraction of light propagating near the axis [001] on a slow shear acoustic mode, is transparent in a wide range of wavelengths from 0.35µm to 5µm, has a high radiation resistance, developed technology of growth and processing of large homogeneous samples (cube more than 20mm).9 The AO theory on TeO2 crystal and a number of important realizations are studied and described very fully.10–14 The review is devoted to the description of physical principles of operation of AOD based on TeO2, new methods of improving the basic parameters - the maximum scanning angle, diffraction efficiency, examples of practical use.
General provisions of the deflector on paratellurite
Anisotropic diffraction on a slow acoustic mode
The vector diffraction diagram of a non-axial anisotropic AOD with a change in the polarization mode of light is shown in Figure 1.15 The angle of deviation (dispersion) between the rays is equal to Kt and Kd:
(1)

Figure 1 Vector diagram of an anisotropic AOD, K - the wave vector of the sound; Kt and Kd – vectors of incident and diffracted light, respectively no and ne of the surface of the refractive indices of the crystal; ΔK is the module of the vector of sound, in rebuilding its frequency.
Where λ - the wavelength of light, f and V, is the frequency and speed of sound, respectively.
The wave vector of sound is directed at an angle α to the axis [110] and is tangent to the surface of the refractive indices of diffracted light. The mismatch of the wave vectors describes the value of the the detuning of the Bragg synchronism:
(2)
It is seen that the Bragg synchronism disorder provides two maxima, since the exact synchronism is realized at two frequency values. Due to this, diffraction occurs in a wide frequency band. By varying the angle of incidence of the light beam on the AO cell, you can find a compromise between the bandwidth and the depth of the efficiency decrease in the center of the strip between the two maxima. The given limit detuning determines the maximum frequency band:
(3)
where: – refractive index of ordinary light mode.
The calculation is carried out for the following experimental conditions: angle transducer length 6 mm, height 4 mm. Parameters: the wavelength of light the light aperture of 0.6 mm, full divergence of 2.4 mrad. The calculation was made on the basis of coupled wave equations taking into account higher diffraction orders.10 To account for the angular divergence of radiation, the efficiency obtained for plane waves was averaged over the angular radiation spectrum, which was considered Gaussian, the maximum was sought near the phase modulation index separately for each frequency. Figure 2 is the result of the calculation – the dependence of the sound frequency f of the diffraction efficiency the ratio of the intensity of the diffracted light beam to the incident.
The dashed dependence is the angle of the exact Bragg synchronism, when the wave vector of sound in a single Central point “is in contact” with the wave surface of the diffracted light. Continuous dependence − broadband mode of the deflector, when the intersection of the sound vector with the wave surface of light is carried out at two points see Figure 1.
There is a tendency (contradiction) – increasing the frequency range leads to a greater failure of efficiency. In practical deflectors used bevel sound face - angle α from 4o to 6o. The calculation of the dependence of the central frequency of the deflector and the frequency band (angular scanning range) on the angle α was carried out in such a way that in each case the minimum efficiency was equal to 80%. Figure 3 is frequency characteristics of deflectors with: and are presented.

Figure 3 The frequency characteristics of the deflectors:α=6º the central frequency is 25 МНz,α=5º-32 МНz and α=5º-37 МНz.
The TeO2 crystal has a significant acoustic anisotropy: the energy drift angle in the diffraction plane is about 10 times greater than the angle α. Thus, the larger α, the larger the crystal is required and the lower the M2. However, this extends the scanning range and increases the average deflection angle, which increases the contrast in the image recording area. Thus, the choice of α in the development of AOD is an independent engineering task.
High-performance multi-beam diffraction
Theory
The section is devoted to highly effective (up to 100%) multibeam Bragg diffraction AO - splitting (separation) of one input laser beam into several independent beams with a total diffraction efficiency close to 100%. In general, if the AO cell is supplied with several independent frequencies f1...fn with a total power close to the phase modulation index equal to π then, in addition to the main diffraction orders kd, corresponding to the input frequencies in the diffracted field and near the zero order, there are additional intermodulation orders ki1 and ki016 Figure 4.
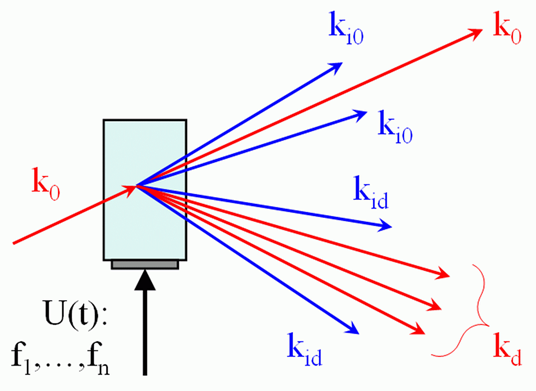
Figure 4 The scheme of formation of main and intermodulation diffraction beams at multi-frequency radio signal.
The intensity of each of the beams depends in a complex nonlinear way on the number and power of the input electrical signals. For the absence of intermodulation effects, it is necessary that the radio frequency signal (RFS) be purely phase modulated, and the modulation period should be several times less than the time of passage of sound through the aperture of light.17–21 In this case, the diffraction field is stationary, and the angle between the directions of propagation of neighboring light rays is greater than their diffraction divergence, and the rays will be separated. Due to the absence of interference orders, the diffraction efficiency approaches 100% regardless of the number of diffraction rays, and their relative power and position are proportional to the power and frequency of the signal components Figure 5.
AOC–AO cell, P–piezoelectric transducer, D–aperture of the light beam. T–the speed and period of the sound wave, τ– the time of passage of the sound wave through the light aperture; 2) the angular distribution of the diffraction field: a) the rays overlap, b) the rays are separated.
Synthesis of phase-modulated RFS, with a given number of spectral components and their capacities, is as follows. The periodic control signal is presented as:
, (4)
where: - amplitude of the spectral component, J- imaginary unit - carrier frequency, T- modulation period, - the phase of the spectral component. A measure of the difference between the phase-modulated signal, as the standard deviation of the square of its amplitude from the mean value is:
, (5)
where: - the amplitude of the RFS, - the average value of the square of the amplitude. It is essential that G does not depend on the power and the initial phase of the signal, but only on the phase differences and the ratio of the amplitudes of its components. The number of components of the signal can be found from the analytical form G as a functions and its minimum, according to the criterion of the optimal signal, it consists of four items:
The experiments were carried out using the AOD corresponding to item 2.1. Here and in all subsequent experiments, deflectors with the technology of acoustic contact of the piezoelectric transducer and the TeO2 crystal providing effective broadband radio signal– ultrasound conversion were used.22 The control RFS consisted of five sinusoidal frequencies: central – 41MHz and four side ±0.3 MHz, ±0.6 MHz. The schematic diagram of the installation is shown in Figure 6.
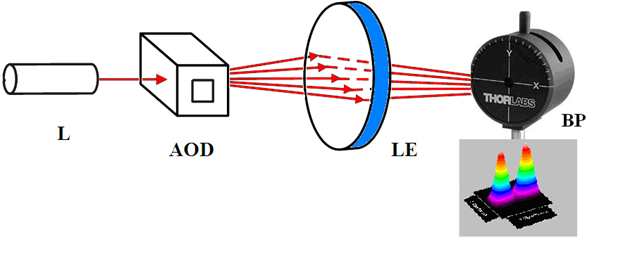
Figure 6 Installation scheme. L – single-mode laser with a wavelength of 0.63µm, aperture of 3 mm, 2 - AOD deflector, LE – lens with a focus of 1 m, BP – laser beam profile meter model THORLABS BP104.
Settings profiler: rotation speed of the slit is 10 Hz; the input window is 10 mm; the slit size of 10µm. In the calculation and establishment of optical circuits was performed to 1 mm coordinate of the displacement meter of the profile corresponded to a 1 mrad deflection of the beam at the output of AOD. The estimated relative accuracy of the beam position measurement was 2 %. Figure 7 Measured angular spectra of light at the AOD output. Figure 7(A) corresponds to a random phase ratio between the frequencies of the RFS. It is seen that the ratio of amplitudes is random and there are additional interference orders. Figure 7(B) is the amplitude of the RFS corresponds to Figure 7(A), and the phase relations between the signals are selected so that the total acoustic response is similar to the frequency-modulated.

Figure 7A The experimental angular distribution of light power with a random of phase relationship frequency components of RFS.

Figure 7B The experimental angular distribution of light power with at optimum phase relationships between frequency components of RFS.
The diffracted field consists of only five rays of equal intensity with total diffraction efficiency close to 100%. Figure 8 time scan of the radio signal supplied to the AOD. Figure 8(A): form RFS with arbitrarily defined phase relationships between frequency components. Figure 8(B) is the amplitude of the frequency component of the saved, and the phase relationships are selected on the criterion of absence of intermodulation orders. At non-optimal phases, the RFS has a significant amplitude modulation, and at the selected ratios, the amplitude modulation is significantly reduced. You can see that RFS Figure 8(B) has partial amplitude modulation, although the result of AO diffraction corresponds to the absence of such modulation. The explanation is that the piezoelectric transducer slightly changes the amplitude-phase shape of the RFS, and the type of ultrasound is close to the optimal signal.

Figure 8A Electronic photo of RFS at the entrance of the deflector AOD at a random phase ratio between the frequency components.
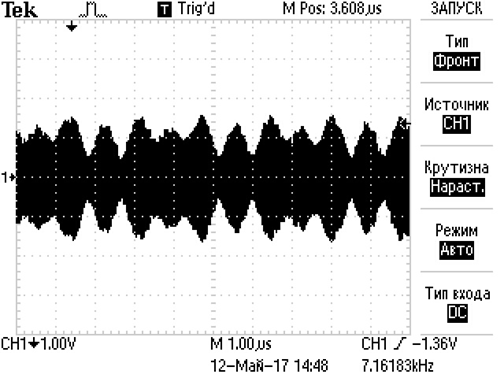
Figure 8B Electronic photo of RFS at the entrance of the deflector AOD at optimum phase relationships between frequency components.
Deflector in phase modulation index mode
When the index phase modulation of the Bragg diffraction (second maximum efficiency as the function of power sound) is an interesting feature of AO diffraction is a modification of the angular spectrum of the diffracted radiation.23 It was found that in the mode of the phase modulation index there is an increase in the efficiency of the AOD.24 The maxima of diffraction efficiency, as a function of sound power, are observed at:
, (6)
, (7)
where: – sound power, L,H - length and height of the transducer, θ– the angle of incidence of light on the border of the sound field. The maximum efficiency of Bragg diffraction will be observed at:γ=π and γ=3π etc.
Figure 9 is the calculated dependences of the efficiency of the AOD diffraction in the operating modes:γ=π and γ=3π (the amplitude of the sound is 3 times greater). At γ=3 high efficiency (almost 100 %) is maintained in a significant frequency band: from 25 to 50 MHz, which corresponds to the frequency range of 40 mrad.
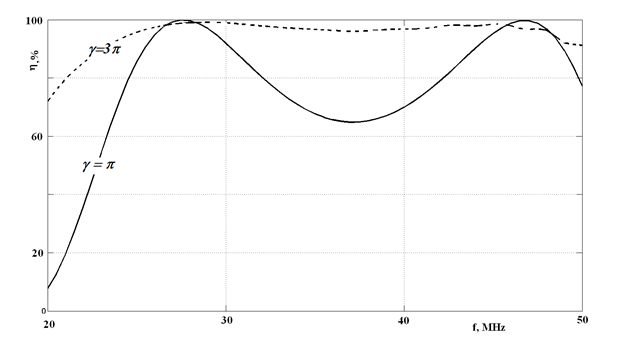
Figure 9 The calculated dependences of the AOD diffraction efficiency in the modes:γ=π - dotted curve, and γ=3π - continuous curve.
To eliminate the influence of thermal effects in AOD measurements were carried out in pulse mode - the duty cycle is 20. Figure 10 shows the experimental dependences of the maximum efficiency of diffraction of the frequency of the ultrasound.
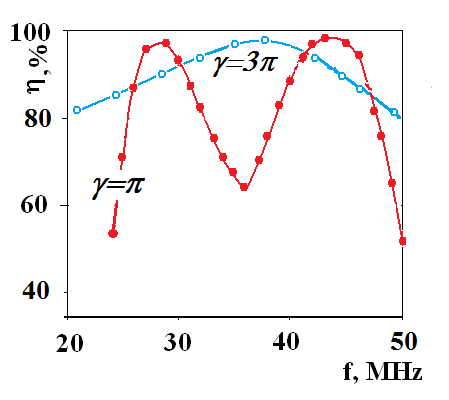
Figure 10 Experimental dependences of diffraction efficiency. It can be seen that in the mode γ= 3π the efficiency failure in the Central frequency domain disappears and the entire frequency range expands.
Figure 11 The result of the joint modes γ=π and γ=3π Nodal points change the power of sound – triangles. The nodal points where sound power changes occur are shown as triangles. Since the beginning of the frequency range to the nodal point T1 RFS power corresponds to the mode γ=3π then to the point T2 γ=π to the point T3 γ=3π to the point T4 γ=π from the point T4 to the end of the range γ=3π.

Figure 11 The result of the joint modes γ = π and γ = 3π. Nodal points change the power of sound – triangles.
Thus, in the frequency band of about 25 MHz, actually achieved efficiency was more than 85 %. Mode γ=3π compared to γ=π requires an increase in the control power of about 10 times. The limit parameters of the AOD are limited by thermal effects associated with a large value of the power of the RFS. In γ=π mode, the sound power was about 400 mW, and in γ=3π mode about 4 W. Due to the fact that half of the range uses one or the other mode, the total increase was not 10, and 5 times. Thus, the average power consumption is about 2 W, which allows implementing a continuous RFS mode. There is no thermal problem if the AOD operates in pulsed mode, for example, when working with pulsed lasers. There is no thermal problem if the AOD operates in pulsed mode, for example, when working with pulsed lasers.
Deflector with two-element phased array piezoelectric transducer
To expand the angular range of the AOD scan, multi-element piezoelectric transducers are used when its elements are excited at the same frequency with a certain phase shift. This makes it possible to deflect the main lobe of the acoustic field diagram and maintain the Bragg synchronism of the AO interaction in a larger band of sound frequencies. Various methods of controlling this phase shift are known: anti-phase inclusion of neighboring elements, installation of elements on "steps", carved in the crystal in which the interaction occurs,6 by shifting the phases of the control electrical signals of the multi-element Converter.24,25 However, these solutions are quite technically complex. In26 shows the possibility of expanding the scanning range of AOD using only two-element piezoelectric transducer Figure 12.
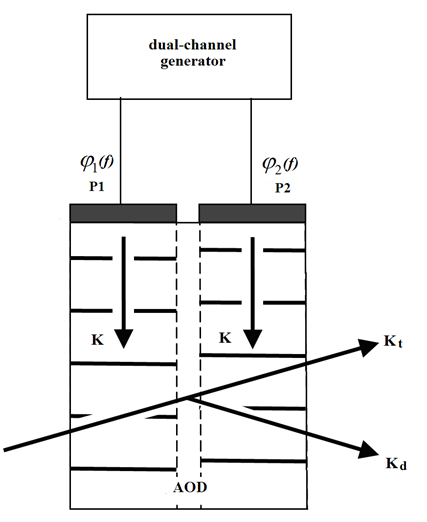
Figure 12 The scheme of the deflector with the two transducers P1 and P2. K – wave vector of sound, Kt – zero order of diffraction, Kd – diffraction order. A digital two-channel generator with a controlled phase difference of RFS depending on the frequency was used.
The measured dependences of the diffraction efficiency on the frequency are shown in Figure 13. When the piezoelectric transducer elements are excited in common mode, the maximum efficiency in the center of the frequency band drops to 87% and the frequency band is 15 MHz. When controlling the phase difference between the converters, the frequency band expanded to 31 MHz, which is twice the bandwidth in common mode, with the diffraction efficiency of 95%.
Two-crystal deflector circuit
The use of an optical circuit with two series-connected AO crystals allows to expand the functionality of the deflectors.
Deflector of nonpolarized laser radiation
A significant part of high-power industrial lasers are nonpolarized, which poses the problem of effective control of such lasers. A TeO2 - based single-crystal deflector with single act diffraction cannot, in principle, provide a diffraction efficiency of more than 50%. A number of works are devoted to this problem.27–31 The two-crystal scheme allows to create a polarization-insensitive deflector on TeO2 with potential efficiency up to 100%.32,33 For Figure 14 shows a vector diagram using two AOD.
The Figure 14 shows only the angular coordinates, the spatial position of the rays - conditional. Input nonpolarized optical radiation are presented in the form of two orthogonal polarized modes K0 and Ke. In АОД1 optical fashion Ke is diffracted on the acoustic wave, q1 forming the diffraction field K0d. After the phase plate PP°/2 rays K0 and K0d to change the polarization by 90o to form the rays Ke and Kd. In АОД2 fashion Ke is diffracted on the acoustic wave q2 with the formation of the field K0d.

Figure 14 Vector diagram of polarization-insensitive deflector consisting of two deflectors AOD1 and AOD2.
The picture of the base unit is shown in Figure 15. For Figure 16 shows the double-crystal scheme with a larger AOD scan field. AOD 1 – first AO deflector, AOD 2 – second, PP – half-wave phase plate, Optical beams: I – input unpolarized beam, I1 – diffraction field of the first deflector, I2 – second, the boundaries of the angular sectors "touch", DG two-channel digital generator.
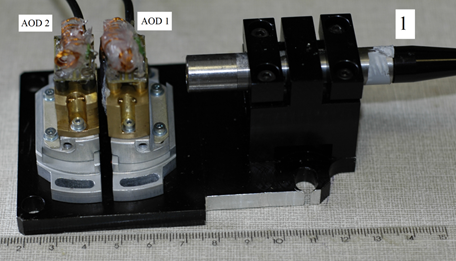
Figure 15 The appearance of the vent. Scale ruler – cm. 1 collimator of nonpolarized fiber laser, AOD 1 and AOD 2, first and second deflectors. The phase plate λ/2 is located between the crystals.
The operation of the deflectors is independent of one another. The first AOD is made with an angle and the second − with As a result, the first and second AODs have different Central frequencies: for MHz, for MHz and, consequently, different angular scanning sectors see Figure 3. For Figure 17 the results of measurements of the frequency dependence of the diffraction efficiency for the first “high-frequency” and the second “low-frequency” deflectors are presented.

Figure 17 The results of measurements of the frequency dependence of the diffraction efficiency of a two-crystal deflector.
The total frequency range is determined by the selected value of the minimum diffraction efficiency which will set at 70%, then in the frequency range 16-25 MHz (point A) scanning sector is provided by the first deflector, and to the final frequency 48 MHz - the second. This gives a total bandwidth of 32 MHz and a total scanning angle of 50 mrad. A two-crystal deflector consisting of two identical AOD deflectors mounted at the same angles to the input beam is shown in Figure 18. The frequency range of RS governing the same field and diffraction Φ scan of a single to two ADP. One pixel is affected by the radiation of both deflectors and since the polarization of the rays is orthogonal, there are no interference effects.
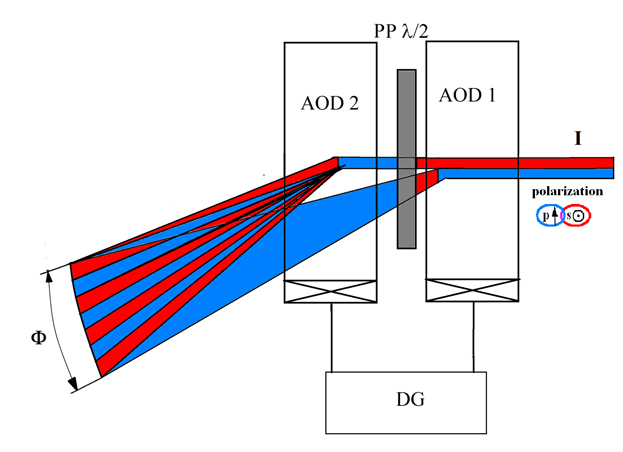
Figure 18 Diffraction of no polarized radiation by a two-crystal deflector with AO identical deflectors.
Deflector with Bragg angle adjustment
The two-crystal AOD can significantly extend the angular scanning range while maintaining high diffraction efficiency. The optical scheme is shown in Figure 19.34 The frequency of the first deflector changes synchronously with the frequency of the second one and is set (adjusted) so that the condition is fulfilled for the second deflector at each frequency. A fiber laser with linear polarization was used. The measurement results are shown in Figure 20.
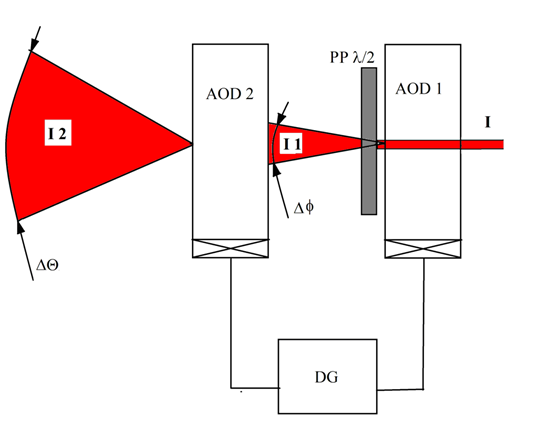
Figure 19 The basic optical scheme of the deflector. Optical beams: I – input polarized radiation, I1 – angular field at the output of the first deflector Δ, I2 – angular field at the exit of the second deflector Δθ.
Adjusting the angle of incidence allowed to maintain the total efficiency of about 90% in the entire frequency range – 32 MHz. At the same time, the frequency deviation on the first deflector did not exceed 4 MHz, which ensured its efficiency at the level of 95%.
Of the measured frequency values and diffraction parameters (speed of sound in TeO2 is 0.65×106 mm/s, wavelength of light 1 µm) absolute deviation angles: on the first deflector Δθ=6 mrad, on the second ΔF=50 mrad, For comparison, the parameters of modern functionally similar deflector company Gooch & Housego, model MD035-3S2B53-5-6.5 DEG: AO crystal TeO2;
Thus, the advantages of the proposed deflectors are obvious.
Examples of the use of deflectors
System laser the manufacture of flexography form
The system is designed for direct automatic production of printed forms of offset, high or deep printing, as well as photo forms by engraving through the action of high-power laser radiation on the form or photographic material. The digital technology of manufacturing flexography forms is called LAMS-technology—Laser Abatable Mask, which means "mask removed by laser". The digital photopolymer plate differs from the analog one by the presence of a thin (several microns) opaque black layer–a LAMS mask on its surface. Laser beam with a wavelength of 1.06μm engraver removes the mask in places where the printed elements should be formed. Today, the digital photopolymer forms are the only long-term solution to improving the standards of flexography printing. The Firm "Alpha" (Moscow, Russia) is designed and produced such equipment. Figure 21 shows the schematic diagram of a laser engraver.
Unpolarized radiation of a high-power continuous-wave fiber laser (power up to 50 W) M2<1.05 is directed to a two-crystal AOD corresponding to item 3.1. which forms a line of points - the X coordinate and the method of multiple-beam diffraction (item.2.2), the rotation of the drum scan image - the Y coordinate. AOD beams have orthogonal polarization and alternate, which is:
Switch-multiplexer of fiber-optic channels
Principle of operation
The development of fiber-optic (FO) communication systems poses the problem of improving optical switching means: switches, switches, multiplexers.35,36 AOD is the basis in the system of the switch-multiplexer (SM) of FO channels with the algorithm of switching channels 1 x N.37,38 The principle of operation of the SM is shown in Figure 22. In comparison with the single-coordinate scheme, the number of output channels in the aircraft square increases with the use of two-coordinate AOD Figure 23. An example of a two-dimensional light intensity distribution in the plane of the output matrix is shown in Figure 24. The rays directed at the matrix are painted over. On the axes in the same form shows some combinations of rays created by each AOD separately. The following multiplication options are shown:
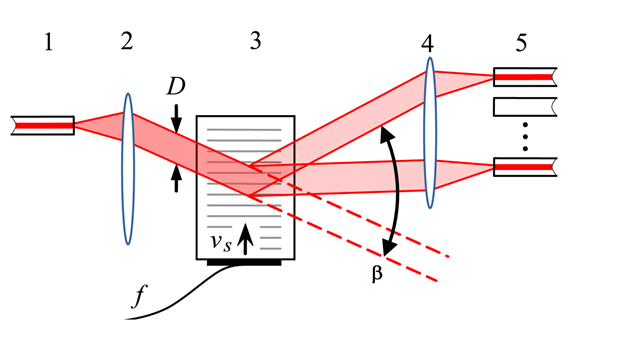
Figure 22 The principle of operation of SM. The light from the input of FO 1 enters the collimating system 2 with an aperture D at the output. The deflected beam is focused by the lens 4 on the output line of the OF 5.
The main parameters, design of switch-multiplexer
The main interrelated parameters of the AOCM (calculated for single-mode aircraft, l=1.55 µm): the speed (switching time) τ and the number of channels N, which are in a compromise relationship with each other. Thus, increasing N reduces the performance. Let us estimate their numerical values. The aperture D is chosen from τ - the time in which the acoustic wave passes a given aperture of light:
(8)
The operating frequency range of practical deflectors is in the range of 15 – 30 MHz. Thus, for D=4 mm. and ∆f= 20 MHz we obtain Nm ~120 when the sun is placed one from the other at a distance corresponding to the Rayleigh criterion. One of the limitations of the number of channels is the density of the aircraft packaging in the matrix, which is limited, firstly, technologically, and, secondly, by the "parasitic" penetration of light into neighboring channels. The magnitude of penetration is determined by the packing density of the sun in the matrix, i.e. the ratio of the distance between adjacent fibers R to the diameter of the light-guiding cores of the fiber d Figure 25.
The speed, frequency band of the AOD and the density of the packaging of the aircraft in the matrix determine the maximum number of channels:
(9)
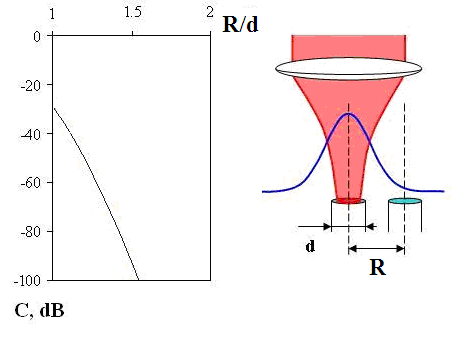
Figure 25 The dependence of the value of parasitic illumination C on R/d when entering the Gaussian beam into the FO.
The matrix made by FO consisted of 19 single-mode FO (core diameter of 10 µm of the shell 125 µm), mounted in the FC-PC connector with hexagonal packing (R/d≈12). After gluing the optical fibers into the connector, the ends were optically polished. The layout of the aircraft in the matrix and their numbering is shown in Figure 26.
The appearance of the SM is shown in Figure 27.
Device settings:
Figure 28 represents the experimentally measured value of the junction between the 8th channel of the aircraft (it was supplied with light) and other channels.
For nearby aircraft (numbers 2,3,5,6) the junction is in the range from -45 to -55 dB, and for peripheral aircraft the value is not less than 60 dB. It can be concluded that this degree of packaging of the aircraft in the matrix with a ratio R/d=12.5 provides channel isolation of at least 45 dB.
The addition of power of pulse lasers are mutually incoherent
The addition of facilities of the same type (identical) laser sources in the single channel interesting and technically important. Conditions of the problem to be solved: the sources are incoherent, the output beam power is equal to the sum of the initial sources power, angular and coordinate characteristics are equivalent to the input beam. The addition based on the AOD is based on the time compaction when the "silence" time of the first laser is filled with subsequent ones.39 AOD operates in the "reverse" mode – does not switch the light of one direction in several, and combines the rays from several multidirectional sources in one channel. The validity of this is based on the fundamental physical principle – optical reciprocity of effect of AO. At the same time, all theoretical calculations and technical parameters for the deflector are similar and applicable to the AOD as the summer. Used, SM described in section 4.2., all illustrations of which correspond to this section with the replacement of the input channels on the output. We will consider single-mode lasers with aircraft. The addition scheme is shown in Figure 29. The principle of operation is shown in Figure 30.
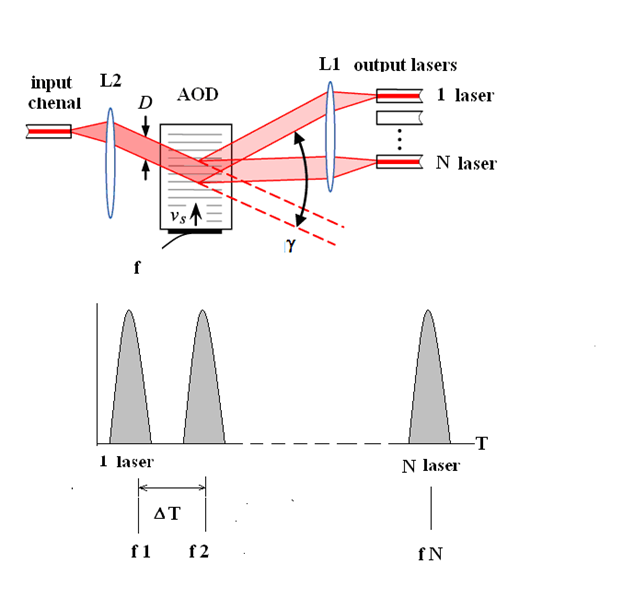
Figure 29 Illustration of the principle of AO addition of the pulse lasers power. Lens L1 output rays collimated to a diameter D and sent to the AOD, the output of which is a lens L2, focusing the light into the end of the input FO.
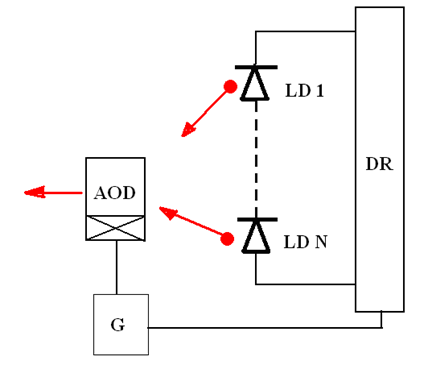
Figure 30 Schematic diagram of the AO addition. The LD1 - LDN laser sources are controlled by the DR processor and are switched on alternately with a time shift ΔT, which provides a temporary separation of pulses.
The sequential activation of the lasers is synchronized by the generator G, which controls the operation of the AOD. Each laser has its own RFS frequency value, such that the diffracted beam is directed to the corresponding input FO. The experiments were carried out with three single-mode pulsed laser diodes FPL-1310-8DL-2, the output power of each 2 mW, wavelength 1.3 µm. For Figure 31 shows an electronic photograph of the signal at the adder output. To illustrate the effect of addition, the amplitude and pulse duration of each laser were set different. The distance between the pulses of 10 µs, in this case, is chosen so that the speed of the AOD (6 µs) provides frequency switching. Note that AOD can control high-power laser radiation, the result of addition can be very significant.
Control of the energy profile of the laser radiation
The problem to be solved is related to the fact that in laser material processing systems - cutting, marking, welding, etc. the normal (Gaussian) angular distribution of the laser radiation intensity is not optimal. For Figure 32 shows the normalized Gaussian angular distribution – a continuous curve 1 and a threshold – line 2, below which the desired effect (evaporation, combustion) on the material does not occur.
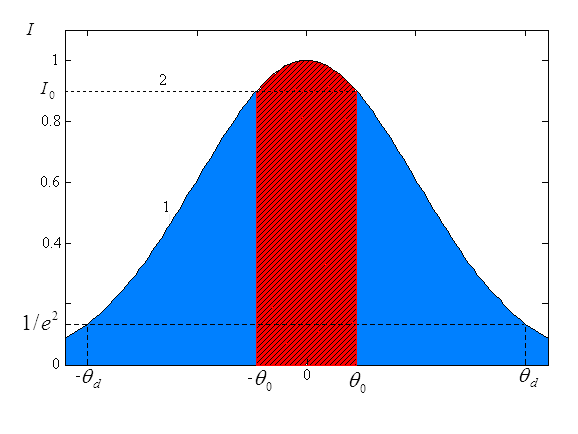
Figure 32 The energy sector used is the red part according to the level 0.9. Θ – normalized angles, I – relative light intensity.
Assume that the energy threshold of impact (ETI) of the processed material is equal to the level I0=0.9, the Ratio of the area of the shaded part (useful power) to the entire area under the curve (full power) is ≈35%, and more than 60% of the energy flow is not used. For effective use of laser power is appropriate, light with ETI kind of like a flat, and in some cases more complex. For Figure 33 shows one of the industrial shapers.

Figure 33 πShaper 12_12_355. The device contains several specially manufactured and arranged lenses. Initially, the Gaussian laser beam is transformed into radiation with a given invariable ETI close to the rectangular one.
AO shaper allows you to quickly change the ETI parameters of the output beam. The basis for the creation of the device was multipath AO diffraction appeared multibeam AO diffraction (item 2.2.). As it was mentioned, the ratio of the modulation period T to the time when the sound crosses the aperture of light τ determines the degree of overlap of the rays. In this case, it is used that at there is an angular overlap of neighboring rays with the formation of a single beam, Figure 5. The magnitude of the amplitudes and phase values determine the shape of the final beam, in particular, rectangular view. Note a significant fact - the term single beam is correct only if you do not take into account the interference (beating) that occurs in the areas of overlap of neighboring rays. The beat frequency is equal to the difference in the frequencies of the nearest electrical signals (in the experimental conditions - 0.3.MHz). In most of the number of practical cases associated with laser processing of materials, the displacement of the beam, or material "from point to point" does not exceed a dozen milliseconds. With this averaging, the term single beam is quite legitimate. For the measurements we used the experimental setup Figure 6. The specified form of the beam obtained with the iterative matched amplitude and phase of each frequency components on the criterion of achieving at maximum intensity.
Figure 34A,34B) is a series of dependences of the relative intensity of laser radiation on the type of control signals is presented. In metal powder sintering systems, for example, in 3-D printers, not a flat profile is more acceptable, but with a failure in the center of the radiation distribution. Figure 34(C) represents the result when a profile with a failure in the center of the distribution was specified. This profile is preferable when processing metals, when the heating in the center of the beam is excessive, and the perimeter is insufficient. The results of the experiment can be summarized that the effect of multipath AO diffraction allows to realize the type of laser radiation as close to the kind of like a flat, and other forms with a total efficiency of not less than 85-90 %. The principal advantage of the method is the possibility of rapid changes in the energy form of the output beam. The speed is determined by the speed of sound in the AO crystal and the aperture of light, in an experiment of about 10 µs.
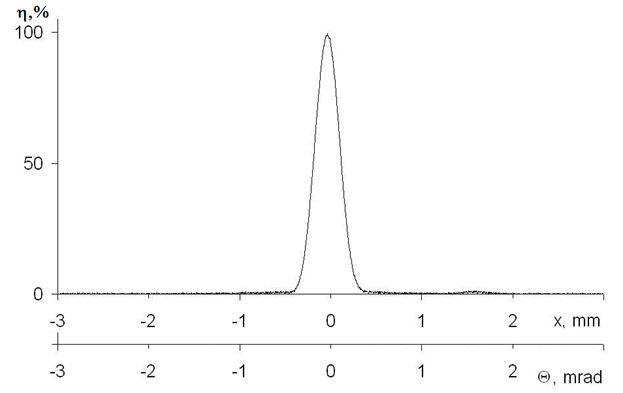
Figure 34A The intensity distribution of the diffracted field at one control frequency - 41 MHz. X - the size of the beam on the profile meter, Θ – recalculated angular dependence at the output of the AOD.
None.
None.
The author declares there is no conflict of interest.

©2019 Antonov, et al. This is an open access article distributed under the terms of the, which permits unrestricted use, distribution, and build upon your work non-commercially.