eISSN: 2576-4543


Research Article Volume 2 Issue 5
International Arctic Research Center, University of Alaska Fairbanks, Alaska, USA
Correspondence: Syun-Ichi Akasofu, International Arctic Research Center, University of Alaska Fairbanks, PO Box?757340 930, Koyukuk Dr. 415, Akasofu bldg Fairbanks, Alaska 99775 7340, USA, Tel 9074 7460 12
Received: August 31, 2018 | Published: September 17, 2018
Citation: Akasofu SI. A new consideration on the formation of sunspots. Phys Astron Int J. 2018;2(5):408-418. DOI: 10.15406/paij.2018.02.00118
It is accepted that sunspots occur when a magnetic flux tube rises above the photosphere, forming a pair of positive and negative spots at the cross–sections. However, this model has at least three long–standing problems, which contradict with the model, but have been left behind for a long time. They are: (1) the presence of magnetic monopole–like single spots, (2) the delay of the appearance of f–spots after p–spots, (3) the flux unbalance between p–and f–spots. Further, there are two newer observations to solve. They are: (4) positive single spots tend to be present in positive unipolar magnetic regions (vice versa); (5) pairs of spots tend to be present at the boundary unipolar magnetic regions, not elsewhere. The aim of this paper is to suggest that the five problems (1–5) may be explainable all together by considering: (a) the unipolar (positive and negative) magnetic regions are one of the basic structures generated by the internal solar dynamo, not just remnants of old active regions; (b) single positive spots (unipolar magnetic spots) are the basic unit of sunspots and are born in a positive unipolar magnetic region (vice versa), and (c) a p–spot induces a f–spot across the boundary of two unipolar magnetic regions, forming pairs of spots (positive p–spots in positive unipolar regions and negative f–spots in the negative unipolar regions).
Keywords: magnetic flux tube, photosphere, unipolar magnetic regions, single positive spots, pairs of spots
The formation of sunspots has been considered by many researchers in the past. After the discovery of magnetic fields in sunspots by George E. Hale, magnetic fields of sunspots have become one of the main issues of sunspots. Early studies of the formation of sunspots are summarized by Abetti,1 Cowling2, Kiepenheuer3; de Jager4; Menzel5, Bray and Loughhead6. A recent comprehensive review on sunspots was made by Solanki7.
Among a few proposed theories, the rising magnetic flux tube model by Babcock8 has long been accepted as a unique model in considering the formation of sunspots (hereafter, this model is referred as the RF model). In the model, sunspots appear as a pair of positive and negative spots as a magnetic flux tube breaks through the photospheric surface at two pointst Thus, a pair of positive and negative forms the basic unit. In spite of a great observational and theoretical progress in studying sunspots during the last few decades, these studies have essentially based on the RF model.
Thus, a few long–standing problems, which are contradictory with the RF model, have remained unsolved until now. They are:
In addition, there are two more recent observations, which are not easily be explained in McIntosh9; see also Akasofu10,11: They are:
Fortunately, the new efforts of attempting to understanding the observations (4, 5) have provided important hints to study the above three problems (1, 2, 3).
The purpose of this paper is to suggest that the five problems (1–5) may be explainable all together by considering: (a) unipolar magnetic fields are one of the basic features in solar magnetism related to the solar internal dynamo, not just remnants of old active regions, (b) single spots are the basic unit of sunspots, not pairs of spots. (c) a spot induces a f–spot across the boundary of two unipolar magnetic fields (of the opposite polarity). This work is mostly based on the magnetic data based on the Kitt Peak Solar observatory
Morphology
Before examining the formation of sunspots, it is important to remind about the distribution of magnetic fields on the photospheric surface. Figure 1 shows an example. First of all, there are weak, but large–scale positive and negative fields. They have been called “large–scale fields”,9 and are unipolar magnetic regions. Secondly, there are much smaller, but concentrated fields. They are pores and small sunspots; note that positive ones are in positive unipolar regions (vice versa). Thirdly, some of these small positive and negative fields are concentrated together near the boundary of two unipolar regions (of the opposite polarity), again positive ones are located in a positive unipolar region (vice versa).
Figure 2 shows a typical solar magnetic record in the latitude–longitude map. The region marked “1” are positive (red) and negative (blue) unipolar magnetic regions, respectively. The regions marked by “2” have pores, single spots and groups of single spots (positive and negative). A distinct group of pairs of positive and negative spots near the boundary of two unipolar magnetic regions are marked by “3”. As can be seen in later examples, this general pattern is maintained throughout the sunspot cycle, although it becomes more complex when the sun becomes active.
In Figure 2, it may be recognized: (a) groups of positive pores, single spots and groups of spots tend to be present in a positive unipolar regions, and vice versa, (b) pairs of spots tend to be present at or near one of the boundary of two unipolar regions, not in the middle of unipolar regions, and further positive spots are in a positive unipolar region (vice versa). These features can also be seen throughout sunspot cycles; Figures 5A–5E.
On the basis of Figure 1 & Figure 2, and a large number of others, including those which will be seen later), Figure 3A shows schematically the basic distribution of the unipolar regions. Positive and negative unipolar regions alternately distributed in longitude.
In this study, it is crucial to have a continuous color presentation of the magnetic fields, because all the above features have a wide and continuous range of the intensity (0–2000G) from very weak unipolar regions to most intense sunspots; The recent black–white presentation with a high resolution tends to misses the important features, which are essential in this paper; in particular, it is not easy to see the crucial relationship between the unipolar magnetic regions (which tend to have a low intensity) and sunspots; see Appendix.
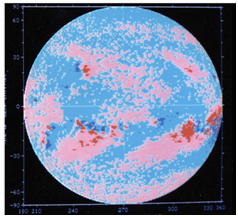
Figure 1 A typical example of the distribution of magnetic field seen on the disk of the sun (The Kitt Peak Observatory).
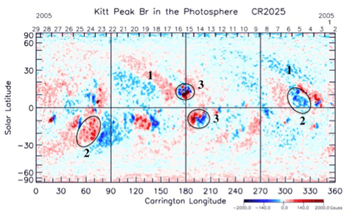
Figure 2 The distribution of the photospheric magnetic field map (longitude–latitude) during the solar rotation CR 2025. The regions marked by “1” indicate positive (red) and negative (blue) unipolar magnetic regions, respectively. The regions marked by “2” indicate pores, single spots, groups of single spots of positive and negative polarities. The region marked by “3” is the location of pairs of positive and negative pores and spots. There are also unipolar regions in the northern southern highest regions, the polar unipolar magnetic regions (The Kitt Peak Solar Observatory).
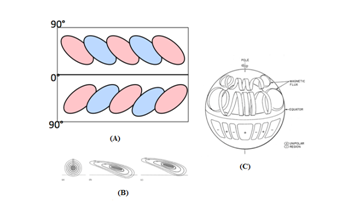
Figure 3 (A) Schematic illustration of the positive and negative unipolar regions in both hemispheres. (B) The development of an old active region.12 (C) The solar dynamo model developed by Nakagawa17. It shows magnetic fluxes in the northern hemisphere. Its photospheric fields are shown as unipolar magnetic field regions in the southern hemisphere.
Morphology
It has long been considered that unipolar magnetic regions are remnants of old active regions (Figure 3B) on the basis of a study of the sunspot cycle by Leighton12, in which active regions are elongated by the non–uniform rotation of the sun. In this section, it will be shown that unipolar regions are different from old active regions and thus they should be distinguished. Further, it is suggested that unipolar regions are one of the fundamental features of solar magnetism, which have the origin in the internal dynamo.
Latitudinal extent
One of the important features which distinguish between unipolar regions and old active regions is their difference in the latitudinal extent. Unipolar regions extend from 10° to more than 60°, and often connect to the polar unipolar regions and also connect to unipolar regions of the same polarity across the equator, while the sunspot regions extend from 0° to at most 45° as the Butterfly diagram shows. Figure 4A shows an example of their connection to both the polar and equatorial regions. This polar connection may be related to the poleward migration of unipolar magnetic regions during a certain periods13 and thus related to the reversal of the dipolar field of the sun and thus to the internal solar dynamo);14 (Figure 4B).
Development
However, an even more important difference between them is the fact that unipolar regions appear before sunspots are born in them at the early epoch of the sunspot cycle. It is unfortunate that such a fundamental importance of unipolar regions and their importance on the formation of sunspots have not been recognized in the past.
Figure 5A represents the solar magnetic field during the earliest epoch and early epoch of a new sunspot cycle. It is particularly important to note that unipolar regions just begin to appear before any sunspots appear. This indicates clearly that unipolar magnetic regions are not remnants of old active regions. This fact becomes more clear in Figure 5B; it can be seen that a pair of unipolar magnetic regions appeared most clearly without sunspots, indicating the growth of unipolar regions without sunspots and thus before the birth of spots. Thus, they cannot be remnants of old active regions.
Figure 5C shows two magnetic records of the rising and maximum epochs of the cycle. One can see that unipolar regions grow in intensity and latitudinal range (toward both higher and lower latitudes) as the cycle advances. Sunspot activities tend to distort the basic pattern of unipolar magnetic regions because of sunspot motions as the sunspot cycles advances. Figure 5D shows two records during the declining epoch of the cycle. As sunspot activities subside, the basic pattern begins to be restored.
Figure 5E shows two examples of magnetic records in the final epoch of the cycle. It is important to recognize that the unipolar regions tend to fade away in high latitudes, but remain only in the lowest latitude. Thus, a new cycle (Figures 5A & 5B) begins in high latitudes without remnants of old active regions.
Thus, in summary, as pointed out by McIntosh & Wilson15 and Wilson16, the basic unipolar magnetic regions are different from remnants of old active regions, so that unipolar magnetic regions should be distinguished from old remnants of active regions.
Based on a large number of records during more than two sunspot cycles, Figure 6 summarizes schematically the close relationship among single spots, pairs of spots and unipolar regions, including also the well–known other features of pairs of spots, such as the reversal of the polarity of spots in the northern and southern hemispheres and during the even and odd sunspot cycles, and also the p–spots are located a little equatorward of f–spots.11 In the following, it will be shown that unipolar magnetic regions have a crucial importance in explaining the five problems (1–5).
Model
Based on the observed facts in Section 2.1, it can be said that the unipolar magnetic regions are important in reconsidering morphology of sunspots and that the unipolar regions seem to have the origin in the internal dynamo. Thus, it is worthwhile to refer here to the internal dynamo models of solar magnetism. Among many internal dynamo models, the theoretical model developed by Nakagawa17 considers specifically the origin of positive and negative unipolar regions as shown in Figure 3C: he noted: “The unipolar regions in Figure 1 are identified with the variations of the magnetic field near the surface, so that the flux coil which appeared near the surface is identified as one polarity, while the submerged region is the opposite polarity.”
Summary
In summary, the fact that the latitudinal extent and growth during the sunspot cycle, together with the fact that unipolar regions can be connected to the polar unipolar regions, as well as Nakawawa’s internal dynamo model, suggest that unipolar magnetic regions are one of the basic features in solar magnetism related to the internal dynamo. Thus, unipolar magnetic regions are different from remnants of old active regions,15,16 so that they should be distinguished from old remnants of active regions.
Further, as shown in the next section, positive single spots appear in a positive unipolar region (vice versa), so that positive unipolar regions are the birth place of positive single spots (vice versa). This interpretation of unipolar magnetic regions is crucial in explaining the problems (1–5) mentioned in Section 1.
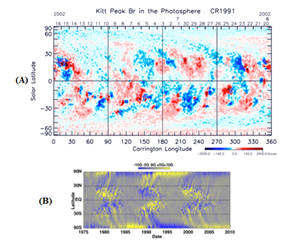
Figure 4 (A) Unipolar regions are often connected to both the polar unipolar regions and also across the equator. (B) The migration of middle latitude magnetic fields to the polar unipolar magnetic regions.13
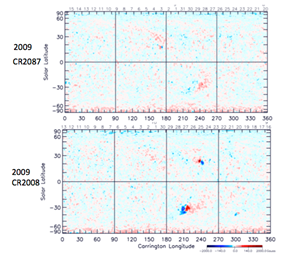
Figure 5A Two solar magnetic records during the earliest epoch of the solar cycle. They show the birth of newly developed unipolar regions.
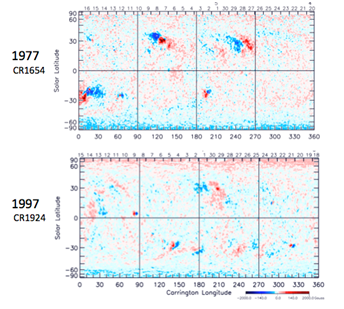
Figure 5B Two magnetic records during an early epoch of the cycle. Compared with Figure 5A, one can see clearly the development of unipolar regions
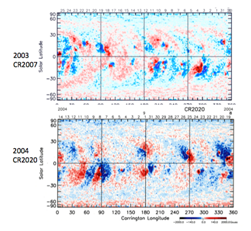
Figure 5D Two magnetic records of the declining epoch of the cycle. The general features pointed out in Figure 1 can be recognized.

Figure 5E Two magnetic records during a very late epoch of the cycle. It may be noted that compared with Figures 5C and 5D, unipolar regions became very weak and are almost faded away.

Figure 5F Assembly of the available information regarding, single spots, sunspot pairs and their relationship among positive and negative unipolar regions, for both even and odd cycles.11 Other known facts, such are the reversal of the polarity with respect the equator and sunspot cycle are also included.
Pores and single spots
Although single magnetic monopole–like spots (or often called ‘unipolar’, ‘isolated’ or ‘independent’ spots) are illustrated in many books or review papers,1,6,7,18 they have not been considered in recent years.
A figure 6 shows two examples of a single spot. Since sunspots must appear as a pair of positive and negative spots in the RF model, the presence of single, isolated or independent spots has long been a puzzle, in addition to the fact that magnetic mono–poles cannot exist. Single spots we study here should not be confused with some of scattered single spots in old active regions during a late phase of active sunspot groups, theclassification in Bray & Loughhead6; they will be referred later.
Since magnetic monopoles cannot exist, we try to consider the formation of single pours and spots as a local phenomenon within unipolar magnetic regions, namely a positive single spot occurs in a positive unipolar region (vice versa). The clue for this consideration is the observation (4) that positive single spots appear in a positive unipolar region (vice versa).
Figures 7A & 7B show two high resolution images of a single spot. They show that a single spot consists of several pores or small spots,19 which indicate that a single spot is an assembly of several small spots, not a simple column of magnetic flux. There is a possibility that spots may be disassembled small spots, rather that disintegration of a single column of the flux tube.
Before examining the formation of sunspots in unipolar magnetic regions, we examine unipolar magnetic regions with a high resolution image. Figure 8 shows an example, which may be compared with Figure 1. It can be seen that the high resolution image of unipolar magnetic regions shows a magnetic network structure. It has been considered that the network structure is formed by the convective flow in each cell, in which flows continuously sweep magnetic fields to its boundary and send them down.
It has also been considered that some irregularities in the convection flow tend to accumulate the magnetic fields at a few locations more than other places along the boundary. This feature is schematically illustrated in Figure 9 by combining two convective cell structures (in a negative unipolar region) constructed by Clark and Johnson20.
In the left hand side of Figure 9, pores thus formed are assembled along the cell boundary to form small spots. Their assembly forms larger spots, as shown in the right hand side of Figure 9. This process is morphologically called ‘coalescence’.9 It is likely that the single spots in Figure 7A and 7B resulted from this process of coalescence. Parker21 suggested one possible way of the coalescence by assuming that small spots have vortex motions.
Thus, in a positive unipolar magnetic region in active areas, several positive pores might form a positive small single spot by their coalescence, and eventually a positive single spot by the coalescence of small spots as shown in Figure 7A & 7B.
Therefore, the fact that positive monopole–like single spots are produced by the coalescence within a positive unipolar region (vice versa) can satisfy the condition of , so long as unipolar magnetic regions are a product of the solar internal dynamo, as discussed in Section 2.
In summary, the fact that a positive unipolar region is the birth place of a positive single spot (vice versa), not elsewhere, has advanced toward our understanding of this single spot formation. Therefore, the problem (1) and observation (4) may be explained in this way.
This point will become more important in considering a pair of spots. In the next section, it will be shown that the above–mentioned process occurs at the boundary of a positive and a negative unipolar magnetic region of the opposite polarity, forming a pairs of spots.
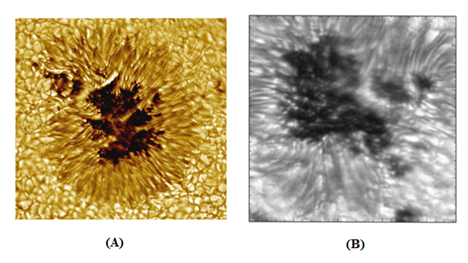
Figure 7 (A) and (B) are two high resolution images of a single spot, which show that a single spot consists of smaller spots, not a single column of magnetic flux; (a) Tritschler and Schmidt19 (b) NASA Image collection. (c) A schematic illustration of two convection cells in a negative unipolar region; it combine two of the convection cell simulated by Clark and Johnson20.

Figure 9 The figure illustrates schematically how pours, small spots and larger spots may be formed along the cell boundary. Left: A schematic illustration of the formation of pores by combining two convection cells in a negative unipolar region (blue), which is simulated by Clark and Johnson20. Right: A schematic illustration of the formation of a single spot by the coalescence of pores and small spots.
Various ideas of the formation of pairs of spots before Babcock8 was mentioned by Cowling8. After Babcock’s paper, a large number of observations have been published by supporting the RF model.22 Although Getling23 showed recently that their observations do not support the RF model, we still face the problems (2, 3, 5) unsolved today. Now, the problem (1, 4) may now find its possible explanation in Section 3. In this section, it is suggested that this explanation of the problem (1) may be quite important in considering the problems (2 and 3). Actually, the problem 5 gives us some hint in considering the remaining problems.
Formation of a pair of spots
Importance of the boundary of two unipolar regions
If magnetic buoyancy (or an upward flow) is the only reason for the rise of a magnetic flux tube in the RF model, a pair of positive and negative spots may appear together randomly at any location on the photosphere, even in the middle of unipolar regions. This is not the case. Thus, this is a serious problem for the RF model.
In considering the pair formation, we learned that a sunspot pair appears across the boundary of positive and negative unipolar regions, and further positive one in a positive unipolar region (and vice versa).9–11 Thus, the boundary of two unipolar regions is a crucial fact in considering the pair formation; actually, this is collateral and consistent with the fact mentioned in Section 3, in that positive spots of the pair appear in a positive unipolar region (vice versa).
Thus, as we discuss later the delay of appearance of f–spots, there is a possibility that a positive p–spot in a positive unipolar magnetic region may induce a negative f–spot in a negative unipolar region across the boundary (vice versa), if a positive and a negative unipolar magnetic regions develop the connection by magnetic field lines.
McIntosh9 described morphologically the development of sunspot pairs in great details. He emphasized particularly the fact that a pair of sunspots develops along an elliptical cell–like structure of the size of . Figure 10 is an example of the elliptical formation of sunspot pairs; note that as Figure 10 shows, larger spots consist of coalesced smaller spots. Many examples of the elliptical structure are shown in his paper, so that this elliptical formation is a typical way by which a spot pair develops. This is another fact which is not easy to explain by the RF model.
Figures 11 shows a higher resolution image around the boundary of a positive and negative unipolar regions.
Around the boundary of the positive and negative unipolar magnetic regions, one can see several U–shaped structures (lying horizontally), positive ones in a positive unipolar region (vice versa). At the boundary region, the convection flow appears to produce such magnetically split structures, namely positive and negative half–cells in terms of the polarity of the magnetic field. Figure 10 shows schematically a combination of positive and negative U–shaped structures at the boundary.
If one of a positive U–shaped half–cell in the positive unipolar region at the boundary can induce the coalescence in a negative U–shaped structure, which is connected by magnetic field lines, two U–shaped structures of the opposite sign can form a pair of spots along the elliptical boundary. Figure 12 shows schematically how positive and negative U–shaped cells at the boundary form a pair of spots by combining the cell structure simulated by Clark & Johnson20. This is one way by which McIntosh’s elliptical structure of a pair of spots can be explained. This inducing process will be discussed further in Sections 4.3 and 4.43a8. It may be the reason why a pair of spots tends to appear at the boundary of two unipolar magnetic region of the opposite polarity.
Positive pores and small spots may coalesce along the positive U–shaped structure (which is a half of the boundary of a cell) to form a small positive single spots and further eventually a larger single spot (or spots) and vice versa. Eventually, spots in a positive U–shaped structure coalesce at its end and spots in a negative U–shaped structure coalesce at the end, forming a typical pair of spots, which consists simply of a pair of positive and negative spots. Figure 13 shows this transition and development. A number of such examples are shown by McIntosh9. Note that as mentioned earlier, both spots consist of many smaller spots.
Delay of f–spots
According to the RF model, a p–spot and f–spot should appear simultaneously. However, it has long been known that a pair of spots does not appear at the same time; as so named, p (primary) spots appear earlier than f (following) spots.3,4 There are only a few cases, in which f–spots appear first, so that such cases are rare.9
Thus, this delay of f–spot is indeed an important fact in considering the pair formation. In Figure 10, p–spots (the right hand side) appeared first, and this pair developed in a period of less than 5 hours as a very faint elliptical form; because of its faintness, the elliptical structure (the cell boundary) may not be easily recognized, so that it may be seen only as two (p and f ) spots.
In the past, on the basis of the RF model, various attempts (such as the look–angle of the tube or branching of a tube below the photospheric surface) were made to explain the delay of the appearance of f–spots after p–spots, but those ideas cannot be confirmed by observations below the photospheric surface. The present way of explaining single spots and pairs of spots based on the observed features provides an opportunity to consider this problem which is contradictory to the RF model (thus, the problem cannot be explained without hypothesizing processes which cannot be proven at this time).
This inducing effect is possible, if some portions of positive and negative unipolar regions are connected by magnetic field lines. The formation of a p–side of the U–shaped half–cell could be communicated to f–side of U–shaped half–cell, because magnetic field lines are expected to be nearly equi–potential in the solar atmosphere, so that any electromagnetic changes associated with the coalescence (e.g. a converging flow , ) in a p–side U will be communicated to a f–side U by Alfven waves, inducing a similar coalescence at the other end of the magnetic field lines, namely the formation of f–spots of the opposite polarity.
Thus, some delay might be expected as the communication time. This might be a possible explanation on the problem (2). In this respect, it may be noted that Kotov24 showed that there is 1012A of electric currents around a single spot, since it can be caused by the process (Figure 14). It is in this way that the problem (5) provides an opportunity to discuss the delay, because the RF model does not allow the delay.
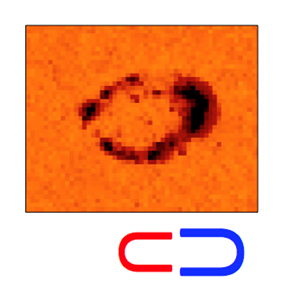
Figure 10 An example of a well developed pair of sunspots on October 27, 2003, showing the development of a pair of spots along an elliptical cell–like structure (Courtesy of the Kitt Peak Solar Observatory). In this spot pair, a large spot on the right side is negative, and spots on the left side are positive. It can be seen that the large negative spot may consists of several small spots. There is also a difference of the size between the two spots, which will be discussed in Section 4.4. For the blue and red U–shaped structures, see the text in the following.
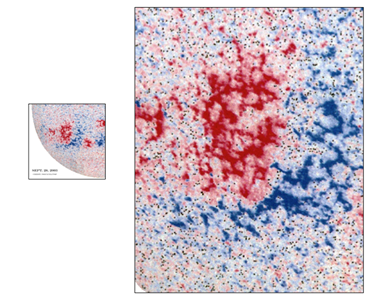
Figure 11 They show the magnetic network structure near the boundary of two unipolar magnetic regions, September 28, 2003 (Courtesy of the Kitts Peak Observatory). It is crucial to note that there are positive (red) and negative (blue) U–shaped structures near the boundary.
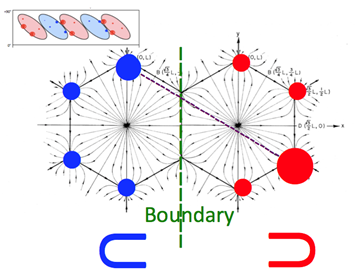
Figure 12 Schematic illustration of the magnetic network near the boundary of two unipolar magnetic regions, showing a pair of negative (blue) and positive (positive) U–shaped structures. It is likely that McIntosh’s elliptical formation of a pair of spots may develop by connecting two U–shaped structures of the opposite polarity. One magnetic field line is shown to connect a large positive and negative spots. Upper left: A portion of Figure 6. Middle: The convective cells at the boundary. Positive and negative cells are combined at the boundary. The network structure at the boundary is thus different from that shown in Figure 9. Bottom: Two U–shaped structure shown in Figure 10.
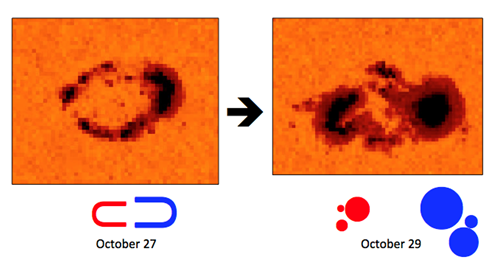
Figure 13 Transition from an elliptical formation of small spots to a simplified typical pair of sunspots, which are actually consisted of several smaller spots. The elliptical formation is produced by combination of two U–shaped formation.
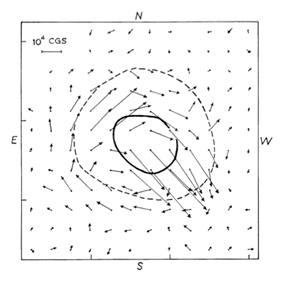
Figure 14 The electric current distribution around a single spot.24

Figure 15 (A) The photospheric magnetic field distribution, in which five sunspot pairs are seen; the magnetic equator crosses the middle of the record horizontally. (B) The corresponding X–ray image of the corona. Some spot pairs are connected each other even across the magnetic equator.25
Any idea of spot formation must explain the equatorward shift during the sunspot cycle. There are a number of dynamo theories on the Butterfly diagram, explaining the equatorward shift of the formation of sunspot pairs during the sunspot cycle. Since we are considering only morphologically the formation of sunspots in this paper, it may be noted that there is an interesting observation which shows that an east–west belt of ‘torsional oscillation’ (rotation or anti–parallel flow) on the photosphere shifts from poleward to equatorward during each sunspot cycle;28 Figure 16. McIntosh9 showed that there is a counter flow along such a belt and that solar activities are high certain locations along the belt. How such a dynamical belt can stimulate the formation or coalescence of spots at the specific boundary of two unipolar regions is beyond the scope of this paper.
In this respect, McIntosh9 noted that sunspots, which tend to show the Coriolis Effect, exhibit drastic spot coalescence. Since the rotation speed of the sun at the equator is about 2 km/s and plasma velocity around sunspots is only about several km/s, one does not expect much the Coriolis effect on the photosphere. However, a rare example of vertical sunspot group was reported by Akasofu29; Figure 17 shows both the vortical sunspot group and a nearby single spot. However, dynamical processes and their relation to the formation of sunspots are beyond the scope of this paper, except to mention that Parker21 considered vortex motions of small spots in cexplaining the coalescence.
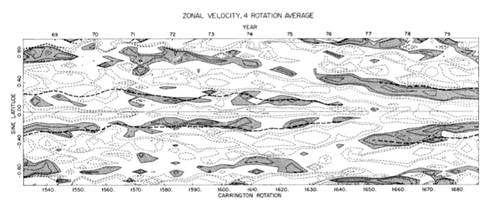
Figure 16 The equatorward shift of the east–west belt of torsional oscillation during a few solar cycles.28
Although the RF model has long been well accepted, and there are a large number of supporting observations,22 the three long–standing problems (1–3) and two new observations (4) and (5) seem to be difficult to explain, so long as we assume a rising magnetic flux tube. The present study began as an attempt to study the three (1–3) problems, but it is found to be very difficult to proceed on the basis of a simple RF model, since they are obviously contradictory to the RF model. Fortunately, the newer problems (4, 5) provided a hint in considering the problem (1, 2, 3) and further all of them together.
This paper is the full paper of a paper published earlier as a short report.30 It is hoped that this paper will initiate even more new ideas in considering the formation of sunspots in the future. It is suggested that the following points should further confirmed morphologically and theoretically, regardless of any theory.
The author would like to acknowledge Dr. Kees de Jager for his comments on drafts of this paper. He would like to acknowledge also the Kitt Peak Solar Observatory, the Big Bear Solar Observatory and the NASA Image Collection for their magnetic records and spot images used in this paper.
Author declares that there is no conflict of interest.

©2018 Akasofu. This is an open access article distributed under the terms of the, which permits unrestricted use, distribution, and build upon your work non-commercially.