MOJ
eISSN: 2374-6939


Research Article Volume 18 Issue 2
 Oleksandra Y Malysheva,2 Vadim V Verbov,3 Tetiana А Malysheva4
1Department of spinal neurosurgery, Romodanov Neurosurgery Institute of National Academy of Medical Sciences of Ukraine
2International Relations Unit, Romodanov Neurosurgery Institute of National Academy of Medical Sciences of Ukraine
3Department of Restorative Neurosurgery, Romodanov Neurosurgery Institute of National Academy of Medical Sciences of Ukraine
4Department of Neuropathomorphology, Romodanov Neurosurgery Institute of National Academy of Medical Sciences of Ukraine
Correspondence: Oleksii S Nekhlopochyn, Department of spinal neurosurgery, Romodanov Neurosurgery Institute of National Academy of Medical Sciences of Ukraine, Tel +380 44 483- 94-13
Received: December 04, 2026 | Published: May 1, 2026
Citation: Nekhlopochyn OS, Malysheva OY, Verbov VV, et al. Prediction of posterior ligamentous complex injury in AO spine type A3–A4 fractures of the thoracolumbar junction using CT morphometry. MOJ Orthop Rheumatol. 2026;18(2):75-84. DOI: 10.15406/mojor.2026.18.00744
Introduction: The integrity of the posterior ligamentous complex (PLC) is a key determinant of spinal stability and treatment strategy in AO Spine A3–A4 burst fractures of the thoracolumbar junction. While MRI remains the reference standard for PLC assessment, its availability in the acute trauma setting is frequently limited, necessitating CT-based diagnostic approaches. The aim of the study was to develop and internally validate a quantitative CT-based prognostic model for PLC injury in AO Spine A3–A4 thoracolumbar junction fractures and to translate it into a clinically applicable point-based score and nomogram.
Material and methods: A retrospective observational study included 47 patients with AO Spine A3 (n = 13) or A4 (n = 34) fractures at the Th11–L2 level who underwent both CT and MRI in the acute post-traumatic period. PLC status verified by MRI and/or intraoperative findings served as the reference standard. Quantitative morphometric analysis encompassed eleven CT parameters reflecting vertebral body geometry, degree of fragmentation, and posterior structure involvement. A binary classification model was developed using extreme gradient boosting (XGBoost) and internally validated by repeated stratified 5-fold cross-validation (20 repeats). Feature importance was quantified using a composite integral weight metric. An interval-based point score and nomogram were derived from the model to enable bedside risk estimation.
Results: PLC injury was confirmed in 22 patients (46.8%). The XGBoost model achieved an in-sample AUC of 0.949 and a cross-validated AUC of 0.894. The dominant predictors were AVH ratio, A/P ratio, and the presence of free bone fragments, whereas angular parameters contributed moderately. The point-based logistic model retained high discriminative performance (AUC = 0.880) with good calibration (Brier score 0.103; slope 1.00). Each additional point on the scale was associated with a 20% increase in the odds of PLC injury (OR 1.20; 95% CI 1.14–1.27). A total score exceeding 15–18 points was identified as a threshold indicating high instability risk.
Conclusion: The developed quantitative CT-based score and nomogram enable reliable risk stratification of PLC injury in AO Spine A3–A4 fractures. The model demonstrated high predictive accuracy, biomechanical interpretability, and practical applicability in settings where MRI is unavailable. External validation in an independent prospective cohort is required before routine clinical implementation.
Keywords: thoracolumbar junction, spinal trauma, burst fractures, posterior ligamentous complex, CT morphometry, machine learning, prognostic model, nomogram
Thoracolumbar junction fractures classified as AO Spine A3–A4 represent one of the most complex and clinically significant forms of traumatic spinal injury.1 In contrast to A1–A2 compression fractures, these injuries are characterized by burst-type destruction of the vertebral body, involvement of the posterior vertebral wall, marked osseous fragmentation, and substantial redistribution of axial and flexion-related loads.2 These features determine a fundamentally different biomechanical profile of injury and are associated with a considerably increased risk of posterior ligamentous complex (PLC) disruption.3
The integrity of the PLC is a key determinant of spinal stability, the risk of subsequent deformity progression, and the choice of treatment strategy. In AO Spine A3–A4 fractures, PLC disruption often serves as a decisive argument in favor of surgical stabilization, even in the absence of pronounced neurological deficit.4 At the same time, the clinical diagnosis of PLC injury in this group of patients remains one of the most debated and methodologically challenging issues in contemporary spinal trauma care.5
Magnetic resonance imaging is traditionally regarded as the most sensitive modality for detecting injuries of spinal soft-tissue structures, including the PLC.6 However, in the setting of acute trauma, its use may be limited by several factors, including restricted availability, time delays, unstable patient condition, and logistical constraints within trauma centers. Consequently, in routine clinical practice, decision-making for A3–A4 fractures is often based primarily on computed tomography (CT), despite the absence of direct CT signs of PLC disruption.7,8
The use of CT for indirect assessment of PLC integrity relies on interpretation of morphological signs of osseous injury, such as the degree of vertebral body compression, posterior wall involvement, magnitude of local kyphosis, widening of the interspinous distance, and other secondary markers of instability. However, in high-energy burst fractures, these features often show considerable overlap between stable and unstable injuries, thereby increasing diagnostic uncertainty and interobserver variability.9
In recent years, attempts have been made to quantitatively formalize CT-based features in order to reduce subjectivity and improve the reproducibility of diagnostic decision-making. Within this framework, a quantitative model for predicting PLC injury in AO Spine A1–A2 thoracolumbar junction fractures was previously developed and validated, based on CT morphometric analysis and machine-learning methods. That model demonstrated high discriminative performance and clinical interpretability in compression-type injuries with a relatively homogeneous trauma mechanism.
However, extrapolating such models to AO Spine A3–A4 fractures is not straightforward. Burst fractures are characterized by greater variability in injury mechanisms, including combinations of axial compression, flexion, and shear components, as well as extensive disruption of the vertebral osseous framework.10 These factors may weaken or disrupt the linear relationships between individual morphometric parameters and PLC status that are more typical of A1–A2 fractures. As a result, the diagnostic value of isolated CT features may decrease, while the so-called “gray zone” of diagnostic uncertainty may expand.
Moreover, in A3–A4 fractures, the morphological manifestations of high-energy trauma may either obscure or, conversely, mimic signs of PLC injury, further complicating the clinical interpretation of CT findings.11,12 This highlights the need not only to assess the overall diagnostic performance of a predictive model, but also to analyze the characteristic patterns of its errors and the limits of its applicability in the context of high-energy spinal trauma. Therefore, the application of quantitative CT-based models in AO Spine A3–A4 fractures should not be regarded as a replacement for magnetic resonance imaging, but rather as a tool for risk stratification and reduction of diagnostic uncertainty in clinical situations where MRI is unavailable or delayed. Such an approach may support more evidence-based treatment selection and more rational use of additional diagnostic modalities.
Objective
The aim of the present study was to evaluate the applicability and robustness of a previously developed quantitative CT-based model for predicting posterior ligamentous complex injury in AO Spine A3–A4 thoracolumbar junction fractures, as well as to analyze the specific features of its diagnostic behavior, limitations, and clinical interpretability in the context of high-energy trauma.
Study design
This study was conducted as a retrospective observational study and was aimed at developing and internally evaluating a prognostic model for posterior ligamentous complex (PLC) injury in AO Spine A3–A4 thoracolumbar junction fractures. The study is methodologically linked to a previously published investigation focused on AO Spine A1–A2 fractures and uses the same predefined pool of quantitative and qualitative CT predictors, which had been selected on the basis of a structured literature review and clinical-biomechanical rationale.13
At the same time, the present study represents an independent analytical stage, since model development, feature selection, and statistical analysis were performed de novo, taking into account the fundamentally different injury mechanism and morphological heterogeneity of high-energy A3–A4 burst fractures. Unlike the previous study, the analytical stage involving a repeated literature review and construction of the CT-feature pool was not performed in the present investigation. This decision was made deliberately, as the purpose of the present stage was to reassess the diagnostic significance of already validated features under a different pathomechanical profile, rather than to identify them again.
Inclusion and exclusion criteria
The study included patients with traumatic fractures of the thoracolumbar junction (Th11–L2), classified as AO Spine A3 or A4, who underwent both computed tomography and magnetic resonance imaging in the acute post-traumatic period. The inclusion criteria were as follows: confirmed traumatic nature of the injury; AO Spine A3 or A4 fracture type; availability of diagnostic-quality CT performed in the acute period; availability of MRI allowing reliable assessment of PLC status; and patient age of 18 years or older.
The exclusion criteria were as follows: AO Spine type B or C injuries verified on CT; pathological or osteoporotic fractures; multilevel unstable spinal injuries; previous surgery at the index level; and severe artifacts or incomplete imaging data precluding accurate morphometric analysis.
Formation of the study cohort and reference standard
All included patients formed a single cohort of A3–A4 fractures, without additional stratification by subtype. This approach was chosen in order to develop a generalized model for the clinical assessment of burst fractures of the thoracolumbar junction. The status of the posterior ligamentous complex was determined on the basis of magnetic resonance imaging and was used as the reference standard. The assessment included evaluation of the integrity of the supraspinous and interspinous ligaments, ligamenta flava, and facet joint capsules. In surgically treated cases, intraoperative findings were also taken into account.
Morphometric analysis of CT images
Quantitative morphometric analysis was performed using standard sagittal, axial, and coronal CT reconstructions. The analyzed set of parameters included previously defined quantitative and qualitative CT features reflecting the degree of vertebral body deformity, spatial relationships of osseous structures, signs of fragmentation and structural destruction, and bone-density characteristics. The measurement methodology, parameter definitions, and software used corresponded to the previously described protocol. Measurements were performed by independent experts who were blinded to clinical data and PLC status. Mean values were used for quantitative variables. Reproducibility was assessed using absolute measurement error for quantitative parameters and interobserver agreement coefficients for binary features.
Development of the prognostic model
The prognostic model for PLC injury in AO Spine A3–A4 fractures was developed de novo using the full set of initial CT predictors. Although the initial feature space was identical to that used in the previous study, direct transfer of the previously developed model was not performed, since in burst fractures the high energy of trauma, pronounced fragmentation, and disruption of the posterior vertebral wall may alter the relationships between morphometric parameters and PLC status. Feature selection and construction of the final model were performed with consideration of the diagnostic informativeness of the parameters, their mutual dependence, clinical-biomechanical interpretability, and model robustness under conditions of limited sample size.
Statistical analysis
The primary outcome of the study was the presence of PLC injury (PLC+ / PLC−), determined by MRI and/or intraoperative findings. The statistical analysis was focused on evaluating the diagnostic performance of the newly developed model. Descriptive statistics and general principles of data presentation followed the previously published protocol. Model performance was assessed using receiver operating characteristic (ROC) curve analysis with calculation of the area under the curve (AUC). Sensitivity and specificity were additionally determined at a fixed classification threshold. Calibration was evaluated using calibration curves and quantitative error metrics.
A separate statistical subgroup analysis of A3 and A4 fractures was not performed. These fracture types were considered as a single cohort of high-energy burst injuries, which was consistent with the aim of the study and the available sample size.
Analysis of diagnostic limitations
A qualitative analysis of cases in which model predictions disagreed with the MRI reference standard was performed in order to identify typical scenarios of diagnostic error. Particular attention was paid to cases with pronounced multifragmentation of the vertebral body and substantial disruption of the posterior wall.
Ethical considerations
The study was conducted in accordance with the principles of the Declaration of Helsinki and was approved by the local ethics committee. Owing to the retrospective design of the study, the requirement for informed consent was waived.
Sample characteristics
At this stage of the study, a cohort of patients with AO Spine A3–A4 fractures of the thoracolumbar junction was formed. Demographic characteristics, fracture subtype distribution, and posterior ligamentous complex status according to MRI are presented in Table 1.
|
Parameter |
Value |
|
Age, years |
40 (20–63) |
|
Sex |
|
|
Male |
32 (68.1%) |
|
Female |
15 (31.9%) |
|
Injury level |
|
|
Th11 |
6 (12.8%) |
|
Th12 |
16 (34.0%) |
|
L1 |
21 (44.7%) |
|
L2 |
4 (8.5%) |
|
AO Spine vertebral body fracture type |
|
|
A3 |
13 (27.7%) |
|
A4 |
34 (72.3%) |
|
PLC injury |
|
|
Present |
22 (46.8%) |
|
Absent |
25 (53.2%) |
Table 1 Morphological characteristics of the study cohort (n = 47)
Note: Data are presented as n (%) unless otherwise specified. Age is presented as median (minimum–maximum). Percentages may not total 100% because of rounding.
CT morphometric parameters
Table 2 presents the quantitative CT parameters included in the analysis after the exclusion of duplicate and multicollinear features. Parameter selection was based on anatomical independence and diagnostic interpretability, in accordance with the previously described protocol, while taking into account the morphological characteristics of AO Spine A3–A4 fractures. Variables demonstrating functional redundancy or reflecting identical biomechanical processes were not included in the final table. Measurement reproducibility was not reassessed at this stage of the study, as it had been established previously during validation of the measurement methodology.
|
Parameter |
Median |
95% CI |
|
CA (°) |
10.7 |
7.50–14.70 |
|
GA (°) |
12.7 |
10.20–17.40 |
|
AIEA (°) |
96.89 |
94.80–100.00 |
|
A/P ratio |
0.79 |
0.66–0.88 |
|
AVH ratio |
0.67 |
0.58–0.76 |
|
AED (mm) |
2 |
1.00–3.60 |
|
PED (mm) |
5.05 |
3.34–5.99 |
Table 2 Quantitative CT parameters
In contrast to A1–A2 compression fractures, posterior edge displacement (PED) demonstrated clinically meaningful variability in the A3–A4 cohort and was therefore retained in the final analysis. PED was defined as the horizontal displacement of the posterior vertebral wall fragment, measured as the distance from the most prominent point of the posterior cortical contour of the fractured vertebra to the line connecting the posterior margins of the adjacent intact vertebral bodies. The distribution of qualitative CT features included in the analysis as potential predictors of PLC injury is presented in Table 3. The observed distributions of quantitative and qualitative CT parameters formed the basis for the subsequent development of a prognostic model for PLC injury in the A3–A4 cohort.
|
Parameter |
Frequency, n (%) |
95% CI |
|
FBF |
17 (36.2%) |
23.7–50.7 |
|
VLF |
9 (19.1%) |
10.3–32.6 |
|
HLF |
13 (27.7%) |
16.5–42.4 |
|
SPF |
13 (27.7%) |
16.5–42.4 |
Table 3 Qualitative CT features
Model development
Considering the observed variability of the parameters and their potential diagnostic relevance, independent feature selection was performed and a binary classification model was developed to estimate the risk of posterior ligamentous complex injury (PLC+ / PLC−). Predictor selection was based on diagnostic contribution, mutual dependence, and stability during cross-validation, which allowed parameters with low informativeness or excessive correlation to be excluded.
Model methodology and diagnostic performance
An extreme gradient boosting algorithm based on decision trees (XGBoost) was used to predict PLC injury in AO Spine A3–A4 fractures. The analysis included patients with verified A3 and A4 fractures according to the AO Spine classification. The target variable was coded as binary: Yes, confirmed PLC injury; No, absence of PLC injury. The model incorporated 12 morphometric and binary predictors reflecting vertebral body geometry, degree of fragmentation, and involvement of posterior structures. Given the limited sample size, model discrimination was assessed using repeated stratified 5-fold cross-validation with 20 repeats. The primary performance metric was the area under the receiver operating characteristic curve (AUC), which allowed evaluation of the model’s ability to correctly rank patients according to the probability of PLC injury independently of a selected classification threshold.
When evaluated on the full training cohort, the model demonstrated high discriminative performance: AUC = 0.949; 95% CI, 0.842–0.971; bootstrap, n = 2000. The ROC curve was clearly separated from the diagonal line of random classification, confirming the high informativeness of the algorithm (Figure 1A). This indicates that, on average, the model assigned a higher predicted risk to patients with true PLC disruption than to those without PLC injury.
Repeated cross-validation yielded an AUC of 0.894 using the 5×20 CV procedure (Figure 1B). Thus, under a more stringent internal validation approach, model discrimination decreased slightly but remained high, suggesting good prognostic potential and relative robustness of the model. Nevertheless, these findings require confirmation in an independent external cohort.
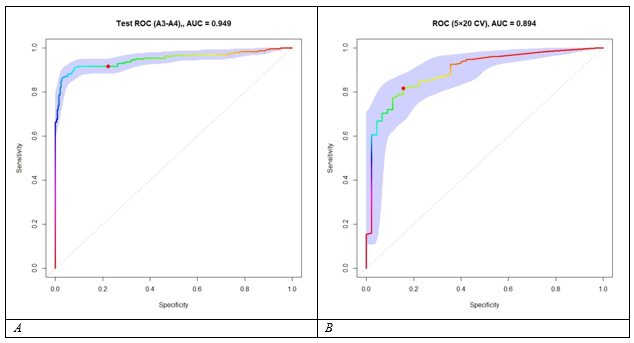
Figure 1 ROC curves of the model. A — ROC curve obtained during evaluation on the training cohort; in-sample AUC = 0.949. B — ROC curve obtained during repeated stratified 5-fold cross-validation with 20 repeats; AUC = 0.894.
Threshold characteristics
At a fixed classification threshold of 0.5, the model demonstrated a sensitivity of 0.917, specificity of 1.000, positive predictive value of 1.000, negative predictive value of 0.929, overall accuracy of 0.960, and F1 score of 0.957 in the evaluation subset (n = 25). However, given the small size of this subset, these metrics should be interpreted as preliminary. The fact that some metrics reached a value of 1.000 is most likely explained by the absence of the corresponding type of classification error in this particular sample and does not exclude a decrease in these values during external validation. Therefore, threshold-dependent metrics should not be regarded as independent evidence of model robustness, but rather as complementary to the AUC obtained during repeated cross-validation.
It should be noted that, at the 0.5 threshold, the model showed a tendency toward high specificity and positive predictive value, with moderately high sensitivity. This pattern reflects a pronounced separation of classes according to morphometric criteria in patients with substantial structural destruction. The use of the Youden-optimized threshold improved the balance between sensitivity and specificity, which may be preferable when the algorithm is applied clinically as a risk-stratification tool.
Feature importance analysis
Two independent approaches were used to interpret the model: the built-in XGBoost Gain metric (Figure 2A) and permutation-based loss of accuracy (Figure 2B). Both methods demonstrated a similar hierarchy of predictors. The greatest contribution to the model was made by AVH_ratio, A/P ratio, and FBF. These variables formed the main discriminatory signal of the algorithm. Their high informativeness is consistent with the biomechanical logic of AO Spine A3–A4 fractures, in which the degree of vertebral body disintegration and impairment of load-bearing structures are central determinants of instability.
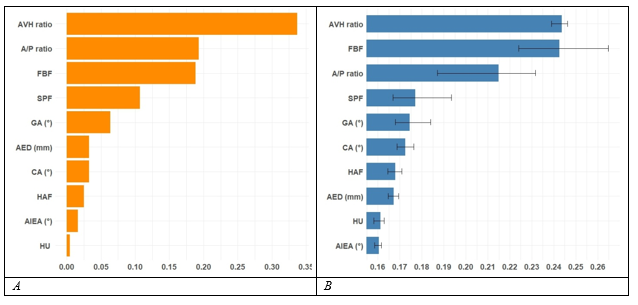
Figure 2 Model predictor informativeness. A — predictor importance according to the XGBoost Gain metric. B — predictor importance according to permutation-based loss of accuracy.
The second group of important predictors included SPF, GA, and AED. Angular parameters, including CA and GA, showed a moderate contribution, whereas the binary indicator of A4 subtype demonstrated minimal independent informativeness. This suggests that quantitative morphometric parameters sufficiently capture the differences between A3 and A4 fractures, making the formal subtype indicator largely redundant. Permutation analysis confirmed the critical role of AVH_ratio and A/P ratio: random permutation of these variables produced the greatest reduction in AUC. The agreement between the two independent interpretability methods increases confidence in the identified predictor hierarchy.
Partial dependence analysis
Partial dependence analysis demonstrated a pronounced threshold-like effect of the key morphometric parameters.
A decrease in AVH_ratio was associated with a sharp increase in the predicted probability of PLC injury. Similarly, a lower A/P ratio was associated with an increased predicted probability of PLC disruption. The presence of FBF substantially increased the estimated risk, independently of angular parameters.
The shape of the partial dependence curves was stepwise rather than linear, reflecting the tree-based structure of the algorithm and the presence of threshold biomechanical states within the injured spinal segment. These findings confirm that, in AO Spine A3–A4 fractures, PLC injury is determined primarily by the degree of structural destruction of the vertebral body rather than by angular deformity alone. In contrast to the A1–A2 model, where parameters of vertebral wedging and angular compression played a leading role, the key predictors in the A3–A4 cohort were variables reflecting fragmentation and spatial disintegration.
The high in-sample AUC of 0.949, together with a good repeated cross-validation AUC of 0.894, indicates stable discriminative performance of the model. The moderate decrease in performance during internal cross-validation was expected and does not suggest marked overfitting. Thus, the model developed for AO Spine A3–A4 fractures demonstrated high predictive accuracy, interpretability, and biomechanical plausibility, supporting its potential use for clinical risk stratification of PLC injury.
Composite assessment of feature informativeness
To translate the results of algorithmic analysis into a clinically applicable format, a procedure for aggregating XGBoost-derived feature-importance metrics was implemented. In contrast to simple interpretation of the Gain metric alone, an integrated approach was used to account for different aspects of each predictor’s contribution to the ensemble of decision trees. XGBoost provides three complementary measures of feature importance:
Gain reflects the average reduction in the loss function when a feature is used for node splitting and therefore represents the intensity of its contribution to classification.
Cover reflects the proportion of observations included in splits where the feature was used and characterizes the extent of its application across the dataset.
Frequency reflects the relative frequency with which the feature is included in the structure of the trees and describes the stability of its use within the ensemble.
Because each of these parameters reflects a different component of feature influence, a composite metric, the integral weight (Wint), was introduced and calculated as a weighted sum of the three indicators:
In this formulation, half of the total weight was assigned to Gain as the primary indicator of discriminative contribution, whereas Cover and Frequency provided adjustment for the extent and stability of feature use. This weighting scheme reduces the risk of overestimating variables that have a strong local effect but are used infrequently.
It should be emphasized that calculation of Wint was based exclusively on standard XGBoost output metrics and did not involve empirical corrections. This ensures reproducibility of the procedure when the model is retrained using identical parameters.
Transformation of Weights to a Unified Scale
Absolute Wint values are useful for internal comparison of predictors; however, for clinical interpretation, a unified scale is preferable. For this purpose, linear normalization of the integral weights to a range from 0 to 10 points was performed.
The maximum Wint value in the model was assigned 10 points, while the remaining values were calculated proportionally:
This transformation preserved the relative ranking of predictors according to their contribution to classification, presented their impact in a standardized numerical form, and thereby simplified comparison of the relative importance of individual predictors. In addition, the use of a unified scale provided the methodological basis for further transition from algorithmic feature-importance assessment to the construction of a point-based prognostic score.
As a result, each CT parameter received a quantitative score from 0 to 10, reflecting its relative contribution to the prediction of posterior ligamentous complex injury. The results are presented in Table 4.
|
Feature |
Gain |
Cover |
Frequency |
Wint |
Points, 0–10 |
|
AVH_ratio |
0.337 |
0.219 |
0.188 |
0.27 |
10.0 |
|
FBF |
0.188 |
0.181 |
0.188 |
0.186 |
6.9 |
|
A/P ratio |
0.193 |
0.127 |
0.125 |
0.159 |
5.9 |
|
SPF |
0.107 |
0.086 |
0.063 |
0.091 |
3.4 |
|
CA |
0.033 |
0.105 |
0.125 |
0.074 |
2.7 |
|
GA |
0.064 |
0.058 |
0.063 |
0.062 |
2.3 |
|
AED |
0.033 |
0.057 |
0.063 |
0.046 |
1.7 |
|
HAF |
0.025 |
0.057 |
0.063 |
0.043 |
1.6 |
|
AIEA |
0.016 |
0.06 |
0.063 |
0.039 |
1.4 |
|
HU |
0.004 |
0.051 |
0.063 |
0.031 |
1.1 |
Table 4 Integral weights and normalized point scores of CT predictors of posterior ligamentous complex injury
The use of a composite metric made it possible to move from purely “algorithmic” feature importance to a clinically meaningful structure of risk factors. In particular, features with a pronounced local effect but limited prevalence did not dominate the final hierarchy, whereas variables with a stable and systematic contribution received a higher integral weight. Thus, the integral analysis not only quantitatively ranks the predictors, but also provides a logical basis for constructing a clinical risk score.
Development of an interval-based prognostic score for A3–A4 fractures
To transform integral weights into a practical clinical tool, an interval-based point scale was developed using supervised binning of quantitative predictors. In contrast to the A1–A2 model, where risk increased more gradually, the A3–A4 cohort demonstrated a pronounced threshold-like structure in the distribution of PLC injury probability.
Range partitioning was performed using a decision-tree algorithm with restricted depth, which enabled identification of clinically meaningful cut-off values without overcomplicating the model. For each feature, three to four interval categories were generated, with boundaries determined from the data according to differences in the frequency of PLC injury (Table 5).
|
Feature |
Value interval |
Points |
|
AVH_ratio |
> 0.79 |
0.0 |
|
0.67–0.79 |
6.7 |
|
|
0.53–0.67 |
3.3 |
|
|
≤ 0.53 |
10.0 |
|
|
A/P ratio |
> 0.90 |
0.0 |
|
0.79–0.90 |
2.0 |
|
|
0.64–0.79 |
3.9 |
|
|
≤ 0.64 |
5.9 |
|
|
FBF |
No |
0.0 |
|
Yes |
6.9 |
|
|
SPF |
No |
0.0 |
|
Yes |
3.4 |
|
|
CA (°) |
< 6.9 |
0.0 |
|
6.9–10.7 |
0.9 |
|
|
10.7–16.2 |
1.8 |
|
|
> 16.2 |
2.7 |
|
|
GA (°) |
< 9.2 |
0.0 |
|
9.2–12.7 |
0.8 |
|
|
12.7–18.0 |
1.5 |
|
|
> 18.0 |
2.3 |
|
|
AED (mm) |
< 0.8 |
0.0 |
|
0.8–2.0 |
0.6 |
|
|
2.0–3.6 |
1.1 |
|
|
> 3.6 |
1.7 |
|
|
HAF |
No |
0.0 |
|
Yes |
1.6 |
|
|
AIEA (°) |
> 95 |
0.0 |
|
85–95 |
0.7 |
|
|
< 85 |
1.4 |
|
|
HU modifier |
< 150 |
−1.1 |
|
150–185 |
0.0 |
|
|
> 185 |
1.1 |
Table 5 Prognostic score: interval gradations of features and assigned points
General structure of the score
In contrast to the A1–A2 score, where angular parameters played a leading role, the A3–A4 point-based model clearly demonstrated the dominance of parameters reflecting structural destruction of the anterior column, primarily AVH_ratio and A/P ratio, with a secondary role of angular characteristics. The point scale preserved proportionality to the integral weights and provided a monotonic relationship between the total score and the probability of PLC injury.
Methodological difference from the A1–A2 model
Whereas the A1–A2 score reflected a gradual increase in deformity, the A3–A4 model revealed a more pronounced threshold-based structure. This corresponds to the difference in pathomechanics:
A1–A2 fractures represent a predominantly deformational injury pattern.
A3–A4 fractures represent a structurally destructive injury pattern with critical levels of vertebral body collapse.
Prognostic model based on the total point score for A3–A4 fractures
To quantitatively assess the prognostic value of the developed score, a logistic regression model was constructed in the following form:
The analysis yielded the following coefficients: = −1.183 and = 0.183. The coefficient for the total point score was statistically significant (p < 0.001), confirming a robust association between the total score and the risk of posterior ligamentous complex injury.
Transformation of the β1 coefficient into an odds ratio showed:
OR=1,20 (95% CI:1,14–1,27)
This indicates that each additional point on the scale was associated with an approximately 20% increase in the odds of posterior ligamentous complex injury. Accordingly, a 5-point increase corresponded to an approximately 2.5-fold increase in the odds, whereas a 10-point increase was associated with more than a 6-fold increase. Thus, the total point score demonstrated a pronounced gradient relationship with the probability of PLC injury and may be considered a quantitative risk indicator within the developed model.
ROC analysis showed that the discriminative ability of the point-based model remained high, with an area under the curve of AUC = 0.880. This indicates that the model retained a good ability to correctly rank patients according to the probability of PLC injury. Although this value was somewhat lower than that of the original XGBoost model, the reduction in discriminative performance does not appear critical. A difference of approximately 0.07 reflects the expected compromise between predictive accuracy and interpretability, since the point-based system is, by design, a simplified linear approximation of a more complex nonlinear model.
Graphical analysis demonstrated a monotonic increase in the predicted probability of PLC injury with increasing Total Points. At low total scores, the probability remained relatively low; in the intermediate range, it increased most steeply; and at high values, it reached a plateau, corresponding to the sigmoid shape of the logistic model. This pattern is consistent with the pathomechanics of A3–A4 fractures: accumulation of signs of structural disintegration, including marked reduction in AVH ratio, decrease in A/P ratio, presence of posterior wall fragmentation, and involvement of posterior osseous elements, reflects progressive impairment of the load-bearing function of the anterior and middle columns and is naturally associated with involvement of the posterior ligamentous complex. Importantly, the score retained a linear relationship with the logit of probability, meaning that each additional point was associated with a predictable change in the estimated risk (Figure 3).
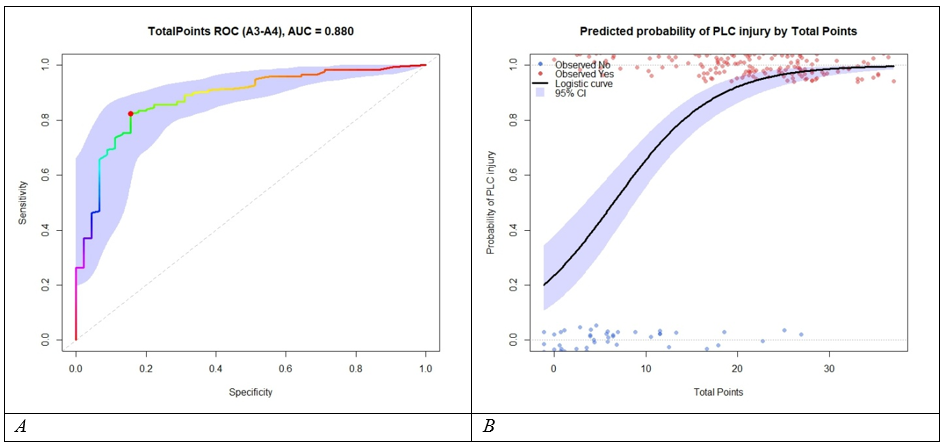
Figure 3 Performance of the Total Points model for predicting posterior ligamentous complex injury in AO Spine A3–A4 fractures. A — ROC curve of the Total Points model, AUC = 0.880. B — Relationship between the predicted probability of posterior ligamentous complex injury and the Total Points value in patients with AO Spine A3–A4 fractures.
Despite a moderate decrease in AUC compared with XGBoost, the point-based model has several important advantages. First, it is highly interpretable, since the contribution of each feature is expressed as an intuitive number of points that directly affects the final risk estimate. Second, calculation of the total score and the corresponding probability does not require specialized software, making the scale suitable for routine clinical use. Finally, the model did not demonstrate signs of statistical instability, including complete separation effects, which may complicate the use of more complex algorithms. Taken together, these properties allow the integral score to be regarded as a clinically oriented representation of the original machine-learning model, providing a reasonable compromise between predictive performance, robustness, and practical applicability.
Calibration of the point-based model
Calibration analysis of the logistic model based on the Total Points score demonstrated good agreement between predicted and observed probabilities of posterior ligamentous complex injury (Figure 4). The Brier score was 0.103, indicating good overall accuracy of probabilistic predictions. A calibration intercept close to zero indicated the absence of substantial systematic bias, meaning that the model did not show a marked tendency to systematically overestimate or underestimate risk. The calibration slope of 1.00 indicated good agreement between estimated and observed probabilities and did not reveal relevant signs of miscalibration. Thus, the point-based model combined high discriminative ability (AUC = 0.880) with adequate calibration, further supporting its suitability for clinical prediction.
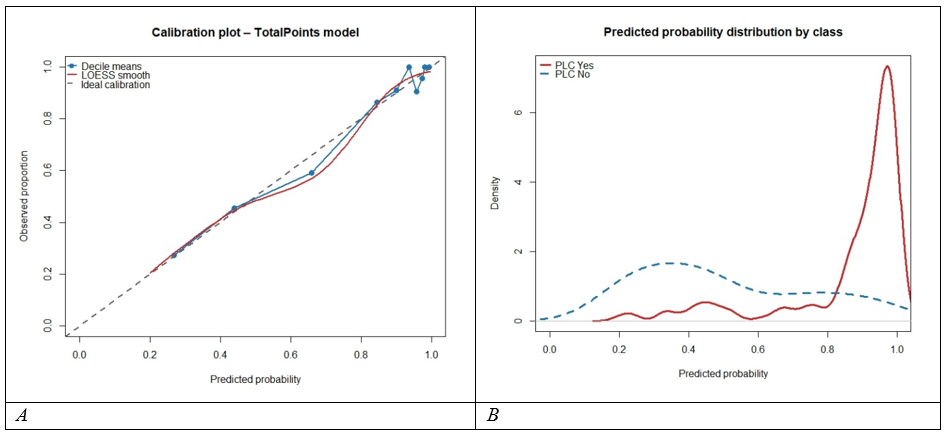
Figure 4 Characteristics of the point-based prognostic model for A3–A4 fractures. A — Calibration curve of the logistic model P (PLC)∼Total Points: points indicate mean predicted and observed probabilities in decile risk groups; the red line represents LOESS smoothing; the dashed diagonal line indicates perfect calibration. B — Distribution of predicted probabilities by class: the red curve represents patients with confirmed PLC injury (Yes), and the blue dashed curve represents patients without PLC injury (No).
The graph demonstrates clear separation of probability distributions between the two groups. Patients with PLC injury showed a shift toward higher predicted probabilities, whereas in patients without PLC injury, density was concentrated in the lower-probability range. The slight overlap between the curves explains the AUC of 0.880 obtained for the point-based model and reflects the preservation of high, but not perfect, discriminative ability after simplification of the original XGBoost model.
This interpretability provided the rationale for transforming the model into a graphical format, namely a nomogram. Unlike the gradient boosting algorithm, which conceals the internal structure of decision-making, the point-based model allows the relationship between the probability of PLC injury and the combined CT parameters to be represented as a linear scale suitable for clinical use. The nomogram provides a visual representation of the contribution of each feature to the total score and demonstrates how accumulation of unfavorable injury characteristics progressively increases the predicted risk. Thus, the transition from a statistical model to a nomogram is not merely a visual simplification, but rather the logical completion of the interpretative stage: the translation of a quantitative algorithm into a practical clinical tool (Figure 5).
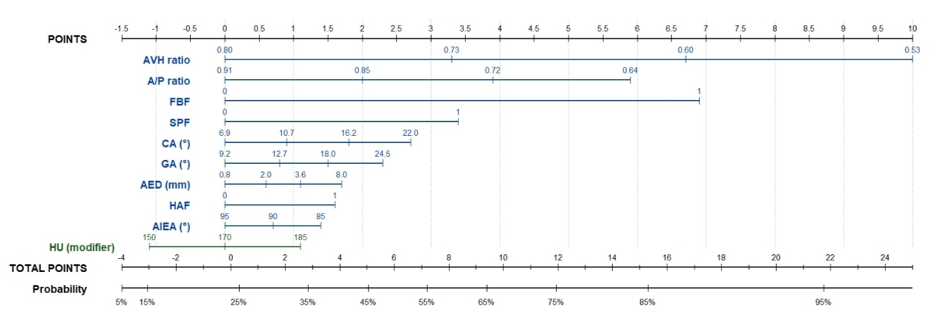
Figure 5 1 ROC curves of the model. A — ROC curve obtained during evaluation on the training cohort; in-sample AUC = 0.949. B — ROC curve obtained during repeated stratified 5-fold cross-validation with 20 repeats; AUC = 0.894.
The presented nomogram allows quantitative estimation of the individual probability of posterior ligamentous complex injury based on the combination of CT features included in the developed integral scale. For each morphometric parameter — AVH ratio, A/P ratio, CA, GA, AED, and AIEA — and for the binary features FBF, SPF, and HAF, the patient’s value is identified on the corresponding horizontal axis. Projection of this value onto the upper POINTS scale reflects the contribution of the specific feature to the total score. After summing the points on the TOTAL POINTS scale, the resulting value is projected onto the lower axis, where it is transformed into the individual probability of PLC injury using the logistic function.
It is important to emphasize that even with minimal values of most predictors, the predicted probability does not decrease to zero. This is related to the characteristics of the study cohort itself: AO Spine A3–A4 fractures are structurally destructive injuries characterized by disruption of the posterior vertebral wall, multifragmentary fragmentation, and involvement of the middle column. In contrast to A1–A2 compression fractures, where the risk of PLC disruption is largely determined by the degree of wedge deformity, A3–A4 fractures carry an a priori baseline risk associated with the injury mechanism itself. Mathematically, this is reflected in the intercept of the logistic model, which defines a nonzero probability of PLC injury even at the minimum total score. Thus, the model does not assume the existence of a completely “safe” zone within the A3–A4 cohort; rather, the score is intended not to exclude risk, but to grade it within an already unfavorable injury group.
An increase in the total score reflects accumulation of signs of structural instability: marked reduction in anterior vertebral height ratio, decrease in A/P ratio, presence of free bone fragments and spinous process fracture, increased segmental angles, and displacement of fragments. These characteristics indicate increasing disintegration of the anterior and middle columns, as well as transmission of pathological load to the posterior spinal elements, which is consistently accompanied by an increased probability of PLC injury.
The separate HU modifier scale accounts for the influence of bone mineral density on the injury scenario. Low HU values may be associated with relative predominance of a compression-type failure mechanism, whereas high HU values may indicate the effect of greater kinetic energy and combined compression-distraction loading. Inclusion of HU in the model makes it possible to account for variability in biomechanical conditions without changing the overall monotonic relationship between the total score and the risk of injury. Thus, the nomogram represents a clinically interpretable tool that integrates morphological and biomechanical characteristics of trauma into a unified quantitative risk-assessment system. It provides a transparent transformation of objective CT parameters into an individualized probability of PLC injury and enables rapid estimation of segmental instability without the need for complex machine-learning algorithms.
The results of the present study confirm that the prognostic value of CT morphometry in thoracolumbar junction injuries has a hierarchical structure and directly depends on fracture type. The transition from compression injuries (A1–A2) to burst fractures (A3–A4) is accompanied by a qualitative change in the structure of instability predictors: the dominant role of angular parameters is replaced by indices of volumetric vertebral body disintegration and signs of posterior column fragmentation.
Biomechanical paradigm and the dominance of structural destruction
In contemporary spine trauma care, assessment of posterior ligamentous complex (PLC) integrity remains a key issue in the management of patients with AO Spine A3–A4 fractures without neurological deficit.14 According to the Thoracolumbar Injury Classification and Severity Score (TLICS), PLC status represents a critical determinant in the choice between conservative and surgical treatment.15 However, our data suggest that, in burst fractures, “isolated” anterior column injury is more of a radiological illusion than a biomechanical reality.
The greatest contribution to the discriminative performance of the model was made by AVH_ratio and A/P ratio. This can be explained by the fact that, under high-energy axial loading, burst destruction of the vertebral body leads to centrifugal displacement of osseous fragments. A decrease in the anterior vertebral height ratio (AVH_ratio) below the threshold of 0.53, corresponding to 10 points on the proposed scale, may create critical tension in the supraspinous and interspinous ligaments. At this stage, the PLC no longer functions merely as a stabilizer, but rather as a restraining structure operating near the limit of its mechanical capacity.16 Therefore, marked vertebral body collapse in A3–A4 fractures is not simply a morphological feature, but an indirect indicator of failure of the posterior tension band.
The phenomenon of a “diagnostic plateau” and baseline risk
A fundamental difference between the A3–A4 model and the previously developed A1–A2 model is the absence of a true “zero-risk” zone. Even at minimal values on the proposed nomogram, the predicted probability of PLC injury does not decrease to zero. This reflects the pathomechanical essence of a burst fracture: involvement of the posterior vertebral wall, corresponding to the middle column in Denis’ concept, implies a higher level of absorbed traumatic energy compared with simple compression fractures.
Mathematically, this is reflected in the intercept of the logistic model. Clinically, it means that any AO Spine A3–A4 fracture should be regarded as potentially unstable, corresponding to the logic of the AO Spine M1 modifier, until proven otherwise. This is fully consistent with the principle of diagnostic caution incorporated into the AO Spine Thoracolumbar Injury Classification System.2,17
Role of qualitative markers and “hidden” instability
The high importance of the FBF feature and spinous process fracture (SPF) deserves particular attention. In our model, the presence of FBF adds 6.9 points to the total score, which is comparable in weight to critical vertebral body height reduction. From a clinical and biomechanical perspective, the presence of a free bone fragment in the setting of multifragmentary vertebral body injury should primarily be interpreted as a marker of pronounced structural disintegration and a high-energy burst mechanism.
In combination with other CT features, this finding may indirectly indicate a more complex injury mechanism that includes not only a compressive component, but also possible involvement of flexion-distraction forces associated with ligamentous injury.18,19 At the same time, confirmed SPF suggests direct or indirect trauma to the posterior supporting complex, mediated through ligamentous tension. The combination of these qualitative features with quantitative parameters of fragmentation and displacement, such as AED and PED, allows the model to identify patients whose fracture morphology formally corresponds to type A, but is accompanied by signs of biomechanical instability and probable PLC involvement. Such injuries may therefore approximate the pattern of tension-band injury typically associated with type B fractures.20
Clinical implementation: from XGBoost to a point-based score
The use of the extreme gradient boosting algorithm (XGBoost) enabled high predictive accuracy; however, the complexity of such models limits their direct application in emergency spine trauma care. Transformation of the model into an interval-based point score and nomogram resulted in only a moderate decrease in discrimination, which appears to be an acceptable trade-off for substantially improved interpretability.
The proposed nomogram allows clinicians to stratify risk within several minutes. For example, a patient with an A4 fracture, an AVH_ratio of 0.5, the presence of FBF, and local kyphosis (CA) of 15° would immediately accumulate more than 20 points, corresponding to a predicted probability of PLC injury greater than 85%. In such cases, delaying surgery solely to obtain MRI may be unjustified, particularly in the presence of polytrauma or unstable hemodynamics.
Limitations and future perspectives
Despite the statistical robustness of the model, several limitations should be acknowledged. The study had a retrospective design and included a relatively limited sample size. In addition, MRI as a reference standard has inherent limitations: ligamentous edema, represented by hyperintense signal on STIR sequences, does not always indicate mechanical rupture. In future studies, integration of intraoperative data on PLC integrity may further improve the specificity of the model.
Specificity of predictors. In AO Spine A3–A4 burst fractures, the leading markers of PLC injury are parameters reflecting structural collapse of the anterior and middle columns, particularly AVH_ratio and A/P ratio, whereas angular deformity parameters, including kyphosis, play a secondary role. This distinguishes A3–A4 injuries from A1–A2 compression fractures.
Model performance. The developed XGBoost-based prognostic model demonstrated high discriminative ability, with a cross-validated AUC of 0.894, allowing CT-based diagnosis of ligamentous instability to be objectified.
Clinical tool. The proposed point-based score and nomogram provide reliable risk stratification for PLC disruption. A total score above 15–18 points may be considered a strong argument for verification of instability by MRI or for choosing an active surgical strategy when additional imaging is not feasible.
Practical significance. Implementation of quantitative CT morphometry may help formalize the assessment of indeterminate posterior tension-band status, corresponding to the AO Spine M1 modifier, reduce interobserver variability, and improve the justification of treatment decisions in the acute phase of trauma.
None.
The authors declare that there are no conflicts of interest.

©2026 Nekhlopochyn, et al. This is an open access article distributed under the terms of the, which permits unrestricted use, distribution, and build upon your work non-commercially.
