MOJ
eISSN: 2641-9297


Research Article Volume 1 Issue 3
International cancer prevention center, Japan
Correspondence: Tsuneo Kobayashi, International cancer prevention center, Chiba city, 3-21-1, Takasu, Mihamaku, Chiba city 261-0004, Japan, Tel 043-306-2611, Fax 043-279-4211
Received: April 12, 2018 | Published: May 2, 2018
Citation: Kobayashi T. A method to induce tumor marker release. MOJ Curr Res & Rev. 2018;1(3):102-108. DOI: 10.15406/mojcrr.2018.01.00015
Objective: Tumor markers are considered unreliable because their levels are low and detection methods are not sufficiently sensitive and specific. Furthermore, there is no clear correlation with tumor size, because the biological characteristics of tumor markers remain largely unknown. We previously reported a reliable tumor marker combination assay in the journal Cancer in 1994 using 3 types of marker, tumor-specific, tumor- associated and growth-related makers. Here, we report a new method to induce tumor marker release and discuss related clinical applications, especially, for cancers without specific tumor markers.
Methods: The human gastric cancer line MKN-45 (20million cells) was transplanted into nude mice. On days 20 and 27 after tumor cell transplantation tumor, 2500 IU vitamin A (retinoic acid) was administered intramuscularly. After 3 hours, the tumor bearing nude mice were treated at 40°C for 20 minutes using an infrared red ray sauna bath to induce tumor marker release. Carcinoembryonic antigen (CEA) was measured at 0, 6, 24, and 48 hours. The same doses of sodium bicarbonate and palmitic acid were used as controls. We examined the correlation of cancer stage and tumor marker parameters, including the maximum CEA value (CEAmax), the maximum differences in CEA levels (ΔCEA: range of tumor marker levels), average variation (ΔCEA/ h) and the expected maximum quantity (ΔCEA/h xCEAmax), after combined treatment with vitamin A and hyperthermia in nude mice and human.
Results: Tumor markers have been considered substances released by broken cancer cells. However, we observed that tumor marker release is induced by hyperthermia treatment with vitamin A and is inhibited by treatment with actinomycin D or cycloheximide via CEA mRNA. Tumor marker release might be related to tumor markers induced by mRNA synthesis. We designed a method to estimate the correlation between the presence of tumors and tumor size, using tumor-marker parameters.
Conclusion: We can estimate the tumor size with the maximum value(Vmax), maximum differences in value (Δmax), the average variation (Δmax/h) and expected maximum quantity (ΔmaxxVmax) based on the release of tumor markers by combining vitamin A and hyperthermia treatment even if tumor lacks specific tumor marker.
Keywords: induction of tumor marker, maximum difference in value (Δmax), maximum value (Vmax), the average variation (Vmax/h), expected maximum quantity (VmaxxΔmax/h)
Although, Kitamura1 reported that the maximum range variation for carcinoembryonic antigen (CEA) levels in a healthy body is narrow for many years.1 We observed that serum tumor markers are not constant in any cancer case. To date, the induction of tumor marker release (TMR) has never been applied to patients during an initial examination in an outpatient clinic. Prior to patient examination, we verified the utility of this method in animal and tissue culture experiments.
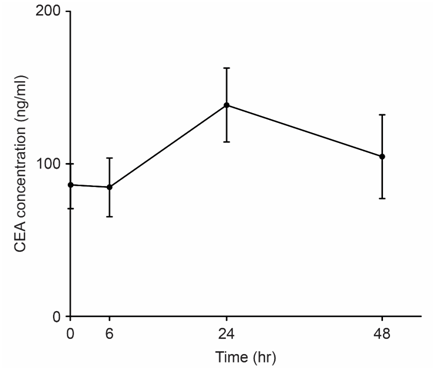
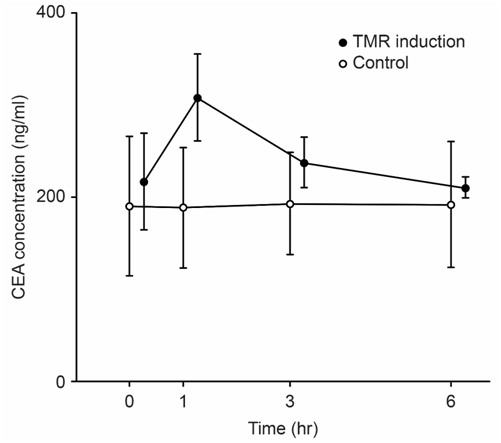
We examined the correlation between tumor size and tumor marker parameters including the maximum level of the tumor marker CEA (CEAmax), the change in the CEA value (ΔCEA), the rate of change of the CEA value (ΔCEA/h), and ΔCEA/h x CEAmax. We revealed long-term (Figure 1) and short-term (Figure 2) TMR induction; CEA release was induced by vitamin A (Chocola®, retinoic acid 25~125μM) and hyperthermia (40°C for 20min). CEA was assayed with an enzyme immunoassay using a CEA-EIA kit (Hoffman-Roche Co., Basel, Switzerland)
TMR was characterized by short-term and long-term biphasic induction reactions. Because short-term TMR induction is difficult to use in clinical practice, long-term TMR induction (1 to 2days) is conventionally used.
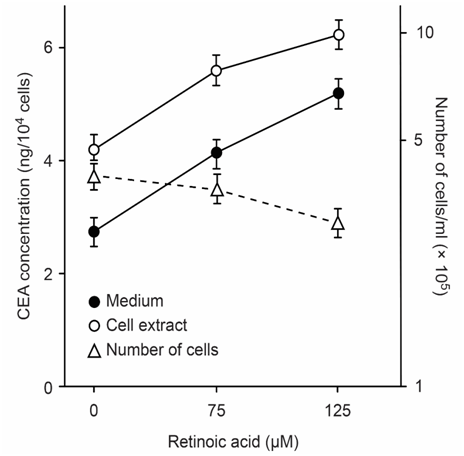
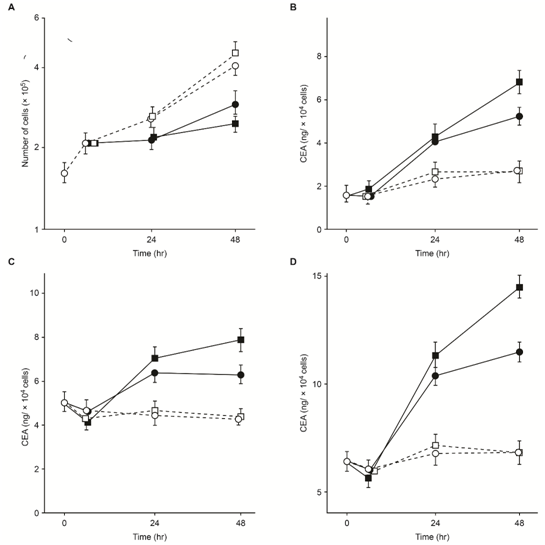
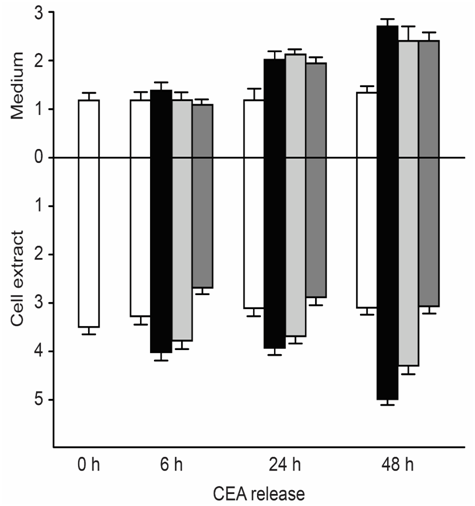
CEA-producing human cultured cancer cells (MKN-45) were treated with vitamin A (retinoic acid, 75 to 125μM). After treatment, cell growth was slightly inhibited, and intracellular and extracellular CEA levels increased (Figure 3).
Methods for inducing TMR in humans4
A total of 138 patients presented at a holistic medical outpatient clinic and received a histopathological definitive diagnosis. The tumor size was 1 to 2 cm in diameter for cancer stage G1, 2 to 5 cm in diameter for cancer stage for G2, and 5 cm or greater in diameter for cancer stage G3, which was classified as advanced cancer. Stage G1, G2 and G3 numbers included 61, 37 and 40 cases, respectively. As a control, the induction of TMR was studied in 11 patients without cancer and in 4 healthy subjects. Tumor marker release was examined. Table 1 shows the types of cancer.
Carcinoma |
No. of patients |
Breast |
25 |
Stomach |
21 |
Colon |
15 |
Rectum |
10 |
Uterus |
8 |
Lung |
8 |
Larynx |
3 |
Liver |
5 |
Kidney |
4 |
Nose |
2 |
Esophagus |
2 |
Malognant Lymphoma |
2 |
Hodgkin disease |
2 |
Seminoma |
4 |
Leukemia |
2 |
Miscellaneous |
25 |
Controls |
|
Healthy individuals |
4 |
Non-cancer patient |
11 |
Table 1 Diagnosis subject who have various cancer, were utilized in TMR experiment
Induction period after hyperthermia (h) |
Number of cases |
|||||||
|---|---|---|---|---|---|---|---|---|
Four markers |
Five markers |
|||||||
G1 |
G2 |
G3 |
Total |
G1 |
G2 |
G3 |
Total |
|
6 |
11 |
11 |
9 |
31 |
1 |
0 |
2 |
3 |
8 |
8 |
1 |
5 |
14 |
5 |
0 |
3 |
8 |
24 |
20 |
9 |
4 |
33 |
12 |
5 |
4 |
21 |
48 |
22 |
16 |
22 |
60 |
12 |
12 |
9 |
33 |
Total |
61 |
37 |
40 |
138 |
30 |
17 |
18 |
65 |
Table 2 Times of final blood collection and number of patients for each blood sampling
CEA, ferritin (FT), AFP, and FT/Fe in the case of four markers
CEA, ferritin (FT), AFP, FT/Fe, and sialic acid in the case of five markers
Determination of tumor markers
CEA levels were determined by enzyme immunoassay with kits obtained from Abbott Co., Ltd. The cut-off value for CEA(Vmax) in stage G1 and the cut-off value of Δmax (hereafter referred to as Δ in Tables 3‒5) determined as the difference between the maximum and minimum values, were found to be 4.4ng/ml and 0.9ng/ml, respectively. The cut-off value of Δmax per hour (Δmax/h) and the cut-off value of (Δmax/h)xVmax were calculated to be 0.1ng/ml.h and 0.25ng2/ml2.h, respectively. Values of ferritin, alpha-fetoprotein (AFP), silalic acid and the ratio of ferritin to serum iron (FT/ Fe) were also determined using four parameters (Δmax, Vmax, Δmax/h, and Δ (Δmax/h)xVmax). The cut-off values for each stage are shown in Table 3. To quantitatively assess ferritin levels, the SPAC-Ferritin kit (The First Radioisotope Research Institute, Tokyo, Japan) and RIA-gnost Ferritin kit (Hoechst, Frankfurt, FRG) were used. The AFP level was determined by RIA (double antibody method). Sialic acid levels were determined by enzyme assay with neuraminidase. Serum iron (Fe) was assayed with a Hitachi 705 autoanalyzer.
Tumor marker |
Cancer stage |
||
|---|---|---|---|
G1 |
G2 |
G3 |
|
CEA (ng/ml) |
|
|
|
Vmax |
4.4 |
4.8 |
10 |
Δ |
0.9 |
1 |
1.5 |
Δ/h |
0.1 |
0.12 |
0.25 |
Δ/h × Vmax |
0.25 |
0.35 |
1 |
FT SPAC (ng/ml) |
|
|
|
Vmax |
M:150, F:65 |
190 |
300 |
Δ |
20 |
30 |
40 |
Δ/h |
0.8 |
1.5 |
4 |
Δ/h × Vmax |
50 |
100 |
400 |
RIA |
|
|
|
Vmax |
M:200, F:100 |
300 |
450 |
Δ |
M:30, F:40 |
M:50, F:40 |
60 |
Δ/h |
4 |
7 |
15 |
Δ/h × Vmax |
800 |
2,000 |
5,000 |
AFP (ng/ml) |
|
|
|
Vmax |
10 |
20 |
50 |
Δ |
5 |
6 |
7 |
Δ/h |
0.6 |
0.6 |
0.8 |
Δ/h × Vmax |
3 |
4 |
8 |
Sialic acid (mg/dl) |
|
|
|
Vmax |
66 |
70 |
73 |
Δ |
5 |
7 |
10 |
Δ/h |
0.5 |
0.65 |
0.8 |
Δ/h × Vmax |
30 |
35 |
45 |
FT/Fe (ng/ml/μg/dl) |
|
|
|
SPAC |
1 |
2 |
3 |
RIA |
1.5 |
2.5 |
5 |
Table 3 Cut-off values for tumor markers
†No. of cases
‡Percent positive
Tumor marker |
Cancer stage |
Normal subjects |
Cut-off used |
||
|---|---|---|---|---|---|
G1 |
G2 |
G3 |
|||
CEA |
|
|
|
|
|
Δ or Vmax |
36/61†, (64)‡ |
23/37 (62) |
28/40 (70) |
1/15 (7) |
0.9 or 4.4 |
Δ/h or Δ/h × Vmax |
37/61 (61) |
27/37 (73) |
28/40 (70) |
1/15 (7) |
0.1 or 0.25 |
Either one of four |
42/61 (69) |
30/37 (81) |
31/40 (78) |
1/15 (7) |
|
FT SPAC-ferritin kit |
|
|
|
|
|
Δ or Vmax |
12/28 (43) |
11/20 (55) |
15/21 (71) |
3/10 (30) |
20 or M:150, F:65 |
Δ/h or Δ/h × Vmax |
13/28 (46) |
13/20 (65) |
17/21 (81) |
4/10 (40) |
0.8 or 50 |
Either one of four |
15/28 (54) |
13/20 (65) |
18/21 (86) |
4/10 (40) |
|
RIA-gnost FT kit |
|
|
|
|
|
Δ or Vmax |
19/33 (58) |
11/17 (65) |
16/19 (84) |
0/5 (0) |
M:40, F:30 or M:200, F:100 |
Δ/h or Δ/h × Vmax |
17/33 (52) |
10/17 (59) |
13/19 (68) |
0/5 (0) |
4 or 800 |
Either one of four |
20/33 (61) |
11/17 (65) |
16/19 (84) |
0/5 (0) |
|
SPAC and RIA |
|
|
|
|
|
Δ or Vmax |
31/61 (51) |
22/37 (59) |
31/40 (78) |
3/15 (20) |
|
Δ/h or Δ/h × Vmax |
30/61 (49) |
23/37 (62) |
30/40 (75) |
4/15 (27) |
|
Either one of four |
35/61 (57) |
24/37 (65) |
34/40 (85) |
4/15 (27) |
|
AFP |
|
|
|
|
|
Δ or Vmax |
11/61 (18) |
3/37 (8) |
14/40 (35) |
1/15 (7) |
5 or 10 |
Δ/h or Δ/h × Vmax |
12/61 (20) |
7/37 (19) |
11/40 (28) |
0/15 (0) |
0.6 or 3 |
Either one of four |
15/61 (26) |
8/37 (22) |
17/40 (43) |
1/15 (7) |
|
Sialic acid |
|
|
|
|
|
Δ or Vmax |
22/30 (73) |
14/17 (82) |
15/18 (83) |
0/4 (0) |
5 or 66 |
Δ/h or Δ/h × Vmax |
17/30 (57) |
10/17 (59) |
15/18 (83) |
0/4 (0) |
0.5 or 30 |
Either one of four |
23/30 (77) |
14/17 (82) |
16/18 (89) |
0/4 (0) |
|
FT/Fe |
|
|
|
|
|
SPAC |
8/28 (29) |
12/20 (60) |
16/21 (76) |
2/10 (20) |
1 |
RIA |
17/33 (52) |
10/17 (59) |
16/19 (84) |
0/5 (0) |
1.5 |
SPAC and RIA |
25/61 (41) |
22/37 (59) |
32/40 (80) |
2/15 (13) |
|
Table 4 Determination of serum CEA, ferritin, α-fetoprotein, sialic acid, and FT/Fe in cancer patients
Preliminary results
The cut-off value for each of the four parameters at the G1 level was used for each tumor marker, and the number and rate of positive cases for tumor stages (G1, G2 and G3) are shown in Table 3. When the cut-off value of Δmax or Vmax at a G1 level was used for CEA, the rates for positive cases in stages G1, G2 and G3 were 64, 62 and 70%, respectively. When the cut-off value of Δmax/h or (Δmax/h)xVmax was used, the rates for positive cases in stages G1, G2 and G3 were 61, 73 and 70% respectively. When any one of the four parameters were examined using the SPAC-ferritin kit to determine ferritin level, the rates of positive cases in G1, G2, and G3 were 54, 65 and 86%, respectively. When any one of the four parameters were examined using the RIA-gnost ferritin kit to determine the ferritin level, the rates for positive cases in G1, G2 and G3 were 61, 65 and 84%, respectively. Thus, as the result of the determining the ferritin level with the above two ferritin kits, the rates for positive cases in stages G1, G2 and G3 were 57, 65 and 85%, respectively. When any one of four parameters (Δmax, Vmax, Δmax/h, or (Δmax/h) x Vmax) were used for AFP, the rates of positive cases were 26, 22, and 43% respectively. AFP was very unreliable. When any one of these parameters was used for silalic acid, the rates of positive cases in G1, G2 and G3 were 77, 82 and 89%, respectively. Because the ratio of ferritin Vmax (ng/ml) divided by serum iron (Fe, μg/dl) for the same period is considered an important tumor marker, we determined the rate of positive cases before the release induction by combing vitamin A and hyperthermia (0hr). When the SPAC-ferritin kit was used, the rates for stages G1, G2 and G3 were 29, 60 and 76%, respectively. When the RIA-gnost ferritin kit was used, they were 52, 59 and 84%, respectively. As a result of concurrent determinations with both kits, it was found that the rate of positive cases positively correlated with increased tumor stage.
Cancer Stage |
Nonmalignment diseases |
Healthy individuals |
|||
|---|---|---|---|---|---|
G1 |
G2 |
G3 |
|||
Any two of four markers† |
|||||
Δ or Vmax |
54(33/61)‡ |
62(23/37) |
88(35/40) |
18(2/11) |
0(0/4) |
Δ/h or Δ/h×Vmax |
56(34/61) |
70(26/37) |
83(33/40) |
18(2/11) |
0(0/4) |
Either one of 4 |
64(39/61) |
70(26/37) |
93(37/40) |
18(2/11) |
0(0/4) |
Any two of five markers§ |
|||||
Δ or Vmax |
73(22/30) |
76(13/17) |
94(17/18) |
nd¶ |
0(0/4) |
Δ/h or Δ/h×Vmax |
67(20/30) |
76(13/17) |
94(17/18) |
nd |
0(0/4) |
Either one of 4 |
77(22/30) |
82(14/17) |
94(17/18) |
nd |
0(0/4) |
Any three of five markers§ |
|||||
Δ or Vmax |
50(15/30) |
59(10/18) |
94(17/18) |
nd |
0(0/4) |
Δ/h or Δ/h×Vmax |
47(14/30) |
47(8/17) |
78(14/18) |
nd |
0(0/4) |
Either one of 4 |
53(16/30) |
65(11/17) |
94(17/18) |
nd |
0(0/4) |
Table 5 Comblination assay of serum CEA, FT, AFP, FT/Fe and or sialic acid in cancer patients who received TMR for tumors of various sizes
†CEP, ferritin, AFP and FT/Fe
‡No.of Casesgiven in parantheses
§CEA, FT, AFP, FT/Fe and or sialic acid
¶Not determined
The rates for five tumor markers are summarized in Table 5. When any of four parameters were used, the rates of two positive markers to four markers were 64, 70 and 93% in stages G1, G2 and G3, respectively, suggesting a linear correlation between tumor marker level and tumor size. Among any three of five positive tumor markers, any one of 4 were 53, 65 and 94% in G1, G2 and G3, respectively, suggesting the same tendency. In this regard, none of the healthy controls or the non-tumor bearing patients (except for those with elevated ferritin levels caused by liver dysfunction), showed false-positive findings for tumor markers. A cut-off value was assigned in each stage for each tumor marker (Table 3). For comparison, the rates determined using the cut-off values conventionally used before induction (at 0hr) are shown in Table 6. The positive rates per cases for any two of four markers was low, 11, 14% and 55% at level of G1, G2, and G3, respectively, suggesting no correlation between the markers and tumor size. As shown in Table 6, when TMR was not induced, the correlations of the tumor marker parameters with a cancer stage from G1 to G3 were not confirmed.
Tumor markers |
% Positive |
Cut-off used |
|||||
|---|---|---|---|---|---|---|---|
G1 |
G2 |
G3 |
|||||
CEA |
20 |
(12/61)† |
27 |
(10/37) |
53 |
(21/40) |
4.4ng/ml |
FT |
|
|
|
|
|
|
|
SPAC |
29 |
(8/28) |
45 |
(9/20) |
62 |
(13/21) |
F, 65; M, 150 |
RIA |
45 |
(15/33) |
53 |
(9/17) |
84 |
(16/19) |
F, 100; M, 200 (ng/ml) |
SPAC and RIA |
38 |
(23/61) |
49 |
(18/37) |
73 |
(29/40) |
|
AFP |
8 |
(5/61) |
3 |
(1/37) |
20 |
(8/40) |
10ng/ml |
Sialic acid |
30 |
(9/30) |
29 |
(5/17) |
56 |
(10/18) |
66ng/ml |
FT/Fe |
|
|
|
|
|
|
|
SPAC |
0 |
(0/28) |
0 |
(0/20) |
10 |
(2/21) |
10 |
RIA |
0 |
(0/33) |
0 |
(0/17) |
11 |
(2/19) |
20 |
SPAC and RIA |
0 |
(0/61) |
0 |
(0/37) |
10 |
(4/40) |
|
Any two of four markers |
11 |
(7/61) |
14 |
(5/37) |
55 |
(22/40) |
|
Any two of five markers |
30 |
(9/30) |
29 |
(5/17) |
94 |
(17/18) |
|
Any three of five markers |
3 |
(1/30) |
12 |
(2/17) |
39 |
(7/18) |
|
Table 6 Combination assay of tumor marker without TMR induction
†No. of cases is given in parentheses.
Practical application of a method to induce TMR in patients with poorly defined cancer
A method for inducing TMR can facilitate the diagnosis of cancers that are difficult to diagnose morphologically or poorly differentiated cancers, as well as the diagnosis of cancers for which specific markers are unavailable. In fact, diagnosis can be made by the combined use of tumor marker combination assay (TMCA) that we developed.5 In clinical practice, a 30-year-old woman was given a diagnosis of poorly differentiated ovarian cancer in K. Medical University, and underwent 2 surgical operations and 4 chemotherapy sessions. She was diagnosed as having “no recurrence” by Professor N. President of the Japan Society of Obstetrics and Gynecology. However, this patient consulted with another professor because of her poor condition and was referred and admitted to our hospital. The results of TMR are shown in Table 7.
TMR |
0 h |
6 h |
24 h |
48 h |
|
CEA |
2.1 |
2.2 |
3.1 |
2.2 |
Δ CEA (1.0), CEAmax (3.1) |
Ferritin |
160 |
170 |
150 |
130 |
Δ FT (40ng), FTmax (170) |
FT/Fe |
2.3 |
2.6 |
2.6 |
2 |
FT/Fe, max (2.6) |
ALP |
130 |
122 |
129 |
122 |
ALPmax (130), Δ ALP (8) |
LDH |
319 |
335 |
294 |
296 |
LDHmax (305), Δ LDH (41) |
CA15-3 |
12 |
13 |
14 |
11 |
CA15-3 (14), Δ CA15-3 (3) |
Fe |
70 |
65 |
56 |
62 |
Fe max (56), Δ Fe (14) |
Table 7 TMR induction in the postoperative undifferentiated ovarian cancer patient
Ribonuclease, 202U, NK activity (17%), T cell number (1468)
Albumin: 64%, α1-globulin: 3.5%
Application results
The TMR method was applied to this postoperative undifferentiated ovarian cancer patient.
The following data were obtained after TMR induction:
CEAmax: 3.1ng (ΔCEA,1.0ng, Δ indicates the maximum change in value within 48 hours after induction: normal range within under 0.9ng), ferritin (FTmax): 170ng(normal range under 65ng), ΔFT(40ng, normal range within 20ng), FT/Fe(max): 2.6, (G2: normal range under 2.0. ΔFT/ Fe: 0.6, LDH: 294 (Δ41U, normal range within 30U ), RNase (202U: normal range within 60-90U), alpha(α)1- globulin fraction: 3.5%(normal range within 2.2~2.6%): and albumin: 64%(normal range 64~72%) Table 7. Tumor markers were evaluated by the TMCA technique, reported in the Cancer in 1994,5 combined with the TMR induction technique. The more polished TMCA was reported in Cancer medicine.6 Based on the results obtained with these methods, the presence of cancer in the G2 clinical stage was estimated. Therefore, positron emission tomography (PET) and computed tomography (CT) were performed and revealed metastasis in the right axillary lymph nodes(Virchow-lymph node metastasis (+). The patient was given the herbal medicine: Sun Advance® which inhibits aerobic respiration by cancer cells,7,8 and detoxification therapy twice a week. As shown in Table 8, the patient was completely cured. As of 18 years after treatment, the patient has had no recurrence.
Date |
Oct. 1999 |
Jul-00 |
Jan. 2001 |
Feb. 2002 |
Jan. 2005 |
Jul-15 |
RNase |
202U |
147 |
111 |
99 |
99 |
|
Thymidine kinase |
|
|
|
|
|
7.7 |
Albumin (%) |
64 |
67.4 |
65.1 |
65.2 |
62.9 |
61.1 |
α-1 globulin (%) |
3.5 |
2.9 |
3 |
2.9 |
2.9 |
2.6 |
NK activity (%) |
17.8 |
24 |
|
66 |
|
|
TS risk assessment |
TS(V,G2) |
TS(V,G1) |
TS(V,G1) |
TS(IV,G0) |
TS(IV,G0) |
TS(III) |
PET scan |
(+) |
|
|
|
|
|
Table 8 The time course of the ovarian cancer patient
The presence and the size of hidden cancerous tumors can be estimated with tumor marker-release-related specific parameters with a combination treatment of vitamin A and hyperthermia.
I will express sincere gratitude to Kijima Chizuko, Dogome Miyoko, and Sugimoto Kimito.
The author declares that there is no conflict of interest.

©2018 Kobayashi. This is an open access article distributed under the terms of the, which permits unrestricted use, distribution, and build upon your work non-commercially.