Submit manuscript...
MOJ
eISSN: 2572-8520

Civil Engineering

Research Article Volume 4 Issue 4

Modeling and simulation of cadmium transport influenced by high degree of saturation and porosity on homogeneous coarse depositions

Eluozo SN,1 Oba AL2

1Department of Civil and Environmental Engineering, Gregory University Uturu (GUU), Abia State of Nigeria, Nigeria
2Department of Civil Engineering, Ken-Saro Wiwa Polytechnic Bori, Nigeria

Correspondence: luozo SN, Department of Civil and Environmental Engineering, Gregory University Uturu (GUU), Abia State of Nigeria

Received: May 11, 2018 | Published: August 24, 2018

Citation: Eluozo SN, Oba AL. Modeling and simulation of cadmium transport influenced by high degree of saturation and porosity on homogeneous coarse depositions. MOJ Civil Eng. 2018;4(4):263-267. DOI: 10.15406/mojce.2018.04.00129

Download PDF

Abstract

This paper monitors the effect from degree of saturation and porosity on the migration rate of cadmium in homogeneous coarse formation. The study expresses the rate of coarse homogeneity reflecting on the deposition of cadmium in deltaic depositions. Other studies were carried out on a particulars soil formation that could not predict comprehensive migration rate of cadmium concentration in coarse depositions. These were monitor on deltaic location were coarse deposition are predominant thus degree of saturation and porosity were observed to influences cadmium concentration in the study area. Porosity and degree of saturation were the major effect that determine their variation of cadmium concentration, the derived solution were subject to simulation, these values express linear concentration of cadmium, but with variations at different depth to phreatic bed, the study has express the influences from porosity and degree of saturation reflecting on cadmium concentration, experts in pollution transport will definitely apply this tools to monitor the formation characteristics influences on cadmium transport in deltaic depositions.

Keywords: modeling, cadmium, Transport, saturation, porosity and coarse depositions

Introduction

Experts have observed Cadmium as one of the most toxic metals with carcinogenic and tetrogenic impacts. The main foundation of Cd contamination in agricultural soils is the extensive application of mineral phosphorous fertilizers, fungicides and sewage sludge.1–3 experts has observed that Cadmium is bound to permanently charged surfaces of clay minerals, to surfaces of hydroxyl groups along the edges of clay particles, it also includes to phyllosilicate clays,4 to Fe and Al (hydro)oxides, and to phenol and carboxyl groups of soil organic matter.5 There are several Factors that pressure cadmium mobility in agricultural soils are e.g. tillage practices, duration of the cadmium– soil interaction, soil type and layering, water flow and solute transport distribution between the– macrospore and matrix domain, rain/irrigation intensity, total and active CaCO3 content, organic matter content, as well as pH value of the soil solution.6–10 It has been assumed that the movement of heavy metals requires the metal to be in the soil solution. For that reason, physical mixture through ploughing of the soil surface during repeated cultivation is the main factor that contributes to an increase in the concentration of heavy metals beneath the zone of application. The preferential paths for water flow and solute transport in the unsaturated zone of soil are the hydrologically effective (= surface vented) macrospores: biopores (e.g. earthworm, ant, and root holes), inter–aggregate pores, and desiccation cracks.6,11–15 Soil is a natural body consisting of layers (soil horizons) of mineral constituents of variable thicknesses different from the parent materials in their morphological, physical, chemical, and mineralogical characteristics.16,17–22 Soil is also a multiphase mineral and organic porous media consisting of three phases: solid, liquid and gaseous. The solid phase consists of particles of various distribution generated by partitioning of rocks by different environmental (erosion, transport, deposition), thermal and chemical processes. There are three main types of soil particles distinguished: sand, silt and clay. The relative amounts of each fraction in the soil sample, sorted according to its size (particle diameter) are presented by particle size distribution or grain size distribution.23 Soil particles are usually packed loosely, with different, even unique three dimensional spatial orientation, thus creating a soil solid structure filled with empty pores, which may be occupied by fluids – liquids or /and gases. The fraction of void space in the porous material/soil is defined by porosity ratio.24–26

Developed model

θwVCt=ΦρbρwVC2x2θwVXT=ΦρbρwVX11T (1)

Substituting solution C=XT into (1), we have

θwVXT1=ΦρbρwVX11T  (2)

θwVT1T=ΦρbρwVX11X (3)

θwVT1TΦρbρwV[X11X] (4)

θwVT1TX11X (5)

Considering when LnX0

θwVT1=ΦρbρwVX11XT=λ2(6)

θwVT1T=λ2(7)

X11X=λ2(8)

ΦρbρwV=λ2(9)

This implies that equation (10) can be expressed as:

ΦρbρwVX11X=λ2  (10)

ΦρbρwVX2X=λ2   (11)

θwVd2ydx2=λ2(12)
θwρbρwVd2ydx=λ2  (13)

θwd2ydx2=λ2(14)

d2ydx=λ2θwV(15)

d2y=[λ2θwV]dx2 (16)

d2y=λ2θwVdx2 (17)

dy=λ2θwVxdx(18)

dy=λ2θwVXdx+C1 (19)

y=λ2θwV+C1+C2 (20)

y=0 (21)

λ2θwVX2C1x+C2=0 (22)

Applying quadratic expression, we have

x=b±b24ac2a (23)

Wherea=λ2θwV, b=C1 and c=C2

X=(C1)±(C)24(λ2θwV)C22λ2θwV  (24)

X=C1+C124C2λ2θwV2λ2θwV (25)

X=C1+C124C2λ2θwV2θwV (26)

X=C1+C124C2λ2θwV2θwV  (27)

X=C1C124C2λ2θwV2λ2θwV(28)

Substituting equation (20) to the following condition and initial values condition.

t=0,C=0(29)

Therefore, X(x)=C1exemx+C2Mem2x (30)

C1CosM1x+C2SinM2x(31)

y=λ2θwV+C1+C2 (32)

C(x,t)=[C1CosM1λ2θwVx+C2SinM2λ2θwVx] (33)

But if x=vt

Therefore, equation (33) can be expressed as:

C(x,t)=[C1CosM1λ2θwVvt+C2SinM2λ2θwVvt] (34)

Materials and methods

Standard laboratory experiment where performed to monitor the rate of cadmium concentration at different formation, the soil deposition of the strata were collected in sequences base on the structural deposition at different study area, this samples collected at different location generated variation of cadmium concentration at different depth producing through the application of ASS from different strata, the experimental result are applied to compared with theoretical values for model validation
Results and discussion

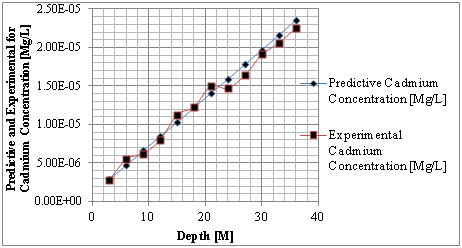
Results and discussion are presented in tables including graphical representation of cadmium concentration at different Depth and Time (Tables 1–4) (Figures 1–4).

Depth [M]

Predictive cadmium
concentration [Mg/L]

Experimental
cadmium concentration [Mg/L]

3

2.87E– 06

2.80E– 06

6

4.74E– 06

5.50E– 06

9

6.62E– 06

6.20E– 06

12

8.49E– 06

8.01E– 06

15

1.03E– 05

1.13E– 05

18

1.22E– 05

1.23E– 05

21

1.41E– 05

1.50E– 05

24

1.59E– 05

1.47E– 05

27

1.78E– 05

1.64E– 05

30

1.97E– 05

1.91E– 05

33

2.16E– 05

2.06E– 05

36

2.35E– 05

2.25E– 05

Table 1 Predictive and experimental values for cadmium concentration at different depth

Depth [M]

Predictive cadmium
concentration [Mg/L]

Experimental
cadmium concentration [Mg/L]

3

1.63E– 01

1.65E– 01

6

3.33E– 01

3.11E– 01

9

4.89E– 01

4.45E– 01

12

6.52E– 01

6.52E– 01

15

8.15E– 01

8.18E– 01

18

9.77E– 01

9.54E– 01

21

1.40E+00

1.52E+00

24

1.30E+00

1.37E+00

27

1.47E+00

1.52E+00

30

1.63E+00

1.69E+00

33

1.79E+00

1.82E+00

36

1.95E+00

2.03E+00

Table 2 Predictive and experimental values for cadmium concentration at different depth

Time Per Day

Predictive cadmium
concentration [Mg/L]

Experimental cadmium
concentration [Mg/L]

10

7.14E– 05

8.58E– 05

20

1.43E– 05

1.41E– 05

30

2.14E– 05

2.27E– 05

40

2.86E– 05

2.73E– 05

50

3.41E– 05

3.49E– 05

60

4.10E– 05

4.15E– 05

70

4.77E– 05

4.66E– 05

80

5.45E– 05

5.66E– 05

90

6.13E– 05

6.72E– 05

100

6.82E– 05

6.68E– 05

110

7.49E– 05

6.94E– 05

120

8.17E– 05

8.03E– 05

130

8.86E– 05

8.88E– 05

140

9.54E– 05

9.42E– 05

150

1.02E– 04

1.09E– 04

160

1.09E– 04

1.19E– 04

170

1.15E– 04

1.31E– 04

180

1.23E– 04

1.33E– 04

190

1.29E– 04

1.39E– 04

200

1.36E– 04

1.41E– 04

Table 3 Predictive and experimental values for cadmium concentration at different time

Depth [M]

Predictive cadmium
concentration [Mg/L]

Experimental
cadmium concentration [Mg/L]

3

3.85E– 04

3.66E– 04

6

7.71E–04

7.44E– 04

9

1.15E– 03

1.12E– 03

12

1.54E– 03

1,45E– 03

15

1.92E– 03

1.88E– 03

18

2.31E– 03

2.22E– 03

21

2.71E– 03

2.57E– 03

24

3.10E– 03

3.22E– 03

27

3.47E– 03

3.54E– 03

30

3.85E– 03

3.77E– 03

33

4.24E– 03

4.34E– 03

36

4.62E– 03

4.67E– 03

39

5.01E– 03

5.11E– 03

42

5.40E– 03

5.35E– 03

45

5.78E– 03

5.66E– 03

48

6.17E– 03

6.22E– 03

51

6.55E– 03

6.44E– 03

54

6.94E– 03

6.88E– 03

57

7.32E– 03

7.37E– 03

60

7.71E– 03

7.55E– 03

Table 4 Predictive and Experimental values for cadmium concentration at different depth

Figure 1 Predictive and experimental values for cadmium concentration at different depth.
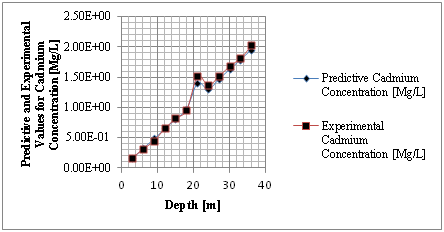
Figure 2 Predictive and experimental values for cadmium concentration at different depth.
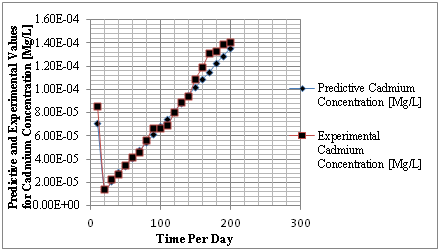
Figure 3 Predictive and experimental values for cadmium concentration at different time.
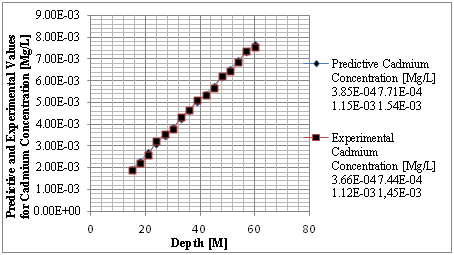
Figure 4 Predictive and experimental values for cadmium concentration at different depth.

The study from graphical representation shown in figure I express how the deposition of cadmium linearly increasing with change in depth at different depositions to the optimum rate recorded at 36m, the formation at this level experience progressive increase of concentration, these are reflected on predominant homogeneous structure of the strata, comparison between predictive and experimental values developed favorable fits, while figure two observed similar condition as exponential phase were experienced in the deposition of cadmium in different formation, the optimum values were also observed at 36 metres, comparing figure two to one, the concentration are much higher, it implies that the degree of porosity are higher than figure one. Both parameters developed favorable fits for model validation, while figure 3 developed linear increase to the optimum level recorded at 200 days, these condition implies that the system considered the migration at different time, the depositions of cadmium were observed to migrate to phreatic zone with higher concentration at two hundred days, the reality were observed from the degrees of porosities deposited at different depths, validation were observed to developed best fits between the predictive and experimental values. Figure four monitor the system at progressive transport to deeper depth, these were to determine their rate of increase or decrease in concentration, homogeneous rate of concentration were observed, but with slight heterogeneous experiences on experimental values that validated the predictive results.

Conclusion

The study has definitely defined the deposition of cadmium in homogeneous coarse formation, the structure in the study area were monitored applying insitu method of sample collection, the study express the behavior of cadmium deposition in the study location, increase in cadmium depositions were as a result of structural deposition of coarse formation, these were observed from porosity reflection rate in deltaic depositions, linear concentration were experienced in the simulation values, but variation of cadmium concentration were observed, the study has express the behavior of cadmium concentration in coarse structure, the predominant formation characteristics such as degree of saturation and porosity has express its influences on cadmium migrations. The study has evaluated the variation pressure from degree of saturation and porosity base its depositions on cadmium transport in coarse formations.

Acknowledgement

None.

Conflicts of interest

The author declares there is no conflict of interest.

References

  1. Eluozo SN. Mathematical Modeling and Simulation to Predict the Transport of Thermotolerant Influenced by Void Ratio in Soil and Water, Port Harcourt, Rivers State of Nigeria. Journal of Middle East Applied Science and Technology (JMEAST).2012a;3:182–191.
  2. Eluozo SN. Mathematical Modeling and Simulation of Salmonella Transport Influenced by Porosity and Void Ratio in Soil and Water, Eleme Niger Delta of Nigeria. Scientific Journal of Environmental Science. 201b2;(1)14.
  3. Eluozo SN. Model Prediction and Evaluation to Monitor the Behaviour of Thermotolerant in Homogeneous Formation in Isiokpo, Rivers State of Nigeria: Scientific Journal of Environmental Science. 2012c;1:(4).
  4. Bolton KA, Evans LJ. Cadmium adsorption capacity of selected Ontario soils. Can J Soil Sci. 1996;76(2):183–189.
  5. Eriksson JE. The influence of pH, soil type and time on adsorption and uptake by plants of Cd added to the soil. Water, Air, and Soil Pollution. 1989;48(3–4):317–335.
  6. Andreini MS, Steenhuis TS. Preferential paths of flow under conventional and conservation tillage. Geoderma. 1990;46:85–102.
  7. Camobreco VJ, Richards BK, Steenhuis TS, et al. Movement of heavy metals through undisturbed and homogenized soil columns. Soil Science. 1996;161(11):740–750.
  8. Eluozo SN. Predictive Model to Monitor the Rate of heavy Metal in soil and Water in Port Harcourt; Rivers State of Nigeria. Journal of Middle East Applied Science and Technology (JMEAST). 2012d;3:166–181.
  9. Eluozo SN. Mathematical Model to Predict Klebsiella Pneumonae Transport influenced by Porosity and Void Ratio in Shallow Aquifers. ARPN Journal of Earth Science. 2012e;1(2):1–5.
  10. Eluozo SN. Modeling of Streptococci on Homogeneous coarse Sand influenced by Porosity and Permeability in Coastal Area of Degema. ARPN Journal of Earth Science. 2012;f1(2).
  11. Czarnes S, Hallett PD, Bengough AG, et al. Root– and microbial– derived mucilages affect soil.structure and water transport. European Journal of Soil Science. 2000;51(3):435–443.
  12. Lichner L, Vogel T, Cipáková A, et al. Parameterization and modelling of cadmium transport in soils under conditions of climate change international Scientific Conference, Poľana nad Detvou, Slovakia, Poland; 2007.
  13. Eluozo SN. Modeling and Simulation of Dissolved Lead in Ground water influenced by porosity and seepage velocity in Homogeneous formation; Scientific Journal of Pure and Applied Science. 2012h;1(3).
  14. Eluozo SN. Mathematical Modeling to Predict the Transport of Dissolved Arsenic in Ground Water influenced by seepage Velocity. Scientific Journal of Pure and Applied Science. 2012i;1(2).
  15. Eluozo SN. Modeling and Simulation of Enteric– virus Transport in Deltaic Environment; Rivers State of Nigeria, Scientific Journal of Pure and Applied Science. 2012j:1(2).
  16. Birkeland PW. Soils and Geomorphology. 3rd ed. Oxford University Press, New York; 1999.
  17. Eluozo SN. Predictive Model to Monitor the Pressure of Void Ratio on the Transport of E. coli in Alluvium Deposition in Coastal Area of Buguma, Rivers State of Nigeria; International Journal of Innovation in Engineering and Management. 2012g;1(1).
  18. Eluozo SN. Modeling of Phreatic aquifers on E. coli Transport Influenced by Preconsolidation and Compressibility of Soil. International Journal of Engineering and Technology. 2013a;2(1):1–11.
  19. Eluozo SN. Nwaobakata C. Predictive Models to Determine the Behaviour of Plastic and Liquid Limits of Lateritic Soil for Road Construction at Egbema, Imo State of Nigeria. International Journal of Engineering and Technology, Science Publishing Corporation.2013b;2(1):25–31.
  20. Eluozo SN, Ademiluyi JO. Establishment of Porosity and Permeability Model Correlation to Validate E. coli Transport to Groundwater Aquifers; Rivers State of Nigeria. International Journal of Engineering and Technology. 2013c;2(1):17–24.
  21. Eluozo SN. Effect of formation characteristics on hydraulic conductivity in unconfined bed in Etche Rivers State of Nigeria: Scientific Journal of Pure and Applied Science. 2013d;2(1).
  22. Eluozo SN. Modeling and Simulation of Fungi Transport in Waste Dump Site in Obio/Akpor, Rivers State of Nigeria. Scientific Journal of Review. 2013e;2(1).
  23. Jillavenkatesa A, Dapkunas SJ, Lin– Sien Lum. Particle Size Characterization. NIST Special Publication, 2001.
  24. Orzechowski Z, Prywer J, Zarzycki R. Mechanika płynów w inżynierii ś ro– dowiska. Wydawnictwa Naukowo– Techniczne, Warszawa, Poland; 1997.
  25. Eluozo SN. Modeling the Transport of Shigellae in Silty and Fine Sand in Shallow Aquifers in Coastal Area of Bonny, Niger Delta; Rivers State of Nigeria, Scientific Journal of Pure and Applied Science.2012k;1(2).
  26. Eluozo SN, Amagbo LG, Afiibor BB. Permeability and void Ratio Influence on Heterogeneous Deposition of Chlorobium Transport in Coarse Formation, Applying Numerical Modeling and Simulation. MOJ Applied Bionics and Biomechanics. 2017;1(5):1–7.
Creative Commons Attribution License

©2018 Eluozo, et al. This is an open access article distributed under the terms of the, which permits unrestricted use, distribution, and build upon your work non-commercially.