MOJ
eISSN: 2572-8520


Research Article Volume 5 Issue 1
1Department of Civil Engineering, Engineering and Architecture Faculty, Turkey
2Department of Materials Science and Engineering, Institute of Science, Turkey
Correspondence: Selçuk Memiş, Department of Civil Engineering, Engineering–Architecture Faculty, Kastamonu University, 37150 Kastamonu, Tel 090 366 280 29 25
Received: February 15, 2019 | Published: February 26, 2019
Citation: Yaprak H, Alnkaa A, Memis, et al. Effects of different curing conditions on the properties of geopolymeric mortar. MOJ Civil Eng. 2019;5(1):45-50. DOI: 10.15406/mojce.2019.05.00148
Background: As a result of industrialization, a lot of research is being done on alternative procedures for the production of normal Portland cement, which has an important role in reducing this emission from the construction sector in recent years, due to the increased CO2 emissions and environmental pollution caused by it. Geopolymer concrete studies, which are known to cause less CO2 emissions as a result of these researches in the construction sector, come to the fore. The aim of this study was to investigate the effect of different curing conditions on three different types of waste material (fly ash (FA), slag (GGBFS) and glass powder (GP) plus ) in geopolymer concrete. Alkaline activators based on sodium hydroxide (NaOH) and sodium silicate (Na2SiO3) were used as binders. The prepared samples were subjected to two different curing conditions which are the subject of our research. These curing conditions are respectively; in the first method, steam curing (SC) at 85°C for 12 hours, followed by standard cure at 20±3°C until the test date, and normal water cure (WC) based on curing at 20°C in the second method. In addition, the mixture groups were created by considering the different waste materials rate known as 0,1,2,3,4 and 5. Studying and investigating the low carbon dioxide emissions, compressive strengths, high flexural, practically low shrinkage, density, economic savings, reducing the waste material, are the main benefits of this paper. When the results of this study are examined that using FA, GP, and GGBFS positively affected the specimens with water–cured, while GGBFS was negatively affected. And also under steam–cured conditions (SC) all specimens showed higher 2–days strength, while later compressive strengths were either higher or lower than those in water–cured conditions (WC), depending on the proportion of the waste material type.
Keywords: fly ash, geopolymer mortar, sodium silicate, sodium hydroxide, slag, compressive, flexural, strength
Despite an increase in cement production by about 3% annually, the demand for Portland cement (PC) has now reached more than 1.6 billion tons per year worldwide as the product is still regarded as the essential material in industrial concrete. According to the global demand for Portland cement (PC), the forecasts show that will increase over the next 40 years.1 However, ordinary was calculated Portland cement (OPC) is a major enhancer of CO2 release into the atmosphere. In 2016, this amount is at 1.45±0.20 Gt CO2; in other words, roughly 8% of the entire anthropogenic CO2 emission.2 Apart from this, SO3 and NOx are a by product of emissions from the cement industry, leading to acid rain and the greenhouse effect.3,4 There are also other by–products, about 5% to 10%, that go into the atmosphere along with these gases in the form of dust from the dryers, factories, furnaces, coolers and transportation facilities. In addition, the energy demands about 1700–1800 MJ/tons clinker consumes 1500 Kg of raw materials.5,6 In this respect, waste disposal is the safe and effective removal of sewage and another major challenge facing industries. Sludge and large quantities of fly ash are produced during the combustion of coal. In 2010, the amount of the fly ash produced annually was about 780x106 tons.7,8 This ash is disposed in landfills in suitable locations, which is not exactly the best option due to high cost of operations as well as potential future consequences associated with landfills of this kind.9 More specifically, the main risk for ash landfilling is ground water contamination caused by elevated levels of toxic metals underground. To avoid this, certain procedures should be followed to dispose hazardous waste, such as controlled release into ground water and seepage water through safe chemical encapsulation and structural stability with respect to the current environmental settings.8,10 As result of these environmental problems, the scientific community has undertaken to seek new technologies, processes or materials with regard to the construction industry and as alternative materials, thereby reducing the amount of cement used in blends. In this respect, there are initiatives to utilize a new cement less binder material based on by–products as FA, slag or burned clay,11 and other alumino–silicate materials. These new materials are likely to replace OPC and be regarded as the new binder materials by alkali activation while generating less carbondioxide than OPC. Based on the estimates, alkali–activated concrete will produce 70% less CO2 than OPC and involve approximately 60% less energy consumption than that.8 Materials that are activated with alkali can be designed to have superior properties compared to OPC, better resistance to acid and sulfate, better heat resistance,12–14 less drying shrinkage and higher value of compressive strength.2 On top of these, reducing the CO2 emission by 26–45% by replacing OPC with no adverse economic effects is the main benefit of geopolymer concrete.15,16 When fly ash and glass powder are applied in the right proportions using a curing method, the mixture can decrease the cost without affecting the strength of the geopolymer mortar.17 In line with these developments, the mixture of slag and fly ash binders has also received a lot of attention in an attempt to create more advanced geopolymer material and many studies are being conducted in order to gain new perspectives as to their coexistence in the same binding system and to find an optimum design ratio between these components.18 In the present study, we investigate the impact of (slag and fly ash+glass powder) on the strength properties of water–cured and steam–cured (slag/fly ash+glass powder) blends activated with sodium hydroxide and sodium silicate.19,20
Ground granulated blast–furnace slag (GGBFS)
In this study, the GGBFS was provided from the Ereğli Iron–Steel Factory (Oyak) in Turkey with a specific gravity (S.G) of 2.81g/cm3 and a fineness of 4250cm2/g. The chemical composition is shown in Table 1.
Fly ash (FA)
The study was conducted at the Çatalağzı Thermal Power Station (Çatalağzi, Zonguldak–Turkey). Table 1 shows the chemical properties of the FA. The value of CaO content is less than 10%, while the value of SiO2+Al2O3+Fe2O3 exceeds 70 %. Then, the current FA is classified as class F fly ash. The specific gravity of the FA was 2.39g/cm3 and the fineness was 6000cm2/g.
Oxide |
SiO2 |
Al2O3 |
Fe2O3 |
CaO |
MgO |
SO3 |
K2O |
Na2O |
GGBFS |
36.7 |
5.2 |
0.98 |
32.61 |
10.12 |
0.99 |
0.76 |
0.42 |
FA |
61.81 |
26 |
7.01 |
1.77 |
2.56 |
0.31 |
0.99 |
2.43 |
GP |
72.66 |
1.57 |
0.39 |
11.41 |
1.24 |
0.07 |
0.54 |
12.89 |
Table 1 The chemical composition of GGBFS, GP and FA (%)
Waste glass (GP)
Table 1 shows the chemical composition of the glass powder. The value of CaO, Na2O contents are about 11% and 13%, respectively, while the value of SiO2+Al2O3+Fe2O3 exceeds 70 %. A ball mill is used to waste glass grounded, which to produce finer ash, will be grounded by a small mill. The mean diameter of the particle size is 13μm at a density of 2.56 g/cm3 and a fineness of 5320cm2/g.
Standard aggregate
Table 2 shows the sieve analysis produced by Limak Cement. All the aggregate was used standard aggregate in accordance with the TS EN 196–1 at the maximum size of 2mm.
Size of sieve (mm) |
Remaining cumulative (%) |
2 |
0 |
1.6 |
7±5 |
1 |
33±5 |
0.5 |
67±5 |
0.16 |
87±5 |
0.08 |
99±1 |
Table 2 Sieve analysis19
Alkali activator
As binder materials used sodium silicate and sodium hydroxide that is an alkali activator, where the modulus of sodium silicate Na2SiO3/NaOH is equal to 1 and the concentration of sodium hydroxide is 16M (molarite).
Preparation of specimen mixtures
The aim is to investigate blended slag, glass powder and fly ash alkali–activated mortars with a water ratio (S/B) of 0.33 to the binder. In conformity with TS–EN 196–1, the standard aggregate, GGBFS, GP, FA, water, Na2SiO3, and NaOH are used in the production of these geopolymer mortars. In addition, the amount of the binder GGBFS+FA+GP is kept constant at an 810.5g/1000g standard aggregate. Table 3 reveals the ingredients of the mortar mixtures. In the first type, which is the water–cured (WC) series, the specimens were immersed in the water at 20°C for 28 days; whereas, in the second type, that is the steam cured (SC) series, the specimens were SC at 85°C for 12 h.
Mix |
GGBFS |
FA |
GP |
No |
% |
% |
% |
0 |
100 |
0 |
0 |
1 |
90 |
5 |
5 |
2 |
90 |
0 |
10 |
3 |
90 |
10 |
0 |
4 |
80 |
10 |
10 |
5 |
70 |
15 |
15 |
Table 3 Mortar mixture ingredients
Casting of the specimens
Table 3 shows the mix proportions as a predefined order, followed by mixing in a Hobart mixer (Figure1). For the purpose of gaining added homogeneity to allow smooth SiO2 and NaO2 release in the mortar, the water and sodium hydroxide were combined in a glass jar up to the point of their complete dissolution. The mixing process is shown in Figure 2.
1: FA+GGBS+GP 2:Na2SiO3+NaOH 3:Standard aggregate 4:Admixture(CHRYSO)+ water 5: Geopolymer mortar
Compressive and flexural strength
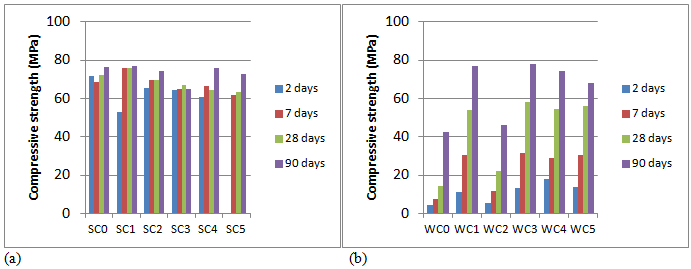
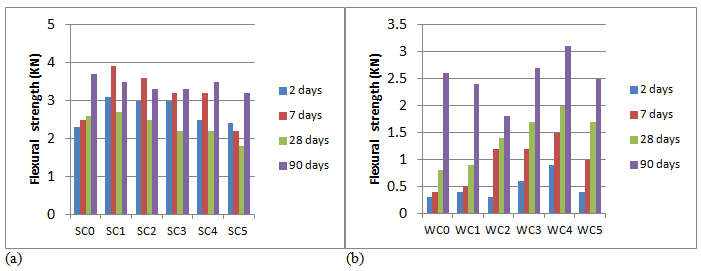
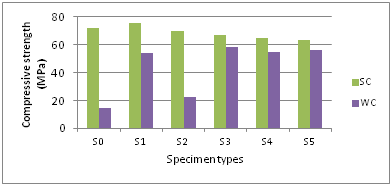
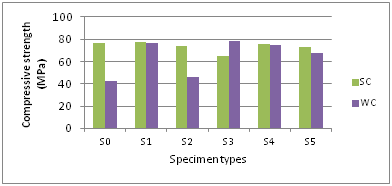
The specimen sizes were 4x4x16cm for compressive strength testing with a 2.4KN/s loading rate. Both the compressive and flexural strength of the specimens tested according to TS–EN196–1. Furthermore, compressive strength and flexural strength were measured at hardened state at 2, 7, 28 and 90 days. The testing machine and apparatus utilized in the compressive and flexural strength testing and some of the specimens appear in Figure 3 & Tables 4–7.The geopolymer mortar with water to binder ratio W/B is 0.33 where the effect of curing conditions on compressive strength is shown in Figure 4A. The steam curing results after 7 days are much higher compared to the strength than in the case of water curing at 28 days. Respectively, the values of the compressive strengths corresponding to steam curing for SC0–SC1–SC2 were 72.1 MPa, 75.8 MPa, and 69.7 MPa, as shown in Figure 4. Furthermore, these values were 5 times, 1.4 times and 3.1 times as much as those after water curing for WC0, WC1, and WC2, respectively. Moreover, it can be noted from Figure 4A that the compressive strength of both of these mortar types within 2 days increased to the maximum value before gradually decreasing. Figure 4(A &B) shows the compressive strength of the water cured specimens for (WC1, WC3, WC4, and WC5) after 28 days, where the values are either equal or have insignificant differences compared to steam curing. Based on Figure 4A, the compressive strength values of all mortars decrease but remain close to each other in between 64.6 and 63.2 MPa, when (the slag and fly ash+glass powder ratio) ranges between 80/20 to 70/30. From Figure 4B, it can be observed that the GGBFS/FA ratio is a very important factor regarding the compressive strength values of mortars under water–cured conditions. At 90 days of testing, the compressive strength value was 78.2 MPa when the proportion of the ingredient mortar was 90%, 10%, and 0% for GGBFS, FA, and GP, respectively. Furthermore, as can be seen from the Figure 4, the compressive strength values of the S1, S3, S4 and S5, and those of all these geopolymer mortars with WC and SC remained close to each other and between 65 MPa and 78.2 MPa. Generally, the test results indicate that there is an equal crack in all the four exposed faces with slight or no damage to the top and bottom contact faces with the platens. These cracks appeared in a vertical zigzag pattern with a failure pattern as in Figure 3. Figure 5(A &B) shows that the flexural strength of the steam–cured geopolymer (SC1, SC2, SC3) after 7 days increased to a maximum value before a gradual decline afterward. The flexural strengths values after 7 days were 3.9 KN, 3.6 KN and 3.2KN, respectively, while after 28 days were 2.7KN, 2.5KN and 2.2KN. The flexural strength results under water–cured conditions for 28 days (CS4) recorded the maximum value 2KN. Overall, these evaluations reveal that the steam curing conditions resulted in a higher early age (2 days) strength, while water curing developed longer–term strength in the specimens. According to Figure 6, the 28–day specimens presented greater compressive strength in the case of SC geopolymer mortar compared with the WC geopolymer mortar. In addition, it can be observed that the strength values of the 7–day SC geopolymer specimens are greater than that of 28–day WC specimens. It has to be noted that an increase in the FA content in the mixture has a beneficial influence on the compressive strength up to 70/30 GGBFS and FA+GP ratio under WC conditions. In the meantime, reduced amounts of FA appear to have a detrimental or counter–productive effect on the mortar. When comparing maximum compressive strength values achieved under each curing condition, the WC specimens showed higher values than the SC ones at the end of their respective curing period, as can be seen in Figure 7.

Figure 4B The evolution of compressive strength according to mortar mixture ingredients ratio for (a) steam curing (SC) and (b) water curing (WC)

Figure 5 The evolution of flexural strength according to mortar mixture ingredients ratio for (a) steam curing and (b) water curing at 200℃

Figure 6 The relationship between specimen types and compressive strength for SC (steam-cured) and WC (water-cured) specimens at 28 days.
|
Compressive results for steam curing (SC) MPa |
|
|
|||
Days |
SC0 |
SC1 |
SC2 |
SC3 |
SC4 |
SC5 |
2 |
65.5 |
71.9 |
52.8 |
65.3 |
64.4 |
60.8 |
7 |
68.4 |
75.7 |
69.6 |
65.1 |
66.3 |
61.7 |
28 |
72.1 |
75.8 |
69.7 |
67 |
64.6 |
63.2 |
90 |
76.3 |
77.1 |
74.2 |
65 |
75.6 |
72.9 |
Table 4 The compressive strength results of steam curing (SC)
|
Compressive results for water curing (WC) MPa |
|
|
|||
Days |
WC0 |
WC1 |
WC2 |
WC3 |
WC4 |
WC5 |
2 |
4.1 |
10.9 |
5.2 |
13.4 |
17.8 |
13.9 |
7 |
7.5 |
30.2 |
11.4 |
31.3 |
28.8 |
30.6 |
28 |
14.4 |
54.1 |
22.2 |
58.3 |
54.7 |
56 |
90 |
42.7 |
76.8 |
46.2 |
78.2 |
74.4 |
67.9 |
Table 5 The compressive strength results of water curing (WC)
|
Flexural results for water curing (WS) KN |
|
|
|
||
Days |
SC0 |
SC1 |
SC2 |
SC3 |
SC4 |
SC5 |
2 |
2.3 |
3.1 |
3 |
3 |
2.5 |
2.4 |
7 |
2.5 |
3.9 |
3.6 |
3.2 |
3.2 |
2.2 |
28 |
2.6 |
2.7 |
2.5 |
2.2 |
2.2 |
1.8 |
90 |
3.7 |
3.5 |
3.3 |
3.3 |
3.5 |
3.2 |
Table 6 The flexural strength results of steam curing (SC)
|
Flexural results for water curing (WC) KN |
|
|
|
||
Days |
WC0 |
WC1 |
WC2 |
WC3 |
WC4 |
WC5 |
2 |
0.3 |
0.3 |
0.3 |
0.3 |
0.3 |
0.3 |
7 |
0.4 |
0.4 |
0.4 |
0.4 |
0.4 |
0.4 |
28 |
0.8 |
0.8 |
0.8 |
0.8 |
0.8 |
0.8 |
90 |
2.6 |
2.6 |
2.6 |
2.6 |
2.6 |
2.6 |
Table 7 The flexural strength results of water curing (WC)
Water absorption
The specimens were dried in an oven for 24 hours in 105℃ and later, placed in a desiccator to cool. In the water–absorption test, the specimens are weighed (W2) immediately upon cooling. Generally speaking, 23°C for 24hours until equilibrium was the condition emerged in water at agreed upon conditions. Specimens were removed, patted dry with a lint–free cloth and weighed (W1).
Where:
W1= weight of specimen after immersion in water for 24hours
W2= Weight of specimen after oven drying at 100oC for 24
Table 8 & Figure 7(A &B) show the results of the water absorption test at 28 days, based on which water absorption is 8.1% for (SC0) followed by a significant increase to 9.29% for SC2, whereas this value drops to 5.45% for SC5. The results show that porosity and water absorption are significantly influenced by the fineness and shape of the slag, fly ash and glass powder precursors. The low value of water absorption in the case of the geopolymer mortar can be attributed to the fineness of the fly ash precursor (6000cm2/g) compared to that of the slag precursor (4250cm2/g) and glass powder precursor (5320cm2/g) as suggested by Neville. These results imply that increased fineness affects the distribution of the material within the specimen and fills the cracks between the aggregates that case of less water absorption. Raising FA and GP leads to a reduction of water absorption as shown in Figure 7(A &B). In fact, it’s the steam–cured condition, while was observed in water cured condition when increasing FA and GP, lead to increase absorption water coefficient. In the Figure 8(A &B) shows the effects of absorption on compressive strength, where water absorption under SC and WC has no clear relationship with compressive strength. For this reason, the strength of concrete cannot be assessed based on the degree of water absorption.

Figure 7A The relationship between specimen types and compressive strength for SC (steam-cured) and WC (water-cured) specimens at 90 days.

Figure 8 The relationship between water absorption and compressive strength for (a) steam-cured (SC) and (b) water-cured (WC) specimens at 28 days.
Mixture |
Absorption. |
Absorption |
|
for SC |
for WC |
0 |
8.102 |
6.212 |
1 |
5.451 |
6.838 |
2 |
9.296 |
7.591 |
3 |
6.15 |
5.27 |
4 |
6.304 |
7.223 |
5 |
5.639 |
8.318 |
Table 8 Water absorption test
This study aimed to describe the importance and the special requirements of waste material to be used in geopolymer mortar. The results obtained address the issue with the purpose to a) obtain a mortar that satisfies the optimal grout property requirements, and b) the degree of effectiveness related to physical and mechanical characteristics and depending on the curing conditions, steam or water. Accordingly, we analyzed these values with alkali–activated, GGBFS, GP and FA blend mortars mixed with hydroxide sodium and silicate sodium. The experimental results offered the outcomes as follow:
Hasbi Yaprak conceived and designed the experiments; Abdoslam Alnkaa and Gökhan Kaplan performed the experiments; Hasbi Yaprak and Selçuk Memiş analyzed the data; Selçuk Memiş and Abdoslam Alnkaa wrote the paper.
The authors declare there is no conflicts of interest.

©2019 Yaprak, et al. This is an open access article distributed under the terms of the, which permits unrestricted use, distribution, and build upon your work non-commercially.