MOJ
eISSN: 2471-139X


Research Article Volume 3 Issue 1
Department of Human Anatomy & Embryology, Faculty of Medicine, Zagazig University, Egypt
Correspondence: Marwa Sabry, Department of Human Anatomy & Embryology, Faculty of Medicine, Zagazig University, Egypt, Tel 1229197700
Received: April 19, 2016 | Published: January 26, 2017
Citation: Rahm MAM, Atty YHA, Rahman MMA, et al. Structural changes induced by gibberellic acid in the renal cortex of adult male albino rats. MOJ Anat Physiol. 2017;3(1):21–27. DOI: 10.15406/mojap.2017.03.00080
Background: Plant growth regulators (PGRs) are not nutrients, but chemicals that promote and influence growth, development and differentiation of cells and tissues of the plant. Gibberellic acid (GA3) is one of the PGRs, which is widely used to increase plant size, production and plants availability all the year. However, PGRs must be used cautiously to decrease its probable toxicity on some body organs including the kidney.
Materials and methods: 40 adult male albino rats were divided equally into two groups.
Results: H&E-stained sections of subgroup IIa revealed distended glomeruli, obliterating Bowman's spaces. Distortion of the renal tubules, areas of hemorrhage and congested blood capillaries were noticed. Subgroup IIb revealed shrinkage of many glomeruli with marked widening of Bowman's space. Some tubular changes were detected in the form of dilatation, tubular lumens containing exfoliated cells and hyaline casts. PAS-stained sections of treated subgroups showed a weak PAS reaction in the brush borders of the proximal convoluted tubules compared to control subgroups. Masson's trichrome-stained sections of treated subgroups revealed many collagen fibers in the renal interstitium around renal corpuscles and tubules in comparison with control subgroups. Biochemical analysis showed that the highest levels of serum urea and creatinine are present in the subchronic group. Morphometrical analysis showed that the thickness of Bowman's space, diameter of convoluted tubules and number of inflammatory cells are significantly increased in the treated groups when compared with control groups.
Conclusion: The study implied that administration of gibberellic acid induced toxic effects on the renal cortex. So, occupational and environmental exposure to gibberellic acid should be limited.
Keywords: structural changes, gibberellic acid, renal cortex, plant growth regulators
Many chemicals are currently used in agriculture nowadays. One of these chemicals is the plant growth regulators. They are also known as phytohormones or plant growth hormones. Their use began in the 1930.1 Gibberellic acid is a type of the plant growth hormones. Plants produce these hormones naturally through biosynthesis as they grow, ensuring that they have the hormones which they need to develop normally. These hormones can also be applied to plants by gardeners and farmers to achieve specific desired outcomes.2 Gibberellic acid is widely used in many countries including Egypt. Little is known about its hazardous effects in mammals as well as human health.3
Hazards of these regulators placed into the environment may soon exceed those of insecticides.4 Gibberellins are one of the six major classes of plant growth regulators according to the American Society of Agricultural Science. The World Health Organization (1990) classified gibberellic acid as a plant growth regulators related to pesticides, they are widely employed in agriculture.1 Gibberellic acid is one of the most active hormones of gibberellins. It affects many mechanisms of plant growth including stem elongation by stimulating cell division and elongation, fruit development and breaking dormancy and seed germination.5 If gibberellic acid or one of its metabolites is applied to dwarf varieties of peas, broad beans or maize, growth is greatly accelerated.6 However, several studies demonstrated that, the chronic consumption of gibberellic acid increased tumor formation and oxidative stress, hepatocellular carcinomas in 16% of the animals.7 Also, it was shown that gibberellic acid induced breast and lung adenocarcinomas in mice.8 Gibberellic acid was found to induce chromosomal aberrations in lymphocytes of humans9 and mice.10 The kidney is one of the common target organs for toxicity. It extracts and concentrates toxic substances due to its large blood flow (about 20% of cardiac output), so glomerular, tubular and renal interstitial cells frequently encounter significant concentration of toxins and their metabolites, which can induce adverse changes in function and structure of the kidney.11
Chemicals
Experimental animals
This study was carried out on 40 adult male albino rats weighing (150-200gm). They were obtained from the animal house of scientific and medical research center, Zagazig University (ZSMRC). Before commencing the experimentation, all animals were subjected to 2weeks period of passive preliminaries in order to adapt themselves to their new environment. They were maintained on a standard diet and water as available ad libitum according to Ethical Committee of Animals (IRB).
Grouping of animals
The rats were classified into two groups:
Control group (Group I): 20 animals subdivided into two equal subgroups ten rats each.
Subgroup Ia (control –ve): Rats ingested only regular diet and distillated water for 2months.
Subgroup Ib (control +ve): Rats ingested vehicle for gibberellic acid (1ml of 1N NaOH added to 1000ml of tap water) orally 5days/week for 2months.12
Treated group (group II): 20 animals ingested gibberellic acid. It was given orally by gastric tube 5days/week in a dose of 75 mg of gibberellic acid dissolved in 1ml of 1 N NaOH and then diluted with 1000ml tap water to obtain 75 ppm gibberellic acid. It was accepted that 7-28days of exposure for subacute toxicity and 28-90days for subchronic toxicity.12
The treated group was further subdivided into two equal subgroups ten rats each.
Subgroup IIa (subacute toxicity): Rats ingested gibberellic acid for 2weeks.
Subgroup IIb (subchronic toxicity): Rats ingested gibberellic acid for 2months.
The animals were anaesthetized by intraperitoneal injection of phenobarbiton. Venous blood samples were obtained from animals by means of capillary glass tubes from the retro-orbital plexus. About 2ml of blood was allowed to perculate into a centrifuge tube and incubated at 37˚C until blood clotted then centrifuged to separate the serum. The samples were maintained at (-20˚C) to be used for estimation of kidney function tests in (ZSMRC). The animals were sacrificed and their kidneys were dissected out and processed for histological study.
Histological analysis
For light microscope examination, the specimens were immediately immersed in 10% formol saline for 48hours to be processed and embedded in paraffin, processed for the preparation of 5u. thickness sections for haematoxylin and eosin (H & E), Periodic Acid Schiff (PAS) and Masson’s trichrome stain.13
Biochemical analysis
Estimation of serum urea and creatinine has been carried out using kit of biomerieux France.
Morphometric analysis
Sections stained with haematoxylin and eosin were morphometrically analyzed by using image analyzer computer system. Data were obtained using Leica Qwin 500 Image Analyzer Computer System (England) in the image analysis unit in Histology and Cell Biology Department, Faculty of Medicine, Cairo University.
The thickness of Bowman's space of renal corpuscles and the diameter of convoluted tubules were estimated by using the measuring field menu in haematoxylin and eosin slides in random microscopic areas under 200 high power fields. A mean of 15 readings was estimated from 5 serial sections from slides of each animal in each group. The inflammatory cells in the interstitial tissue were counted in haematoxylin and eosin slides under 200 high power fields. The number of cells was assessed by counting all nuclei of the blue stained cells.
Statistical analysis
Statistical differences between the groups were tested by analysis of variance (ANOVA) (F test) and LSD test. All analyses were done with SPSS software (version 16). For all the mentioned statistical tests, the threshold of significance is fixed at 5% level (P-value). P value of >0.05=Non Significant (NS). P value of <0.05=Significant (*). P value <0.001= Highly Significant (**). The smaller the P-value obtained the more significant are the results.
Histological results
Group I: (control group): Haematoxylin and eosin- stained sections from the control subgroups (Ia, Ib) showed that the renal cortex is formed of renal corpuscles and tubules. Renal corpuscle is formed of glomerulus surrounded by Bowman’s capsule. Distal convoluted tubules had wider lumen than proximal convoluted tubules. The distal tubules are lined by small cuboidal cells. Proximal convoluted tubules had narrow lumen and lined by cuboidal cells (Figure 1). PAS stained sections showed strong positive reaction in the basement membranes of Bowman's capsules and convoluted tubules. Strong positive reaction in the brush border of proximal convoluted tubules was seen Figure 2. Masson’s trichrome stained sections showed few collagen fibers in the renal interstitium around renal corpuscles and tubules Figure 3.

Figure 1 A photomicrograph of a section from the renal cortex of a control adult albino rat showing glomerulus (G) surrounded by Bowman’s space (BS). Proximal (PT) and distal (DT) convoluted are also seen. (H & E X 400).
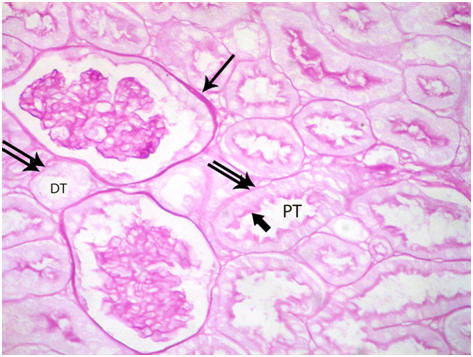
Figure 2 A photomicrograph of a section from the renal cortex of a control adult albino rat showing strong PAS positive reaction of Bowman’s capsule (arrow) and basement membrane (double arrow) of the proximal convoluted tubules (PT) and distal convoluted tubules (DT). The brush border of the proximal tubule shows also a strong reaction (thick arrow). (PAS X 400).
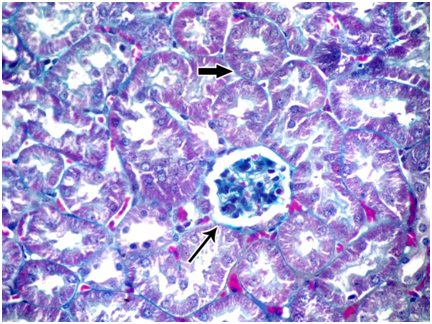
Figure 3 A photomicrograph of a section from the renal cortex of a control adult albino rat showing few collagen fibers around the renal corpuscle (thin arrow) and in between tubules (thick arrow). (Masson's trichrom X 400).
Subgroup IIa: (subacute toxicity): In the renal cortex of this group, H & E-stained sections showed hyper-cellularity of the glomerulus with proliferation of mesengial cells, areas of hemorrhage and exfoliated nuclei into the lumen of tubules were observed (Figure 4). Bowman’s space showed deposition of hyaline material. Vaculations in the epithelial lining of the tubules and inflammatory cells infiltrate in between tubules were also observed Figure 5. PAS-stained sections showed a strong positive reaction in the Bowman's capsules and the basement membranes of tubules. Variable PAS reactions in the brush borders of tubules were also seen. Positive PAS reaction is seen at the brush borders of the tubular cells and negative in other areas Figure 6. Masson’s trichrome stained sections showed some collagen fibers in the renal interstitium around renal corpuscles and tubules Figure 7.

Figure 4 A photomicrograph of a section from the renal cortex of adult albino rat treated with gibberellic acid for two weeks showing hyper cellularity of the glomerulus (G) with proliferation of mesengial cells (thick arrows). Exfoliated nuclei into the lumen of tubules (arrow heads) and areas of hemorrhage (H) are also observed. (H & E X 400).
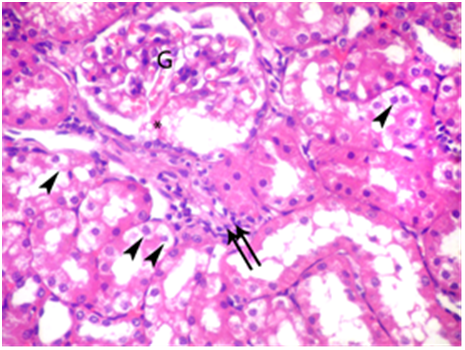
Figure 5 A photomicrograph of a section from the renal cortex of adult albino rat treated with gibberellic acid for two weeks showing distended glomerulus (G) with deposition of hyaline material in Bowman’s space (asterisk). Vaculations in the epithelial lining of the tubules (arrow heads) and inflammatory cells infiltrate in between tubules (double arrows) are also observed. (H & E X 400).

Figure 6 A photomicrograph of a section from the renal cortex of adult albino rat treated with gibberellic acid for two weeks showing strong PAS positive reaction of Bowman’s capsule (arrow) and the basement membrane of the tubules (double arrow). Variable PAS reaction of the brush borders of the tubular cells, positive PAS reaction is seen at the brush borders of the tubular cells (thick arrows) and negative in other areas (asterisk). (PAS X 400).
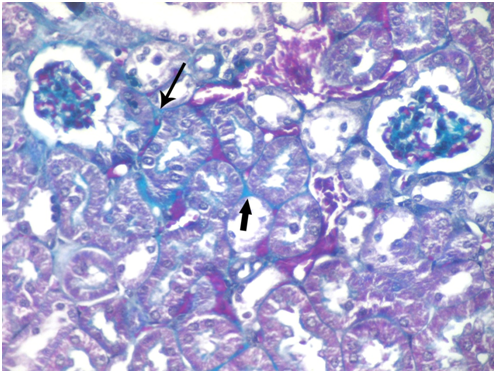
Figure 7 A photomicrograph of a section from the renal cortex of adult albino rat treated with gibberellic acid for two weeks showing some collagen fibers around the renal corpuscle (thin arrow) and in between tubules (thick arrow). (Masson's trichrom X 400).
Subgroup IIb: (subchronic toxicity): Haematoxylin and eosin- stained sections showed small sized glomerulus. The tubules were disorganized and widely surrounded by interstitial hemorrhage Figure 8. Degenerated glomerulus was also seen. The lumen of tubules showed homogenous acidophilic material and desquamated cellular debris Figure 9. PAS-stained sections showed weak reaction in Bowman's capsule and basement membranes of tubules. Negative reaction in the brush borders of tubules was also seen Figure 10. Masson’s trichrome stained sections showed many collagen fibers in the renal interstitium around renal corpuscles and tubules Figure 11.
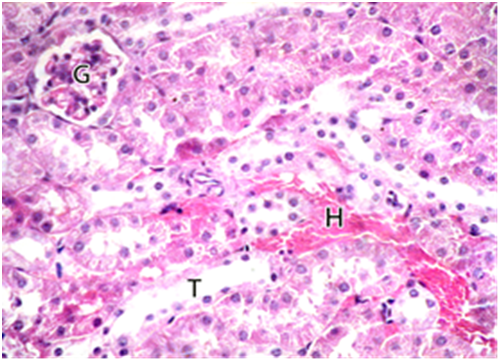
Figure 8 A photomicrograph of a section from the renal cortex of adult albino rat treated with gibberellic acid for two months showing small sized glomerulus (G). The tubules were disorganized and wide (T) surrounded by interstitial hemorrhage (H). (H & E X 400).

Figure 9 A photomicrograph of a section from the renal cortex of adult albino rat treated with gibberellic acid for two months showing degenerated glomerulus (G), dilated tubule (T) with thinning in the epithelial lining (arrow). The lumen of tubules showed homogenous acidophilic material (asterisk) and desquamated cellular debris (arrow head). (H & E X 400).
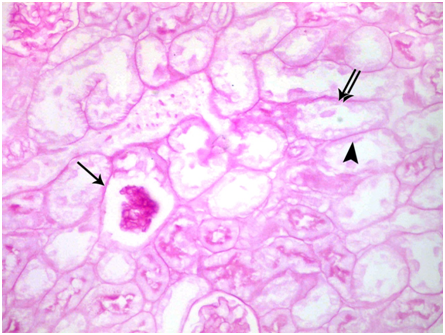
Figure 10 A photomicrograph of a section from the renal cortex of adult albino rat treated with gibberellic acid for two months showing weak positive PAS reaction of Bowman’s capsule (arrow) and basement membrane of the tubules (double arrows). Negative PAS reaction at the brush borders of tubular cells (arrow head) is also observed. (PAS X 400).
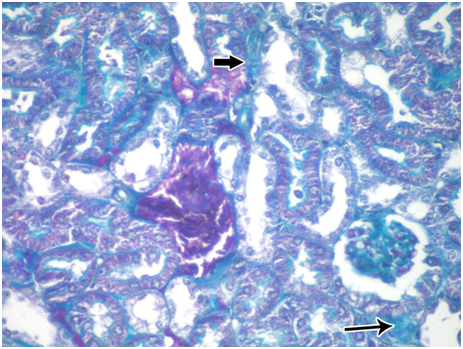
Figure 11 A photomicrograph of a section from the renal cortex of adult albino rat treated with gibberellic acid for two months showing many collagen fibers around the renal corpuscle (thin arrow) and in between tubules (thick arrow). (Masson's trichrom X 400).
Biochemical and statistical results
Estimation of the levels of serum urea and creatinine (mg/dl) in the different studied groups showed that there was no significant difference (P>0.05) between control subgroups, (Ia) control –ve and (Ib) control +ve. There was a highly significant difference (P˂0.001) between group (IIa) of subacute toxicity and group (IIb) of subchronic toxicity. The levels of serum urea and creatinine (mg/dl) tended to be increased in the treated groups (IIa, IIb) in comparison with the control groups (Ia, Ib). The highest levels of serum urea and creatinine (mg/dl) are present in the treated group (IIb) of subchronic toxicity (Table 1, Histogram I)
Groups |
Urea |
Creatinine |
Control Groups |
||
(Ia): Mean ±Sd |
16.7 ± 2.6 |
0.77 ± 0.18 |
(Ib): Mean ±Sd |
15.6 ± 2.5 |
0.79 ± 0.19 |
Subacute Toxicity (IIa): |
||
Mean ±Sd |
30.8 ± 4.9 |
1.6 ± 0.28 |
Subchronic Toxicity (IIb): |
||
Mean ±Sd |
36.6 ± 6.4 |
1.8 ± 0.23 |
F |
33.03 |
35.17 |
P |
<0.001** |
<0.001** |
Table 1 Comparisons between mean values of serum urea and creatinine (mg/dl) in the different studied group using ANOVA (analysis of variance) (F) test
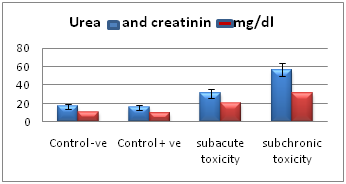
Histogram I Chart showing mean values of serum urea and creatinine (mg/dl) in the different studied groups.
Morphometrical and statistical results
Morphometrical analysis was used for the following parameters: The thickness of Bowman's space of the renal corpuscles, the diameter of the convoluted tubules and the number of inflammatory cells in the interstitial tissue.
There was no significant difference (P>0.05) between control subgroups, (Ia) control –ve and (Ib) control +ve. There was a highly significant difference (P˂0.001) between group (IIa) of subacute toxicity and group (IIb) of subchronic toxicity. The thickness of Bowman's space tended to be increased in group (IIb) of subchronic toxicity and decreased in group (IIa) of subacute toxicity. The diameter of the convoluted tubules tended to be increased in the treated groups (IIa, IIb). The highest diameter present in the treated group (IIb) of subchronic toxicity. The number of inflammatory cells tended to be increased in the treated groups (IIa, IIb). The inflammatory cells are maximally increased in the treated group (IIa) of subacute toxicity (Table 2, Histogram I-IV).
Parameters |
Control Groups |
Sub Acute Toxicity |
Sub Chronic Toxicity |
P |
Thickness of Bowman's space |
3.5±0.7 |
2.1±0.3 |
15.7±1.2 |
<0.001** |
3.5±0.8 |
||||
Diameter of convoluted tubules |
4.4±1.8 |
76.6±1.9 |
116.4±0.7 |
<0.001** |
4.4±1.9 |
||||
Number of inflammatory cells |
------- |
58.6±1.7 |
13.3± 1.3 |
<0.001** |
Table 2 Comparisons between mean values of the thickness of Bowman's space of renal corpuscles, the diameter of convoluted tubules and the number of inflammatory cells using ANOVA (analysis of variance) test.
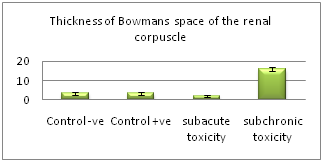
Histogram II Chart showing mean values of thickness of Bowman's space of the renal corpuscles in the different studied groups.
The extensive use of plant growth hormones in agriculture, make it as an interesting subject to detect its possible harmful effects on the kidney as one of the main target organs for many of different toxins. So, the present work was designed to detect the effect of gibberellic acid on the renal cortex of adult male albino rats at different durations, two weeks to detect its subacute toxicity and twomonths to detect its subchronic toxicity.
In this study, examination of the renal cortex of the control animals stained with haematoxylin and eosin showed that the renal cortex was formed of renal corpuscles and tubules. Renal corpuscle is formed of glomerulus surrounded by Bowman’s capsule. Distal convoluted tubules had wider lumen than proximal convoluted tubules. The distal tubules are lined by small cuboidal cells and eosinophilic cytoplasm. Proximal convoluted tubules had narrow lumen and lined by cuboidal cells with apical brush border and more eosinophilic cytoplasm. Our results were coincided with Guyton et al.14
Sections of the control group stained with PAS, showed strong reaction in the basement membranes of the glomeruli, Bowman's capsules, convoluted tubules and the brush borders of proximal convoluted tubules. Masson’s trichrome stained sections showed few collagen fibers in the interstitium of the renal cortex around the renal corpuscles and tubules. The results agreed with Hassan et al.15
Haematoxylin and eosin stained sections in the subacute treated group showed distended glomeruli with dilated congested capillaries obliterating Bowman's space. The surrounding tubules showed loss in their normal architecture and vaculations in their epithelial lining. Inflammatory cellular infiltrates in between tubules were also observed. The same changes were found in the kidney treated with gibberellic acid,16 and in the kidney treated with other plant regulators.17 The authors concluded that inflammatory reactions were a prominent response of the body tissue facing any injurious impacts. The hemorrhagic foci and the number of inflammatory cells detected in this study by morphometric analysis, recorded that the maximum levels of inflammatory cells were present in subacute group. It is considered as signs of toxicity and consequent activation of the defensive mechanism of the treated animals.18 The vacuolar formation detected in the cellular lining of renal tubules in the subacute group has been subjected to wide speculations by many investigators. They demonstrated that cytoplasmic vacuolization is one of the important primary responses to all forms of cell injury. They implied increased permeability of cell membranes leading to an increase of intracellular water. As water accumulated within the cell, it produced cytoplasmic vacuolization.19
Haematoxylin and eosin stained sections in the subchronic treated group in this study showed small sized renal corpuscles, degenerated glomeruli surrounded by tubules containing cast in their lumen . The tubules showed thinning in their epithelial lining. The lumen of tubules showed homogenous acidophilic material and desquamated cellular debris. Katzung20 attributed the sensitivity of the glomeruli to the large surface area of the glomerular capillaries which renders them susceptible to damage from circulating toxins and immune complexes. Glomerular atrophy in the treated animals of this work may be regarded as a participation of the kidney in the elimination of gibberellic acid from the body. Wakamatsu et al.21 was in agreement with this explanation and reported that gibberellic acid was highly injurious to the kidney of albino rats.
Some studies concluded that affection of the kidney tubules including tubular atrophy and interstitial fibrosis increased with the degree of glomerular involvement and loss.22 This explained the aggravation of tubular degeneration in the subchronic toxicity associated with glomerular degeneration and even loss. Oxidative stress was considered as one of the molecular mechanisms of toxicity. El Sayyad et al.23 made an analysis of antioxidant enzymes, lipid peroxidation and reactive oxygen species of gibberellic acid treated mothers and their off springs. The assayed antioxidant enzymes superoxide dismutase (SOD), catalase (CAT), showed a considerable reduction after treatment with gibberellic acid. There were marked increase of malondialdehyde (lipid peroxidation product) and reactive oxygen species. Nadia et al.24 stated that neurotoxicity seen in the cerebellum of rats treated with gibberellic acid attributed to increased amount of reactive oxygen species products.
In this study, kidney histological results were confirmed by the biochemical parameters. Assessment of the kidney functions have made in the present work by estimating the serum urea and creatinine, their levels are elevated in the treated subacute and subchronic groups when compared with the control groups. These biomarkers indicated cellular leakage and loss of function and the integrity of cell membrane in the kidney.25 So gibberellic acid was considered as a toxic substance to the renal cortex and it is recommended to limit its occupational and environmental exposure. We should take special precautions to limit the level of ground water and food contamination with gibberellic acid.
None.
Author declares that there is no conflict of interest.

©2017 Rahm, et al. This is an open access article distributed under the terms of the, which permits unrestricted use, distribution, and build upon your work non-commercially.