MOJ
eISSN: 2471-139X


Review Article Volume 6 Issue 5
1Department of Veterinary Anatomy, Usmanu Danfodiyo University, Nigeria
2Department of Animal Health and Production Technology, College of Agriculture and Animal Science, Nigeria
Correspondence: Atabo SM, Department of Animal Health and Production Technology, College of Agriculture and Animal Science, Bakura, Zamfara State, Nigeria, Tel +234(0)8069728062
Received: September 03, 2019 | Published: October 21, 2019
Citation: Umar AA, Atabo SM. A review of imaging techniques in scientific research/clinical diagnosis. MOJ Anat & Physiol. 2019;6(5):175-183. DOI: 10.15406/mojap.2019.06.00269
This paper is a review of the image techniques used in research and diagnosis as appeared in the literature. There are different types of scientific research and diagnostic imaging techniques, including Photography, Microscopy, Ultrasound, X-rays, Computed Tomography (CT) scans, Magnetic Resonance Imaging (MRI) and Positron Emission Tomography (PET). The type of imaging used depends on the part of the body the scientist wants to see on an image, as well as the type of imaging that is readily available to the patient. Over the years, medical imaging has become a vital part in the early detection, diagnosis and treatment of cancer and other diseases. In some cases medical imaging is the first step in preventing the spread of cancer through early detection and in many cases makes it possible to cure or eliminate the cancer. CT scan, MRI, Ultrasound and X-ray imaging are very important tools in the fight against several diseases. Medical imaging is also used to build accurate computer models of the body systems, organs, tissues and cells which are used in teaching anatomy and physiology in the medical schools.
Keywords: imaging, photography, microscopy, ultrasound, x-rays, computed tomography scan, magnetic resonance imaging and positron emission tomography
Scientific and diagnostic imaging are medical imaging used to create images of parts or whole human/animal body for various clinical purposes such as medical procedures and diagnosis or medical science including the study of normal anatomy and function. Medical imaging in a wider sense, is part of biological imaging and incorporates photography, microscopy, ultrasonography, radiography, Computed Tomography (CT), Magnetic Resonance Imaging (MRI) and Positron Emission Tomography (PET).1–5 Medical imagining techniques provides a detailed anatomic and physiologic images of different organs and tissues of the body, for research, diagnostic and treatment purposes. In this paper, we attempt to present a detail survey on Medical Imaging so as to provide an overview on the past, present and future aspects in this field.
Photography involves using light to make pictures. It is the process of recording images by exposing light-sensitive film or array to light or other forms of radiation. It has also been described as the art, science and practice of creating durable images by the use of light sensitive materials such as photographic film (film camera) or electronically by means of a digital image sensor (digital camera) (Figure 1 & 2).8 Photomacroscopy/photomacrography is the art and science of taking photographs of gross or macroscopic images (Figure 3) and photomicroscopy/photomicrography is also the art and science of taking photographs using a microscope to visualize microscopic structures.10 Micrographs; are photomicrographs of sections or prepared histological slides taken from a microscope (Figure 4), to obtain a micrographs two machines are important; microscope and camera or microscope with inbuilt cameras (Figure 5 & 6). Cameras are optical instrument for recording images, which may be stored locally or transmitted to another location.14

Figure 1 A photograph of a film Camera and its accessories.6
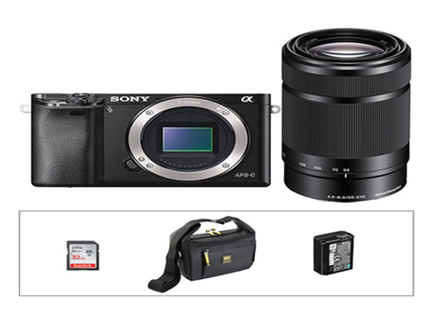
Figure 2 A photograph of a digital camera and its accessories.7
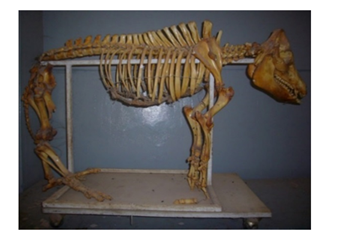
Figure 3 A photograph of the skeletal system of a swine.9
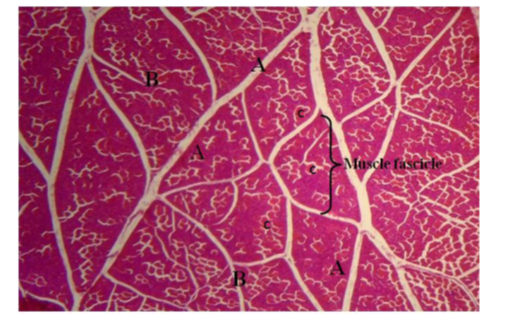
Figure 4 Photomicrograph of triceps brachii of adult Red Sokoto goat’s triceps brachii. Showing: A, Perimysial spaces; B, Muscle fascicles; C, muscle fibres (H&E, magnification x400).11

Figure 5 A photograph of a microscopes and cameras demonstrating how photomicrographs are captured.12

Figure 6 A Photograph of a surgical microscope.13
Advantages of digital cameras over film cameras
Eliminates film processing: With the advent of digital camera, you no longer have waste time, energy and resources in developing films in a dark room. Digital cameras are equipped with memory cards where pictures can be saved and transferred to a personal computer and printed if necessary.15
Massive photo storage: Digital cameras can store over 10,000 images, depending on the size of the memory card. This outweighs the storage capacity of film cameras.15
Editing and sharing: Digital photography enables editing either with the camera or computer such as cropping, resizing, e.t.c. Digital photos can also be shared using social media (facebook, WhatsApp, Instagram e.t.c) and softwares (Xender, Cluster, Google Spaces, KatchUp e.t.c)16
Microscopy is the technical field of using microscopes (magnifying instrument) to view objects and areas of objects that cannot be seen with the naked eye (objects that are not within the resolution range of the normal eye).17 Microscope is a device that uses a lens or system of lenses to produce a greatly magnified image of an object. Modern microscopy now uses softwares such as ImageJ, CellProfiler, NeuronStodio to acquire and analyze images.1
There are two branches of microscopy.1,18
Light microscope
This is also refers to as optical microscope, is a type of microscope which uses visible light and a system of lenses to magnify images of small samples.17 Optical microscopes are the oldest design of microscope and were possibly invented in their present compound form in the 17th century. Basic optical microscopes can be very simple, although there are many complex designs which aim to improve resolution and sample contrast such as compound, dissecting and surgical microscope.19 Modern microscopes allow more than just observation of transmitted light image of a sample; there are many techniques which can be used to extract other kinds of data. Most of these require additional equipment in addition to a basic compound microscope.17 Optical microscopy is used extensively in histology, histopathology, microelectronics, nanophysics, biotechnology, pharmaceutics research, mineralogy and microbiology.20
Simple microscope: A simple microscope uses a lens or set of lenses to enlarge an object through angular magnification alone, giving the viewer an erect enlarged virtual image.21 The use of a single convex lens or groups of lenses are still found in simple magnification devices such as the magnifying glass, loupes, and eyepieces for telescopes and microscopes.22
Compound microscope: A compound microscope uses a lens (objective lens) close to the object being viewed to collect light which focuses a real image of the object inside the microscope. That image is then magnified by a second lens or group of lenses (called the eyepiece) that gives the viewer an enlarged inverted virtual image of the object.18 The use of a compound objective/eyepiece combination allows for much higher magnification (up to 1000-2000 times) (Figure 7). A compound microscope also enables more advanced illumination setups, such as phase contrast.21,22

Figure 7 A photograph of a compound microscope.23
Stereo microscope: A stereo microscope is a low-powered microscope which provides a stereoscopic view of a sample (up to times 100 magnification), commonly used for dissection (Figure 8).18

Figure 8 A photograph of a stereo microscope.24
Inverted microscope: for studying samples from below; useful for cell cultures in liquid, or for metallography (Figure 9).18

Figure 9 A photograph of an inverted microscope.25
Comparison microscope: It is a device used to analyze side-by-side specimens. It consists of two microscopes connected by an optical bridge, which results in a split view window enabling two separate objects to be viewed simultaneously. It has two separate light paths allowing direct comparison of two samples via one image in each eye (Figure 10). This avoids the observer having to rely on memory when comparing two objects under a conventional microscope.27
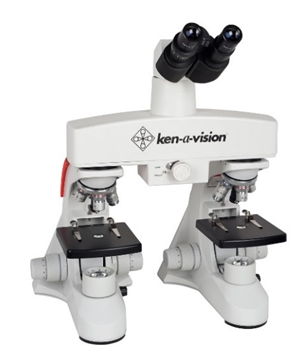
Figure 10 A photograph of a comparison microscope.26
Digital microscope: It is a variation of a traditional optical microscope that uses optics and a digital camera to output an image to a monitor, sometimes by means of software running on a computer.20 A digital microscope often has its own in-built LED light source, and differs from an optical microscope in that there is no provision to observe the sample directly through an eyepiece. Since the image is focused on the digital circuit the entire system is designed for the monitor image (Figure 11). The eyepiece for the human eye are omitted.20
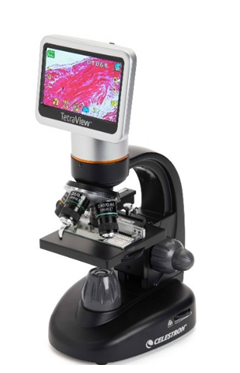
Figure 11 A photograph of a digital microscope.28
Surgical microscope: They are used to enhance the surgeon’s magnification (up to 4-40 times) during surgical procedures.29 They were originally used for ear, nose and throat surgery. However, they are still setting new standards in general surgery, ophthalmology, orthopaedic surgery, gynecological surgery, otolaryngology, neurosurgery, oral and maxillofacial surgery, plastic surgery, podiatric surgery and pediatric surgery (Figure 6).29
Electron microscope
The overall design of an electron microscope is similar to that of a light microscope. Light are substituted with electrons, glass lenses are substituted with electromagnetic and electrostatic lenses. Electron microscopes have electron optical lens systems that are analogous to the glass lenses of an optical light microscope, there are two major types of electron microscopes; Transmission Electron Microscope (TEM) and Scanning Electron Microscope (SEM), of which TEM is the most common used (Figure 12).22 The biggest advantage is that they have a higher resolution than light microscope and are therefore also able of a higher magnification (up to 2 million times).31 Electron microscopes allow for the visualization of structures that would normally be not visible by optical microscopy.32 Electron microscopes are used to investigate the ultrastructure of a wide range of biological and inorganic specimens including microorganisms, cells, large molecules, biopsy samples, metals, and crystals (Figure 13).31 Modern electron microscopes produce electron micrographs using specialized digital cameras and frame grabbers to capture the image.

Figure 12 A photograph of an electron microscope image.30
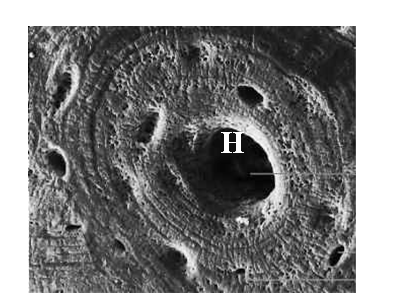
Figure 13 A photograph of a bone tissue on electron microscope, showing the harversian canal (H) and Lacuna (L).37
Transmission electron microscope (TEM)
Transmission Electron Microscopy is a technique developed to obtain magnification and hence details of a specimen, to a much better level than the conventional optical microscopes.34,35 In TEM a beam of electrons is passed through an ultra-thin specimen interacting with the specimen as it passes through. An image is formed from the interaction of the electrons transmitted through the specimen; the image is magnified and focused onto an imaging device, such as a fluorescent screen, on a layer of photographic film, or to be detected by a sensor such as a CCD camera.2 In a TEM, electrons penetrate a thin specimen and are then imaged by appropriate lenses, in broad analogy with the biological light microscope.22 The TEM comprises of; Illumination system, Specimen stage, Imaging system and Vacuum system. Transmission electron microscopy is a major analytical method in the physical, chemical and biological sciences. TEMs find application in cancer research, virology, and materials science as well as pollution, nanotechnology and semiconductor research.36
Scanning electron microscope (SEM)
A scanning electron microscope, has a similar structure to TEM, but the column is considerably shorter because the only lenses needed are those above the specimen used to focus the electrons into a fine spot on the specimen surface.37 There are no lenses below the specimen. The specimen chamber, on the other hand, is larger because the SEM technique does not impose any restriction on specimen size other than that set by the size of the specimen chamber.38 SEM produces images of a sample by scanning the surface with a focused beam of electrons. The electrons interact with atoms in the sample, producing various signals that contain information about the sample's surface topography and composition.39 The electron beam is scanned in a raster scan pattern, and the beam's position is combined with the detected signal to produce an image. SEM can achieve resolution better than 1 nanometer.40
Ultrasonography
Ultrasonography is also referred to as a Doppler study or ultrasound scan used for medical diagnosis, it is a painless and non-invasive technique which uses an ultrasound machine with a silent high-frequency sound waves (1 to 5 megahertz) to produce live images of the internal structures of the body also known as sonogram. It enables physicians to visualize diseased or normal organs or tissues (such as bladder, uterus, kidney and ovaries) within the body without making an incision. Ultrasound scan is the recommended medical technique for visualizing a fetus in pregnant women/animals because it does not produce radiation like other medical imaging techniques.2
Ultrasound technique involves using a liquid gel and hand held transducer probe on the surface of the body. The probe which contains acoustic transducer sends and receives millions of pulses and echoes into the body per second. The sound waves penetrates into the body and hit a boundary between tissues (e.g soft tissue and bone), the waves get reflected back to the transducer probe and then transmitted to the central processing unit (CPU) (Figure 14–16). The CPU is a machine that supplies electric power to the transducer, calculates reflection time of the wave and depth of the tissue interface which cause the wave so as to construct a two dimensional image on the monitor. The procedure usually requires a minimum of 30 minutes.41,42

Figure 14 A photograph of an ultrasound machine.41

Figure 15 A photograph an intrascrotal hernia.41

Figure 16 A photograph an ultrasound image of intrascrotal hernia.41
Below are the different types of ultrasound
2D Ultrasound Image: This is the most common type of ultrasound picture, it is a series of flat, two-dimensional cross section images of the scanned tissue. This mode of scanning is still standard for many diagnostic and obstetric situations after a half-century of use.43–46
3D Ultrasound image: This is a 3-dimensional image (3D), obtain from a cross sections of tissue scanned at several angles and the received data is reconstructed into a 3-dimensional image. This ultrasound is commonly used to provide a more complete and realistic sonogram (image) of a fetus and in the diagnosis of cleft lip.44–47
4D Ultrasound image: uses sound wave to produce a live video of the fetus in the uterus.43–46 3D and 4D ultrasound produces a realistic images of a moving or developing fetus in the uterus which cannot be readily seen in a 2D ultrasound image.43–46
A Doppler ultrasound image: The technique involves the use of reflected sound waves to reveal the pattern and manner of blood flow within the blood vessel, this cannot be seen in a 2D, 3D and 4D ultrasound image. Doppler ultrasound can be used in diagnosing several abnormalities of the heart and blood vessels such as venous insufficiency, artery stenosis, blood clots, aneurysms and congenital diseases of the heart. During a Doppler ultrasound the transducer is moved over the skin along the blood vessels to send and reflect sound waves, high-frequency sound waves bounces off circulating blood cells, which in return changes the frequency of the reflected waves, refers to as a Doppler effect and in the absence of blood flow, changes do not occur in the reflected sound waves. Data from the reflected sound waves with Doppler effects is used to construct a graph representing the pattern and manner of blood flow through the blood vessels on the CPU. There are three types of Doppler ultrasound namely; Color Doppler, Spectral Doppler and Power Doppler.43–46
Color doppler: This type of ultrasound uses the traditional 2D ultrasound to create the picture of a blood vessel and uses a computer to change the Doppler sound waves into colors which represents the direction and speed of blood flow on the picture of the blood vessel.43–46
Power doppler: This is a more sensitive type of color Doppler that is used to generate details of blood flow in a solid organ which cannot be visualized using a conventional color Doppler. However it is impossible to view the direction of blood flow using power Doppler ultrasonography. 43–46
Spectra doppler: This is a type of ultrasound that uses a graph to represent the flow and direction of blood. It is able to show the degree of blockage in a blood vessel.43,45
Continuous wave doppler: This ultrasound uses sound waves that are sent and reflected continuously. This type of sound waves are used to detect blockage in the blood vessels and accurately measure fast flowing blood.43–46
Radiography
This is the oldest and most common diagnostic imaging technique.3 It is a non-invasive technique like the ultrasonography, however it uses a very small amount of ionizing or non-ionizing radiation (X-rays) generated by an X-ray machine to produce a latent image of internal structures of the body on an X-ray film (Projectional radiography). An X-ray machine can be fixed, mobile or portable (Figure 17–19).48–51 During radiography, the X-rays is directed to the body allowing it to pass through the target organ and then captured behind the flat X-ray film to produce a 2D image (Figure 20). X-ray examination can be done with or without a contrast media (such as barium or iodine) depending on the density of the organ to be examined. Radiography can be used in diagnosing several conditions such as bone fracture and cancer, breast tumor and tuberculosis.48 There are some risks associated with excess exposure to X-ray such as cancer, hair loss and skin burns. But in most cases the benefits outweigh the risks.3,52
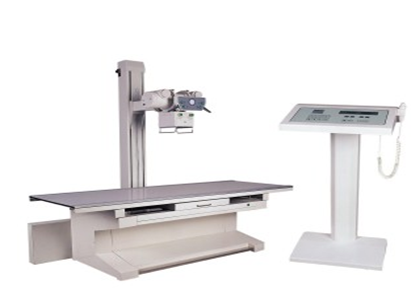
Figure 17 A photograph of a fixed X-ray machine.3
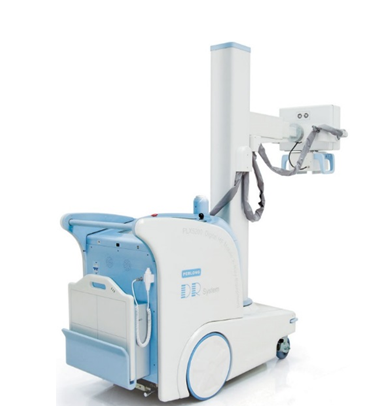
Figure 18 A photograph of a mobile X-Ray machine.48

Figure 19 A photograph of a portable X-Ray machine.48

Figure 20 A radiograph of a mid-humeral fracture.3
Computed tomography (CT) scan
A CT scan is a type of radiography that also uses X-ray, unlike the Projectional radiography the CT scan uses a higher amount of X-rays and it provides a more detailed 3D image, however in recent years, some CT scans has been developed to use a smaller amount of X-ray. The CT machine comprises of a doughnut shaped CT scanner, table, X-ray tube, X-ray detector and computer (Figure 21).54,55 The patient lie on the table before sliding into the CT scanner, the X-ray tube and camera moves round the patient at 360° to scan and produce multiple image of the internal organs of the body, depending on the organ of interest a contrast material might be administered either through the mouth, rectum or injected into the vein to highlight the scanned organ.55 The scan is performed in a separate computer room where the images are displayed and the technologist communicates with the patient with the aid of speakers and microphones.56 The major advantage of CT scan is rapid acquisition of clearer diagnostic images of a wider proportion of the body.56,57
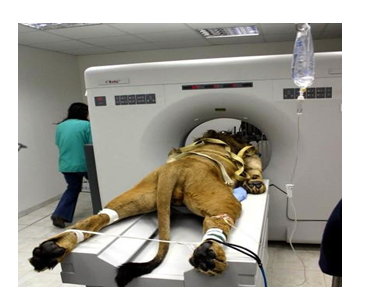
Figure 21 A photograph a lion undergoing a CT scan.53
There are specialized veterinary CT scanner such as the rechargeable veterinary CT scanner, this scanner is equipped with an X-ray cabinet to enable the veterinarian stay close to the animal during scanning, as such a separate room is not required as in the conventional human CT scan (Figure 22).57 During scanning, the animal will be anesthetized and monitored, placed and supported on a mobile table before sliding into the CT scanner (Figure 23).60,61
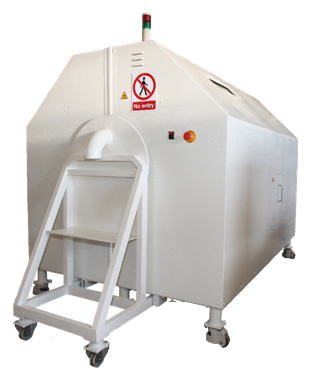
Figure 22 A photograph of a small animal rechargeable Veterinary CT-scanner.58

Figure 23 CT scan of the upper abdomen showing multiple metastasis in the liver of a patient with carcinoma of the large bowel (black arrow).59
Magnetic resonance imaging (MRI)
Magnetic resonance Imaging (MRI) is a painless, non-invasive diagnostic imaging technique that uses a powerful magnetic fields and radio waves to create a 3D image of internal organs of the body. MRI does not involves radiations as seen in radiography (projectile radiography, CT and PET scan).4 The MRI machine looks similar to that of CT and PET, although the technique takes longer time and makes louder noise (Figure 24).5,61,63
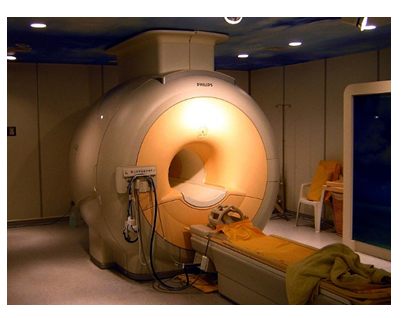
Figure 24 A photograph of an MRI Scanner.62
During the scan the patient (with or without a contrast media) lie on a table that slides into the tube containing a large magnet which generate a magnetic field and radio waves around the body of the patient which allow the tissue of the body vibrate. These vibrations are converted into detailed image on the computer (Figure 25).5
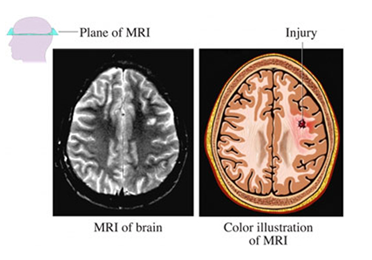
Figure 25 MRI scan image of the brain.5
Positron emission tomography (PET)
PET is a 3D functional imaging technique, In contrast to CT and X-ray, it demonstrate the physiological activities of tissues and organs of the body using a radiotracer (18F-FDG). The route of administration (oral, venous or nasal) of the radiotracer depends on the tissue or organ of interest.64 The injected radiotracer concentrates within a tissue which is been displayed on a computer as a 3D image. The machine is similar to CT and MRI, and modern PET scan images can be combined with CT or MRI scans to create unique view (Figure 26).66
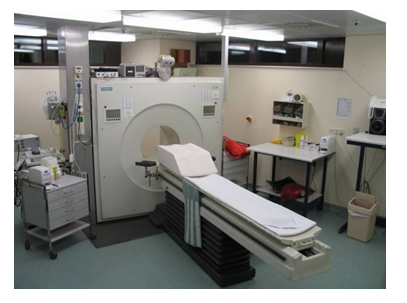
Figure 26 A photograph of a PET machine.65
PET scan is majorly used in the study and diagnosis of tumors and disorders associated with the brain and heart. The technique is also painless and non-invasive, however, it is not recommended for pregnant women, lactating mothers because of the radiation emitted by the 18F-fluoro-2-deoxyglucose (18F-FDG) radiotracer (Table 1). PET scan image is a colorful which shows the most active areas of the organ or tissue, depending on the quantity of radiotracers it has absorbed (Figure 27).5,68–70
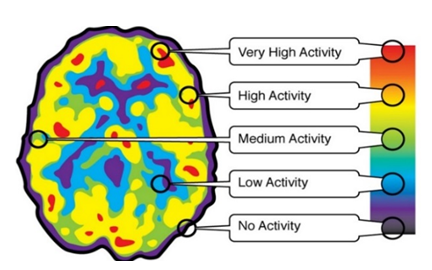
Figure 27 PET image scan of the brain.67
Imaging techniques |
Machines/devices |
Photography |
Film camera |
Digital camera |
|
Microscopy |
Light Microscope: Simple microscope, Compound microscope, Stereo microscope, Digital microscope and Surgical microscope |
Electron Microscope: Transmission Electron Microscope (TEM) and Scanning Electron Microscope (SEM) |
|
Ultrasound |
2D Ultrasound |
3D Ultrasound |
|
4D Ultrasound |
|
Doppler ultrasound: Color Doppler, Power DOPPLER, Spectral Doppler and Continuous Doppler |
|
Radiography |
Fixed X-ray Machine |
Mobile X-ray Machine |
|
Portable X-ray Machine |
|
Computed tomography (CT) Scan |
Human CT scanner |
Veterinary CT scanner |
|
Magnetic resonance imaging (MRI) scan |
MRI Scanner |
Positron emission tomography (PET) scan |
PET Scanner |
Table 1 A summary of the imaging techniques
Diagnostic imaging techniques provides a detailed anatomical or and physiological images of the body to ease research, diagnosis and treatment of different ailments. Health laboratory technologist and radiographers (registered Allied Health Professionals) primarily create and interprets images from microscope, ultrasound, radiograph (such as CT and PET), MRI e.t.c. Radiologist and other physicians assist in diagnosing and treating of patients based on the interpretation of the radiographer/technologist.
Authors have declared that no competing interests exist.

©2019 Umar, et al. This is an open access article distributed under the terms of the, which permits unrestricted use, distribution, and build upon your work non-commercially.