Journal of
eISSN: 2373-6445


Mini Review Volume 15 Issue 6
Department of Cognition, Emotion, and Methods in Psychology, University of Vienna, Austria
Correspondence: Dr. Rainer Maderthaner, Faculty of Psychology, Liebiggasse 5, 1010 Wien, Austria, Tel +436647850050
Received: November 01, 2024 | Published: November 28, 2024
Citation: Maderthaner R. Relation analysis (RELAN) – a new method of logical and statistical analysis of data to minimise the replication crisis. J Psychol Clin Psychiatry. 2024;15(6):309-313. DOI: 10.15406/jpcpy.2024.15.00797
The replication crisis weakens the credibility of statistical science. Although the reasons usually given for this (e.g. questionable research practices, statistical errors) are important, but it is often overlooked that hypotheses are often not complex enough to accurately represent empirical phenomena. This means that statistical methods will have to be better suited to more complex hypotheses than in the past. The Relation Analysis (RELAN), theoretical framework and software, allows the logical analysis, statistical testing, and simulation (modelling) of simple and highly complex logical hypotheses and also an extensive exploration of multivariate data sets. The approach of RELAN is grounded in the mathematical framework of relations, which permits the identification of all relationships - causes, effects, moderators, and mediators - among up to ten binary variables. To adequately describe complex empirical associations, the method employs six logical functions between variables (e.g. AND, OR, IF-THEN) as opposed to relying on a single function, namely (bidirectional) correlation, as is the case with the majority of multivariate statistical methods. Furthermore, most multivariate statistical analyses are based on pairwise correlations between variables; RELAN takes into account all potential relationships, that means the interactions between all variables; this multivariate and multifunctional complexity allows for highly specific hypotheses (alternative hypotheses) that are often very ‘far’ (effect size) from the random probability (null hypothesis), so that (with a constant sample size and significance level) the statistical power generally also increases. Moreover, the logical association analysis, RELAN, can be conducted for up to one hundred variables. Consequently, this method serves as a potential remedy for the replication crisis observed in numerous scientific disciplines. Additionally, the logical formulation of hypotheses clarifies their theoretical structure and enhances communication within the research community. This article provides a brief overview of the method and illustrates its application through several straightforward examples.
Keywords: logical-statistical analysis, hypothesis testing, exploration, modelling, propositional logic, software.
In many disciplines with a statistical research focus (e.g. psychology, medicine, biology, environmental sciences), the so-called replication crisis has been lamented for years.1–3 Most experts blame the so-called Questionable Research Practices (QRP),4 others criticise a misunderstanding in statistics5 and yet others see the problem in different definitions of replication processes.6 In a seminal study conducted by the Open Science Collaboration,2 100 experimental and correlative studies were replicated from three prominent psychological journals. The journals included in the study were JPSP (n = 32 articles), JEP: LMC (n = 28 articles), and PSCI (n = 40 articles). The effect sizes of the replications (0.20) were only half as large as those in the original study (0.40), and only 36% of replications were significant. Altogether, there are no less than fifteen reasons for the low stability of findings in psychology and other statistical-empirical sciences.7 In the case of statistical problems and errors, the often insufficient statistical power of studies is probably one of the main causes of replication problems.
Less attention has been paid to the fact that the hypotheses tested may not correspond to the phenomena investigated in terms of complexity. Sanbonmatsu and Johnston8 even call for a ‘redefined science for social and behavioural research’, in which hypotheses must be adapted much more strongly than today to the complexity of empirical phenomena, which can be regarded as much higher in social sciences than in physics and chemistry. In my view, this is largely due to the fact that regularities in psychological phenomena are very often caused by multiple causal factors, depending on many preconditions, and the causes often have only a conditional or mediated effect.
When hypotheses are made more complex by considering multiple causes, moderators and mediators, this complexity must be reflected in the statistical methodology. To this end, it is useful to apply the mathematical concept of relations9 to such an evaluation method. For a given set of variables, each combination of their values and each set of combinations defines a specific relation between those variables. All these often highly complex relationships can be presented in a very comprehensible, theory-oriented and differentiated way using logical language, as the following examples will show:
Objectives
In this article, four postulates will be formulated for statistical-empirical sciences (e.g. psychology, medicine, sociology):
A prerequisite for the credibility of scientific results is replicability or reproducibility, i.e. the long-term validity of results. Therefore, derived from my postulates for future statistical analyses, it should be clarified whether the replicability of studies can be improved by the following measures:
Some practical objectives of this extension of statistical analysis are (1) proof of logically complex hypotheses, (2) calculation of necessary sample sizes, (3) reduction of error functions, and (4) more adequate testing of causal structures (through implication analysis).
Relations
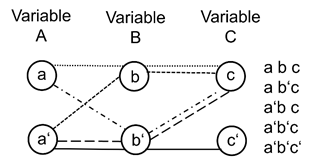
The statistical method of Relation Analysis (RELAN) is closely analogous to prediction analysis,10,11 as both are based on Boolean algebra,12,13s but Relation Analysis is also available as software with extensive analysis capabilities. RELAN allows logical analyses, simulations, tests and explorations of relations (hypotheses) and calculates more than thirty statistics. When using the Relation Analysis,7 in an existing or defined sample all possible combinations of variable values are recorded for up to ten binary variables (1 = property present, 0 = not present) and each is assigned the frequency of cases that can be attributed to it. Each individual combination of variable values represents an elementary relation, and each individual combination of elementary relations represents a complex relation (complex hypothesis) (Figure 1). For ten variables there are a total number of 10306 relations (hypothesis),12 all of which can be described as logical functions.13,14

Figure 1 Each line is an elementary relation, each symbolising a single combination of variable values (e.g. abc, ab'c). If all these elementary relations are aggregated by an OR function, we get (A∨ B) → C.
Logic functions
Relation Analysis allows up to six functions of propositional logic to be used for the hypotheses: AND, OR (inclusive), XOR (exclusive), IF-THEN, ONLY IF-THEN, und NAND (not AND). A simple example could be: IF (A OR B OR C) THEN D, or shorter in mathematical symbolism (A Ú B Ú C) ® D, or a concrete example: If an organism is attacked by TBC bacteria or Covid viruses or skin fungi, then (with some probability) an infection will occur. A rather recent example: (IF pre-existing Covid illness THEN antibody formation) AND (IF vaccination against Covid THEN antibody formation) AND (IF antibody formation THEN Disease protection).
Effect structure
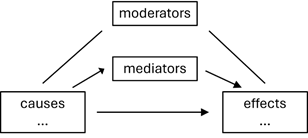
The structure and dynamics of empirical phenomena encompass not only causes (independent variables) and effects (dependent variables) but also include moderators (conditional factors) and mediators within the cause-effect framework. This complexity is most effectively represented in an impact schema (Figure 2)7 An everyday example which has been calculated elsewhere7 is the ‘exploration’ of how cars can be moved: IF motor (MOT) is running AND gear (GEA) is engaged THEN coupling (COU) will be applied and THEN the car is moving (MOV) but only under the condition that the break (BRE) is not applied:

Figure 2 Visualisation of possible impacts in a hypothetical system of variables which must be specified by the logical hypotheses.
((MOT (cause) Ù GEA (moderator) ® COU (mediator) ® MOV (effect)) Ù (MOV ½ BRE (moderator).
Testing this logical regularity with conventional statistical methods does not reveal the logical structure in question, but only trivial relationships.7
Inference statistic
To determine whether a relation in the data is over-random or significant, the frequencies of the variable values are compared with their random values by calculating an approximate binomial test.15 If the p-value of the z-statistic of the binomial test falls below the significance level (e.g. a = 0.5), then the relationship is considered significant. Since the sample size, the first-order error (a) and the effect size are also known, it is possible to calculate the statistical power, which is the probability of correctly detecting a true relationship in a sample if such a relationship exists in the population. Statistically high power (> .80) can be seen as one important prerequisite for replication. Another relevant statistic of RELAN besides the z-value, p-value, and power, is R+% which is the percentage of cases that agree with the true values of the relevant relation.
Dichotomisation
To form logical hypotheses (involving cause, effect, moderator and mediator variables), quantitative empirical variables must first be dichotomised. With this method, it is important to consider carefully the type of dichotomisation for quantitative variables, as the relative frequencies of variable values will influence the results. It would therefore be useful to make a dichotomy with regard to either practical or theoretical criteria.
Example 1
An example of a possible RELAN evaluation in the field of psychiatry is the simulation of a suicide prediction, for which empirical studies have shown that many biological, psychological, social and demographic factors need to be taken into account:16 Mental disorder (depression +), gender (male +), age (elderly +), marital status (married -), race (white +), religion (catholic +), occupation (unemployed +), recent stress, history of suicidal behaviour, child sexual abuse, occupation, malignancies, heart disease, family history, hopelessness, hostility, perfectionism, and so on. In an Argentinian study,17 324 high-risk patients were observed over two years, of whom around 35% reattempted suicide. The aim of the study was to find out which factors were most important in the prediction of a suicide attempt. Two statistical methods were used, namely the Cox regression model (traditional method) and the Random Survival Forest model (machine learning), whereby seven predictors for suicide reattempt were singled out as the most important after various evaluation runs. These predictor variables are now used to create data sets in which empirically complex regularities between the variables are modelled and have to be detected by the statistical analysis with RELAN.
Multi-causality: The predictors used, and their abbreviations are as follows: Genetic marker (serotonin regulator) (GEN), Childhood sexual abuse (CHI), Age (AGE), Recent stress (STR), Head injury (INJ), Hostility (HOS); the criterion is Suicide (SUI) (the predictor ‘previous suicide attempts’ were omitted).17 For these seven variables, RELAN generates values for N = 520 cases that exactly match the relationship (1):
(1) (GEN Ú CHI Ú AGE Ú STR Ú HEA Ú HOS) ® SUI
This relation means that one or more possible causes can independently predict suicidality. The accuracy of this simulation in the data is quite high and we can evaluate it by using the main statistics of the binomial test: z = 2.826, p = .0024, power = .88, R+% = 100. As mentioned earlier, the binomial test can be used to calculate the z-value and the corresponding p-value to test for significance, the hypothetical relation (alternative hypothesis) can be used to calculate the statistical power, and the R+% statistic indicates the percentage of cases in the sample that are consistent with the hypothesis (R+% = 100 means that the data are in perfect agreement with the logical regularity of the data).
The number of cases required to perfectly map a relation in the data increases with the number of variables and depends on the number of positive true values of the relation. If we have only three variables with OR connected implying suicide (2), we only need N = 72 cases to achieve the perfect relationship in the data:
z = 2.702, p = .0034, power = .85, R+% = 100.
(2) (GEN Ú CHI Ú STR) ® SUI
If we reduce the variables of a hypothesis further and we propose only that Head injury (HEA) or Chronic illness (ILL) or both can provoke a suicide attempt (3) so that we can test this in a sample of N = 40 people:
z = 2.423, p = .0077, power = .78, R+% = 100.
(3) (HEA Ú ILL) ® SUI
The simplest hypothesis (4), with only one cause (ILL) and one effect (SUI), can be tested with N = 18 cases.:
z = 2.449, p = .0071, power = .79, R+% = 100.
(4) ILL ® SUI
Compared to correlational analysis, using implication as a measure of association means that the test is one-sided, so that we get an estimate of the effect of ILL on SUI and not vice versa (ILL ↔ SUI). In addition to the implication function we could also test five other logical functions. The more specific a hypothesis is formulated (with few true values), the greater the likelihood of obtaining a confidential statistical result.
Moderators: However, in addition to possible alternative causes, moderators may also influence the prediction. For example, if serotonin deficiency (GEN) or Childhood sexual abuse (CHI) or Stress (STR) lead to suicidality, but only in Men (MEN) (5):
(5) (GEN Ú CHI Ú STR) Ù MEN) ® SUI
The possible causes (GEN, CHI, STR) are connected by OR and the moderator by AND. When this relationship is accurately represented in a sample of N = 50 cases, it can be confirmed statistically at the 1%- significance level.: z = 2.503, p = .0062, power = .80, R+% = 100.
Mediators: However, suicidal behavior can also result from a causal chain of factors, such as Mental illness (ILL) leading to Loss of marriage (-MAR) leading to Hostility (HOS) leading to Hopelessness (HOP) leading to Suicide (SUI) (6): z = 7,014, p < .0001, power > .99, R+% = 100.
(6) (ILL ® -MAR) Ù (-MAR ® HOS) Ù (HOS ® HOP) Ù (HOP ® SUI)
These demonstrated relationships represent possible empirical regularities that can then be clearly evaluated when the correct complex hypothesis is tested.
Example 2
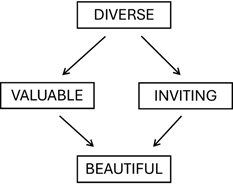
The Relation Analysis, in an earlier version, has also been used empirically in previous studies, for instance in a project of the research focus ‘Quality of life and environmental action: Consensus and conflict in the everyday life of a cultural landscape’.18 In a sub-project the inhabitants (N = 401) of a settlement area in Austria are asked to rate their environment using the following rating scales: Connected, Familiar, Genuine, Diverse (DIV), Beautiful (BEA), Valuable (VAL), Inviting (INV), Clear. First the variables were dichotomised and the sample was divided into two haves (N1 = 201, N2 = 200) for cross-validation. This means, that the first subsample is used to explore implicative relations between the variables (applying the Bonferroni correction of the significance level), and then the second sub-sample is used to test, whether the explored implications can be found again. The result of this process has been the verification of four implications: (DIV ® VAL), (VAL ® BEA), (DIV ® INV), (IMV ® BEA). Because the implications are present in the data at the same time, we are able to aggregate them to form a complex hypothesis (7) which has been tested:
z = 8.736, p < .0001, power > .99, R+% = 100.
(7) (DIV ® VAL) Ù (VAL ® BEA) Ù (DIV ® INV) Ù (IMV ® BEA)
The visualisation of this verified hypothesis as an impact scheme (Figure 3) highlights the particular importance of landscape diversity (DIV), which influences both the Valuable (VAL) and Inviting (INV) mediators, and both in turn influence the beauty ratings.

Figure 3 Illustration of the implicative associations of landscape ratings. It is well known in aesthetic literature that diversity triggers feelings of beauty, but not that valuable and inviting can act as mediators in landscapes.
Example 3
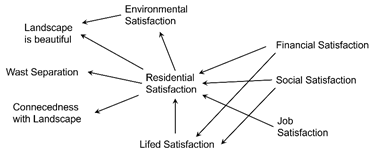
Another example from environmental research is intended to demonstrate the practical significance of exploring variable networks. The question of the extent to which satisfaction with one's own living situation affects the relationship to the landscape and the willingness to engage in ecological behaviour should be investigated. This example is intended to emphasise the importance of multi-causal influences and mediators for the prediction of impact variables (Figure 4).

Figure 4 Implicative variable network of satisfaction ratings, landscape ratings and willingness to separate waste. It is understandable that financial, social and working conditions (health was not included) have an influence on housing satisfaction, but it is surprising that housing satisfaction has an influence on environmental satisfaction and attachment to the landscape. Sociodemographic factors (causes) influence attitudes towards landscape and environment (effects) via housing satisfaction (mediator).
It may be perceived as a shortcoming that only binary (two-valued) variables can be used for the RELAN. However, this shortcoming is compensated by the large number of multivariate and multifunctional hypotheses, whereby several causes, several effects, several moderators and several mediators can be tested in their interaction and whereby a total of six types of logical functions between variables are tested.
Since the type of dichotomisation of variables influences the expected values (null hypothesis) and the results, the empirical significance of the variable values should be used instead of the median dichotomisation according to content criteria (cutting scores): At what point is a value abnormal, where are the cut-off values, what is a relevant quantity, etc.?
An important advantage of RELAN is that it is possible to adjust the expected values of the variables to those of previous studies, so that the results of different studies can be compared using the same null hypotheses. This avoids that replications falsely appear to be non-existent.
It should be emphasised that in RELAN the relationships between the variables are not determined correlatively, but via logical functions, so that unidirectional relationships (implications) can be expressed with them. This is a fundamental difference to conventional “causal” statistical methods such as structural equation modelling, factor analysis, regression methods, discriminant analysis, and covariance analysis.19 All these methods use correlation matrices or functions, that characterises only both-sided associations between variables, although causal arguments are mostly used in the interpretation of the results. For causal interpretations, it must be certain that the cause occurs before or at the same time as the effect, and cause and effect must be logically implicitly linked which should be tested (as with RELAN), not just assumed.7
The inferential statistical calculations (binomial test) of RELAN are simple and understandable (and not like many multivariate methods, which can only be understood by statisticians), and even only the statistics of p-value, power, and R+% (percentage of cases according to the relationship) make it possible to validate the results of RELAN.
Finally, an unfortunate drawback of the existing version of the programme is that there is no procedure for replacing missing values (imputation), so unfortunately other statistical programmes have to be used for this.
There is no doubt that the replication crisis is partly caused by QRPs, partly by a lack of understanding of statistics, and partly by the pressure to publish scientific papers. However, this article should point out that complex empirical regularities only can be detected by equally complex hypothesis. Relational Analysis (RELAN) makes it possible to analyse, test, simulate and explore logically formulated complex hypotheses in various fields of scientific research. The logical-statistical method of Relational Analysis has already been used in research projects and master's theses in the fields of psychology and of medicine, but further applications are possible in socio-ecology, economics and environmental sciences, and certainly in some areas of chemistry, biology and pharmacology. I suppose that not only in psychology the statistical corset is too narrow so that the statistical evaluation has to be modified in direction of more complex hypotheses and of attempts to intensify the formalisation of scientific insights. To overcome the replication crisis in the long term, the aforementioned reasons such as QRP, statistical weaknesses, publication pressure and representativeness must of course also be tackled, but in statistical disciplines more thought must also be given to better adapting the hypotheses to the empirical phenomena, as far as the financial and time budget allows.
I would like to thank the anonymous reviewers for important criticism and advice, and Alexander Hohenecker for website development and licensing solutions.
None.
The authors declare that there is no conflict of interest.

©2024 Maderthaner. This is an open access article distributed under the terms of the, which permits unrestricted use, distribution, and build upon your work non-commercially.
 World Eating Disorder Week is observed from 23 February 2026 to 01 March 2026 to increase awareness of eating disorders and their psychological impact, and to promote early intervention and recovery. This initiative highlights the role of psychology and clinical psychiatry in understanding and treating eating disorders.
Researchers are encouraged to submit relevant research articles, reviews, and clinical findings. Submissions received during this week will receive a 30–40% publication discount in the Journal of Psychology & Clinical Psychiatry (JPCPY).
.