Journal of
eISSN: 2373-437X


Research Article Volume 6 Issue 4
1Universidade Estadual Paulista (UNESP/Jaboticabal), Brazil
2MAPA/Procafe, Brazil
Correspondence: Roberto Santinato, Agronomic Engineer - MAPA/Procafe, Campinas/SP, Brazil
Received: May 08, 2018 | Published: July 18, 2018
Citation: Santinato F, Soares AL, Ribeiro PC, et al. Dose effects of barnyard manure as organic fertilization in the reduction of the exclusive mineral fertilization of N, P, K and S in the coffee culture. J Microbiol Exp. 2018;6(4):180-189. DOI: 10.15406/jmen.2018.06.00212
The technical feasibility of reducing the levels of nitrogen (N), phosphorus (P), potassium (K) and sulfur (S) recommended in the mineral nutrition of arabica coffee through the use of manure as organic fertilization, in increasing doses of 5,0; 10.0; 20.0; 40.0 and 80.0 t.ha-1, added to the mineral fertilization reducing proportionally to the amounts of nutrients contained without manure. After three harvests all treatments were higher than the control, from 75 to 133% in productivity, indicating the importance of nutrients N, P, K and S without coffee cultivation without soil under study. The treatment that used 20.0 t.ha-1 was significantly superior to the others with a 23% increase in production in relation to the exclusively mineral treatment. The other treatments with manure were similar to each other and mineral mineral, except for 80.0 t.ha-1, which was lower, due to physical objects of foot falls. Ca2+, Mg2+, K+, P, Zn, Mn and B, without pH and V% were observed in the treatments with 20.0 t.ha-1 or higher, reduction of alcohol in CTC alone. In the higher doses of mineral fertilization found reduction of pH and V%, by the probable acidic effect of Urea, Ammonium Sulphate and MAP. The leaf contents of N, P, K and S are only deficient in the control. Of the doses of N, P, K and S, without experience, they can reduce to 6 to 88% of N, 16 to 93% of P, 7 to 86% of K and 9 to 87% of S.
Keywords: coffea arabica L, organic fertilization, corral manure
Barnyard manure, historically, was the first input used in the fertilization of coffee, due to its great availability in the old coffee farms. Currently in the high-scale cattle confinements, with more than 10 thousand confined animals, their availability is increasing, especially in the enclosed and adjacent triangle of Minas Gerais, as well as dairy basins such as Araxá in properties called "coffee with milk." Manure has also been used in several compounds, such as, for example, coffee straw.1 Organic matter improves physical, physicochemical, chemical and biological properties of soil, which will directly or indirectly influence soil fertility.2 In addition, it assists in aeration, permeability and greater retention of moisture in the soil. It provides nutrients, slowly available to plants and increases cation exchange capacity (CTC). However, the exclusive use of organic fertilizers in the coffee crop implies negative results of production in relation to the conventional system,3 and productivity losses,4 being recommended the association between fertilizers organic and mineral soils to obtain the balance between nutrients and consequently the better vegetative-productive behavior of the coffee tree. From this association, good results can be seen in some studies5 that, when testing doses of different types of organic fertilizers, obtained positive results when using manure of corral and chicken in association with mineral fertilizer, increasing the productivity of 9 to 20% in relation to the exclusive mineral fertilization. Also6 that obtained productivity increase with the association of coffee straw with mineral fertilizer. In order to obtain good results in the use of organic fertilizers it must be considered that each type of organic compound used in fertilization reacts with the soil and provides nutrients to the plants in different speeds and forms due to their nutritional composition and the relation between the carbon and nitrogen.7 When testing different organic nutritional sources in the production of coffee tree seedlings in tubes,8 state that when using the coffee straw the leaf contents of K were higher than the other organic sources used, while the leaf contents of Ca and Mg were below the critical range. In order to evaluate the effect of N, K, and Mg on the nutrient content of N, K, and Mg,9 with the addition of 40% turkey litter in artificial substratum favored the development of coffee tree seedlings, already,10 obtained results of production without significant difference for coffee fertilizer fertilized organominerals and exclusive mineral fertilization. The present work was carried out with the objective of studying the technical viability of reducing N, P, K and S levels of the coffee's exclusive mineral fertilizer, with the annual use of manure as a form of organic fertilization in increasing doses (5, 0, 10.0, 20.0, 40.0 and 80.0 t.ha-1) plus mineral fertilization reduced proportionally to the amount of these nutrients contained in manure from the planting to the third crop, period considered such as the formation of coffee crop.1
The experiment was installed in January 2006 at the Experimental Field of Araxá Agricultural Cooperative in agreement with the Coffee Technology Support Foundation of Varginha MG (Procafe), in the municipality of Araxá, MG, whose geographic coordinates are latitude 19° 33'21 '' S and longitude 46° 58'08''W, at an altitude of 1040m. The coffee tree was conducted in a dystrophic Red Latosol,11 whose physical and chemical analyzes are described in Table 1. The local topography is 3% of slope, and the relief is flat-undulated. The climate of the region is classified as Cwa by the Koppen method, the annual average rainfall is 1574mm and the average annual temperature is 20.4°C.12 The meteorological data during the conduction of the experiment were obtained from a Davis automatic agrometeorological station, model Vantage Pro 2, installed next to the experimental plots.
|
Physical analysis |
Clay: 46,7% |
Silt: 6,3% |
Coarse Sand: 28,9% |
Thin Sand: 18,1% |
|
Unity |
0 a 0,2m |
0,2 a 0,4m |
||
|
Chemical Analysis |
||||
|
Organic matter (reduction–oxidation) |
g.dm-3 |
29,1 |
20,7 |
|
|
Soil pH CaCl2 |
- |
4,7 |
4,0 |
|
|
Phosphorus (Resina) |
mg.dm-3 |
7,0 |
4,0 |
|
|
Potassium (Resina) |
mmolc.dm-3 |
1,4 |
0,6 |
|
|
Calcium (Resina) |
mmolc.dm-3 |
8,8 |
4,8 |
|
|
Magnesium (Resina) |
mmolc.dm-3 |
3,7 |
1,5 |
|
|
Aluminum |
mmolc.dm-3 |
16,7 |
4,2 |
|
|
Hydrogen |
mmolc.dm-3 |
31,1 |
26,7 |
|
|
H+Al |
mmolc.dm-3 |
47,8 |
30,9 |
|
|
V% |
% |
22,5 |
18,2 |
|
|
CTC |
mmolc.dm-3 |
61,7 |
37,8 |
|
|
Sulphur (Fósforo cálcio) |
mg.dm-3 |
10,8 |
9,7 |
|
|
Boron (Água Quente) |
mg.dm-3 |
0,21 |
0,16 |
|
|
Zinc (DTPA) |
mg.dm-3 |
4,6 |
3,9 |
|
|
Copper (DTPA) |
mg.dm-3 |
1,3 |
0,8 |
|
|
Manganese (DTPA) |
mg.dm-3 |
7,1 |
6,9 |
|
Table 1 Physical and chemical analyzes of the soil under study at depths of 0 to 0.2m and 0.2 to 0.4m, prior to the implementation of the experiment, Experimental Field of the Agricultural Cooperative of Araxá, Araxá, MG
The cultivar used in the experiment was the Catuai Vermelho IAC 144, planted in the spacing 4.0x0.5m, (5,000 plants ha-1). The experiment was conducted from 2006 to August 2010. The experimental design was of randomized blocks, presenting seven treatments and four replications totaling twenty - eight plots. Each plot consists of thirty plants in three parallel lines of ten plants, the eight plants being useful for evaluations. The treatments were a control, where no fertilization was done for the macronutrients N, P, K and S, a treatment with exclusive mineral fertilization and five treatments with corral manure at increasing doses of 5,0; 10.0; 20.0; 40.0 and 80.0 t.ha-1, combined with mineral fertilization, proportionally reducing the amounts of nutrients N, P, K and S contained therein. Table 2 shows the treatments studied in the experiment.
Tratamentos |
Descrição |
T1 |
Witness by absence of N, P, K and S (T). |
T2 |
Exclusive mineral fertilization N, P, K and S (AME). |
T3 |
Adubação orgânica com 5,0 t.ha-1 de esterco de curral mais adubação mineral reduzida em N, P, K e S do esterco (5,0 EC+AMR1). |
T4 |
Organic fertilization with 5.0 T. Ha-1 of barn manure and reduced mineral fertilization in manure N, P, K and S (5.0 CE+AMR1). |
T5 |
Adubação orgânica com 20,0 t.ha-1 de esterco de curral mais adubação mineral reduzida em N, P, K e S do esterco (20,0 EC+AMR3). |
T6 |
Organic fertilization with 20.0 T. Ha-1 of barn manure and reduced mineral fertilization in manure N, P, K and S (20.0 E+AMR3). |
T7 |
Organic fertilization with 80.0 T. Ha-1 of barn manure and reduced mineral fertilization in manure N, P, K and S (80.0 EC+AMR5). |
Table 2 Description of the treatments studied in the experiment, Experimental field of the agricultural cooperative of Araxá, Araxá, MG
The liming recommendations for soil correction before and after planting, up to fifty-four months, were made according to a methodology proposed by.13 The doses of the other inputs used before planting in the furrow and after planting, in cover, up to the age of fifty-four months of the coffee trees, such as Magnesium Termophosphate, Monoammonium phosphate, Potassium Chloride, Urea, Sulphate of ammonium and foliar applications with Zinc, Copper, Manganese and Boric Acid Sulphates were carried out according to the recommendations proposed by,1 with the necessary reductions for N, P, K and S macronutrients contained in manure in accordance with the treatments studied. Then, the doses, the mode and the splitting of the inputs applied in the furrow and in the cover before and after the planting until the coffee's fifty-four months of age are contained (Table 3).
|
Inputs, mode and installment |
Doses em Kg.ha-1 |
||||||
|
1 |
2 |
3 |
4 |
5 |
6 |
7 |
|
|
Limestone |
|||||||
|
Before planting* |
4 |
4 |
4 |
4 |
4 |
4 |
4 |
|
1º year** |
90 |
0 |
610 |
400 |
0 |
0 |
0 |
|
2º year** |
0 |
1.51 |
910 |
160 |
0 |
0 |
0 |
|
3º year** |
0 |
600 |
290 |
400 |
0 |
0 |
0 |
|
4º year** |
0 |
260 |
350 |
0 |
0 |
0 |
0 |
|
Total |
4.09 |
6.37 |
6.16 |
4.96 |
0 |
0 |
0 |
|
Termofosfato sulphonitrate (planting groove) |
0 |
1.25 |
1.19 |
1.12 |
1 |
750 |
250 |
|
Monoammonium Phosphate** |
|||||||
|
1º year |
0 |
100 |
70 |
40 |
0 |
0 |
0 |
|
2º year |
0 |
250 |
210 |
170 |
80 |
0 |
0 |
|
3º year |
0 |
150 |
120 |
90 |
25 |
0 |
0 |
|
4º year |
0 |
300 |
220 |
190 |
125 |
0 |
0 |
|
Total |
0 |
800 |
620 |
490 |
230 |
0 |
0 |
|
Potassium chloride |
|||||||
|
Planting (in the groove) |
0 |
125 |
90 |
60 |
10 |
0 |
0 |
|
1º year** |
0 |
250 |
210 |
170 |
80 |
0 |
0 |
|
2º year** |
0 |
750 |
710 |
670 |
580 |
420 |
80 |
|
3º year** |
0 |
550 |
520 |
480 |
420 |
280 |
20 |
|
4º year** |
0 |
920 |
880 |
840 |
750 |
590 |
250 |
|
Total |
0 |
2.595 |
2.41 |
2.22 |
1.84 |
1.24 |
350 |
|
Urea** |
|||||||
|
1º year |
0 |
400 |
380 |
350 |
310 |
220 |
40 |
|
2º year |
0 |
680 |
640 |
610 |
320 |
180 |
130 |
|
3º year |
0 |
580 |
550 |
520 |
460 |
350 |
120 |
|
4º year |
0 |
910 |
890 |
860 |
820 |
730 |
540 |
|
Total |
0 |
2.57 |
2.46 |
2.34 |
1.91 |
1.48 |
830 |
|
Ammonium sulfate** |
|||||||
|
1º year |
0 |
400 |
350 |
300 |
200 |
0 |
0 |
|
2º year |
0 |
750 |
670 |
600 |
450 |
150 |
70 |
|
3º year |
0 |
500 |
440 |
370 |
250 |
0 |
0 |
|
4º year |
0 |
1 |
950 |
900 |
800 |
600 |
200 |
|
Total |
0 |
2.65 |
2.41 |
2.17 |
1.7 |
750 |
270 |
|
Cow manure |
|||||||
|
Planting (in the groove) |
0 |
0 |
5 |
10 |
20 |
40 |
80 |
|
1º year** |
0 |
0 |
5 |
10 |
20 |
40 |
80 |
|
2º year** |
0 |
0 |
5 |
10 |
20 |
40 |
80 |
|
3º year ** |
0 |
0 |
5 |
10 |
20 |
40 |
80 |
|
4º year ** |
0 |
0 |
5 |
10 |
20 |
40 |
80 |
|
Total |
0 |
0 |
25 |
50 |
100 |
200 |
400 |
Table 3 Discrimination of inputs and their doses used before and after planting up to 54months, experimental field of the agricultural cooperative of Araxá, Araxá, MG
*, Limestone applied to total area in coverage.
**, Inputs applied to 0.7 to 0.8 m of the coffee skirt in parallel with the coffee line in coverage, with urea, ammonium sulfate and potassium chloride tranched 4 times.
The doses of Urea, Ammonium Sulphate, Potassium Chloride, Monoammonium Phosphate (MAP) and Magnesium Thermophosphate (Yoorim Master IIS) used in T2 (exclusive mineral fertilization) were reduced in treatments 3, 4, 5, 6 and 7 based on in the annual N, P, K and S contents contained in the manure of corral. The limestone rates were established by analyzing the soil 0 to 0.2m and 0.2 to 0.4m at planting. In the other years in analyzes of 0 to 0.2m the quantity used was limited to the maximum of 4 tha-1. Micronutrients Zinc (Zn), Boron (B), Copper (Cu) and Manganese (Mn) were applied via leaf three times a year, in spring, summer and autumn at concentrations: Zinc Sulfate: 0.2; 0.3 and 0.5%, Manganese Sulfate: 0.3; 0.4 and 0.6%, Copper Sulfate: 0.1; 0.2 and 0.3% and Boric Acid: 0.15; 0.3 and 0.4% in 50, 150, 250 and 500 liters, respectively, of the post-planting at 54 months. Table 4 shows the results of chemical analyzes of the poultry manure used year by year and the commercial guarantees of the other inputs used in the experiment.
|
Chemical analysis of corral manure |
||||||||||
|
Periods |
g.Kg-1 |
mg.Kg-1 |
||||||||
|
N |
P |
K |
Ca |
Mg |
S |
Zn |
B |
Cu |
Mn |
|
|
In the planting |
0,51 |
0,20 |
0,40 |
0,28 |
0,15 |
0,08 |
82 |
75 |
20 |
61 |
|
1º year |
0,38 |
0,31 |
0,50 |
0,30 |
0,17 |
0,10 |
79 |
80 |
21 |
99 |
|
2º year |
0,60 |
0,41 |
0,49 |
0,29 |
0,10 |
0,11 |
106 |
71 |
18 |
82 |
|
3º year |
0,51 |
0,32 |
0,40 |
0,37 |
0,28 |
0,07 |
53 |
62 |
31 |
107 |
|
4º year |
0,39 |
0,28 |
0,50 |
0,43 |
0,19 |
0,08 |
61 |
55 |
23 |
96 |
|
Commercial guarantees of inputs |
||||||||||
|
Limestone: |
PRNT:82%; Cao:32% e Mgo:16% |
|||||||||
|
Urea: |
N:44% |
|||||||||
|
Ammonium Sulfate: |
N:20% e S:24% |
|||||||||
|
Monoammonium Phosphate: |
N:9% e P:48% |
|||||||||
|
Potassium Chloride: |
K:58% e Cl:42% |
|||||||||
|
Yoorim Master II S: |
P. total: 18%; P. Solúvel em ácido cítrico:16%; Ca:20%; Mg:9%; Zn:0,5%; B:0,1%; Cu:0,05% e Mn:0,12% |
|||||||||
|
Zinc Sulfate: |
Zn: 21% e S: 16% |
|||||||||
|
Copper Sulfate: |
Cu: 24% e S: 18% |
|||||||||
|
Manganese Sulfate: |
Mn: 25% e S: 15% |
|||||||||
|
Boric Acid: |
B: 17% |
|||||||||
Table 4 Chemical analysis of the cow manure and commercial guarantees of the other inputs used in the experiment, Experimental field of the agricultural cooperative of Araxá, Araxá, MG.
The control and control of the main pests and diseases were carried out according to the recommendations proposed by,1 with Triazoles fungicides associated with Strobirulins to control Rust (Hemileia Vastrix) and Cercospora (Cercospora coffeicola). For the Phoma and Ascochyta complex (Phoma.spp and Ascochyta spp), Boscalide was used. Aldicarb was used in the 1st and 2nd years and Rynaxipir in the other years to control infestation of Bicho Mineiro (Leucoptera Coffeella). For the control of coffee borer (Hyppotenemus hampei) Endosulfan was used from the first harvest at 30 months. Experiment evaluations counted from the first three harvests, harvesting the fruits of the eight central plants of each plot when they presented a maximum of 15% of green fruits. The coffee harvested had the volumes measured through the graduated container and placed for drying until the point of processing. With the weight of the coffee benefited, it was processed into a 60.0Kg.ha-1 bag for each plot.
As supplementary evaluations were done leaf analysis for N, P, K and S and soil analysis for Organic matter, pH, Saturation of bases (V%), CTC, P, K, Mg, Ca, S, Zn, B, Cu and Mn, after harvesting in June 2008, August 2009 and July 2010. The soil was collected at depth 0 to 0.2m in the projection of the coffee skirt on both sides of the coffee line in four simple samples per plot to generate a composite sample. The leaves of the 3rd and 4th pairs were collected in the middle third of the coffee trees on both sides of the coffee line and with 50 pairs per plot. The productivity results were submitted to analysis of variance and comparison of means by the Tukey test at 5%.
Figure 1 shows the mean air temperature data in the five years of experiment development. It was observed that the average temperatures were lower than 19ºC only in three months during the whole experiment (June 2006, May 2007 and June 2008). According to Santinato & Fernandes,5 below 19ºC, the coffee significantly reduces its growth, which practically did not occur during the whole experiment. Figure 2 shows the precipitation data during the experiment, whose values totaled 1,576, 1,611, 1,737, 1,812 and 1,481, respectively for 2006, 2007, 2008, 2009 and 2010. Figure 3 shows, based on Table 5, the results obtained in the first three harvests after planting, and the total produced in the triennium analyzed. By the same, we verified significantly, the superiority of the production of all treatments fertilized with N, P, K and S when compared with the control, demonstrated the importance of these nutrients in the soil under study for coffee nutrition. Attributing the value 100 to the control, it is verified that the fertilized treatments, in the total of the three harvests, promoted the increase of 75 to 133% in the production. The treatment of 5.0 and 20.0 t.ha-1 was significantly higher than that of other treatments, with 23% increase in yield. Treatments with 5.0; 10.0 and 20.0 t.ha-1 of manure were 9 to 23% more productive when 100 was attributed to the treatment of exclusively mineral fertilization, corroborating with several authors,6 who worked with organic matter in the fertilization of the coffee tree in different climate and soil conditions.
|
Treatments |
1ª crop |
2ª crop |
3ª crop |
Total produced (Triennial) |
R% PARA |
|
|
T |
AMT |
|||||
|
T1 (Witnes) |
25,8 b |
27,4 a |
36 d |
89,2 c |
100 |
-47 |
|
T2 (AME) |
47,6 a |
40,8 a |
79,5 bc |
167,9 ab |
75 |
100 |
|
T3 (5,0 EC+AMR1) |
50,7 a |
42,6 a |
90,5 a |
183,8 ab |
106 |
9 |
|
T4 (10,0 EC+AMR2) |
58,6 a |
45,9 a |
88,7 ab |
193,2 ab |
116 |
15 |
|
T5 (20,0 EC+AMR3) |
58,8 a |
53,6 a |
95,2 a |
207,5 a |
133 |
23 |
|
T6 (40,0 EC+AMR4) |
51,9 a |
45,9 a |
75,2 c |
173,0 ab |
94 |
3 |
|
T7 (80,0 EC+AMR5) |
47a |
31,6 a |
78 c |
156,6 b |
75 |
-7 |
|
CV (%) |
10,96 |
31,74 |
5,43 |
11,23 |
||
Table 5 Results of the productions of 3 harvests in sacks 60.0Kg. Ha-1 of coffee benefited according to the different treatments used, Experimental field of the agricultural cooperative of Araxá, MG, from 2006 to 2010
*, Each column for each medium followed by the same letters does not differ from each other, by the Tukey test at 5% probability.
*Treatments: AME, exclusive mineral fertilization; EC, corral manure; AMR(1,2,3,4,5), reduced mineral fertilization
Probably as stated by some of the authors mentioned, the greatest productivity of the treatments with the manure of corral is due the physical, chemical-physical, chemical and biological improvements in the soil, as well as the constant availability of the nutrients contained in manure. Table 6 and (Figure 4) (Figure 5) (Figure 6) (Figure 7) & (Figure 8) demonstrate the effects of manure doses on the soil. The organic matter practically did not change until the dose of 10.0 t.ha-1 rising sharply with the doses of 40.0 and 80.0 t.ha-1, in the triennium average. All treatments present adequate range for the coffee tree,1 after 54months of cultivation, and above this range with the highest dose. The CTC showed a significant increase in the higher manure doses (20.0,40.0 and 80.0 t.ha-1), while in the others there were no significant differences.
Analysis |
Periods |
Treatments |
|||||||
T1 |
T2 |
T3 |
T4 |
T5 |
T6 |
T7 |
V% |
||
Organic matter (Oxy reduction) g.dm-3 |
1º year |
58 b |
61 b |
63 b |
63 b |
63 b |
70 ab |
87,5 a |
14,58 |
2º year |
37 c |
36 c |
39 c |
38 c |
42 bc |
52 b |
66,5 a |
11,78 |
|
3º year |
26 b |
27 b |
28 b |
29,5 b |
32,5 b |
32,25 b |
47 a |
18,88 |
|
Average |
40,3 |
41,3 |
43,3 |
43,5 |
45,8 |
51,41 |
67 |
CV% |
|
pH (sol. CaCl2) |
1º year |
5,7 abc |
4,7 d |
4,9 cd |
6,6 ab |
6,5 a |
5,5 bcd |
5,6 abcd |
7,1 |
2º year |
5,8 b |
4,9 c |
5,3 bc |
5,1 bc |
5,2 bc |
5,6 bc |
6,8 a |
6,59 |
|
3º year |
5,7 a |
5,4 a |
5,3 a |
5,7 a |
5,8 a |
6 a |
6,2 a |
8,53 |
|
Average |
5,73 |
5 |
5,16 |
5,7 |
5,83 |
5,7 |
6,2 |
CV% |
|
V% |
1º year |
73 a |
33 d |
40,5 d |
57 c |
71 ab |
65,25 b |
71 ab |
5,58 |
2º year |
77 a |
44 b |
54 b |
52,75 b |
61 ab |
78 a |
81 a |
15,2 |
|
3º year |
72 ab |
54 c |
52 c |
63 bc |
68 ab |
74 ab |
80 a |
8,66 |
|
Average |
74 |
43,6 |
48,8 |
57,58 |
66,6 |
71,41 |
77,3 |
CV% |
|
CTC mmolc.dm-3 |
1º year |
68,4 c |
91,5 ab |
88,3 b |
90,7 ab |
98,7 ab |
91,8 ab |
103,2 a |
7,06 |
2º year |
65,1 c |
63,3 c |
78,8 bc |
73,2 bc |
87,1 b |
119,7 a |
120,1 a |
7,78 |
|
3º year |
70,8 d |
76,6 cd |
72,7 cd |
74,6 cd |
90,5 bc |
99,2 b |
121,1 a |
8,93 |
|
Average |
68,1 |
77,13 |
79,93 |
79,5 |
92,1 |
103,56 |
114,8 |
CV% |
|
P(resina) mg.dm-3 |
1º year |
20,25 e |
34 d |
38 d |
30 d |
56 c |
77 b |
90 a |
8,4 |
2º year |
12 e |
27 d |
63 c |
32 d |
57 c |
105 b |
137 a |
9,56 |
|
3º year |
3 e |
18 d |
6 e |
11 de |
32 c |
52 b |
92 a |
12,59 |
|
Average |
11,75 |
26,3 |
35,6 |
24,3 |
48,3 |
78 |
106,3 |
CV% |
|
K(resina) mmolc.dm-3 |
1º year |
1,4 b |
1,3 b |
1,5 ab |
1,7 ab |
2,1 a |
1,4 b |
1,6 ab |
18,23 |
2º year |
1,6 e |
2,7 d |
2,3 de |
3,1 cd |
3,9 c |
4,8 b |
5,7 a |
10,86 |
|
3º year |
1,6 d |
2,4 cd |
2,6 bcd |
3,8 bc |
4,2 b |
6,4 a |
7,1 a |
18,69 |
|
Average |
1,53 |
2,13 |
2,13 |
2,86 |
3,4 |
4,2 |
4,8 |
CV% |
|
Mg(resina) mmolc.dm-3 |
1º year |
15 b |
6 c |
6 c |
14 b |
20 ab |
18 ab |
24,8 a |
21,59 |
2º year |
12,8 b |
6 b |
9 b |
6 b |
14 b |
31 a |
40,25 a |
27,3 |
|
3º year |
12 cd |
9 d |
8 d |
11 cd |
15 c |
23 b |
34 a |
12,79 |
|
Average |
13,26 |
7 |
7,6 |
10,3 |
16,3 |
24 |
33 |
CV% |
|
Ca(resina) mmol.dm-3 |
1º year |
48 a |
23 d |
30,5 cd |
36 bc |
46 ab |
41 abc |
45 ab |
12,09 |
2º year |
34 bc |
16,5 d |
31 bc |
25 cd |
36 b |
57 a |
55 a |
12,63 |
|
3º year |
36 bcd |
28,75 cd |
27 d |
29,5 cd |
40,5 bc |
45 b |
57 a |
13,38 |
|
Average |
39,3 |
22,75 |
29,5 |
30,16 |
40,83 |
47,6 |
52,3 |
CV% |
|
S(Fof. Calcio) mg.dm-3 |
1º year |
43 cd |
53 c |
100 a |
71 b |
78 b |
34 d |
43 cd |
9,95 |
2º year |
36 c |
111 a |
64 b |
56 b |
58 b |
39 c |
40 c |
8,97 |
|
3º year |
6 e |
82 a |
64 b |
31,5 c |
24 cd |
20 d |
18 d |
10,79 |
|
Average |
28,3 |
82 |
76 |
52,83 |
53,3 |
31 |
33,6 |
CV% |
|
Zn(DTPA) mg.dm-3 |
1º year |
7 cd |
8,3 bcd |
11,5 a |
10,5 ab |
9,9 abc |
5,9 d |
7,2 cd |
14,6 |
2º year |
7,1 b |
7 b |
8,1 ab |
7,9 ab |
9 ab |
10 a |
9,98 a |
12,02 |
|
3º year |
3,25 c |
3,8 c |
3,65 c |
2,72 c |
7 bc |
10,8 ab |
14,75 a |
35,37 |
|
Average |
5,26 |
6,36 |
7,8 |
7,03 |
8,63 |
8,9 |
10,63 |
CV% |
|
B mg.dm-3 |
1º year |
0,4 cd |
0,47 bc |
0,48 bc |
0,3 d |
0,56 b |
0,78 a |
0,58 b |
9,49 |
2º year |
0,3 e |
0,28 e |
0,52 d |
0,67 d |
1,14 c |
1,58 b |
2,03 a |
9,17 |
|
3º year |
0,1 e |
1,02 b |
0,92 b |
1,03 b |
1,06 b |
1,41 a |
1,53 a |
8,75 |
|
Average |
0,26 |
0,59 |
0,64 |
0,66 |
0,92 |
1,25 |
1,38 |
CV% |
|
Cu (DTPA) mg.dm-3 |
1º year |
2 ab |
2,2 a |
2,1 ab |
2 ab |
1,6 bc |
1,4 c |
1,4 c |
13,45 |
2º year |
1,9 ab |
2 ab |
2,4 a |
2 ab |
1,5 ab |
1,2 b |
1,2 b |
22,76 |
|
3º year |
1 b |
1,1 b |
1,8 a |
0,9 b |
1,1 b |
0,7 b |
0,7 b |
22,76 |
|
Average |
1,63 |
1,76 |
2,1 |
1,63 |
1,4 |
1,1 |
1,1 |
CV% |
|
Mn (DTPA) mg.dm-3 |
1º year |
43 a |
38 a |
42 a |
37 a |
48 a |
49 a |
42,5 a |
12,06 |
2º year |
10 ab |
10 ab |
17 a |
6,75 b |
6,75 b |
6,75 b |
6,75 b |
39,9 |
|
3º year |
21 c |
21 c |
28 bc |
23,7 bc |
31 b |
46 a |
48 a |
11,51 |
|
Average |
24,6 |
23 |
29 |
22,5 |
28,58 |
33,9 |
32,41 |
CV% |
|
Table 6 Results of chemical soil analysis at 0 to 0.2m, Experimental field of the agricultural cooperative of Araxá, MG, from 2006 to 2010
* Samples withdrawn (0-0.2m) months June, August and July after 3 harvests. Treatments followed by the same letters in the columns do not differ from each other, by the test of TUKEY to 5% probability.
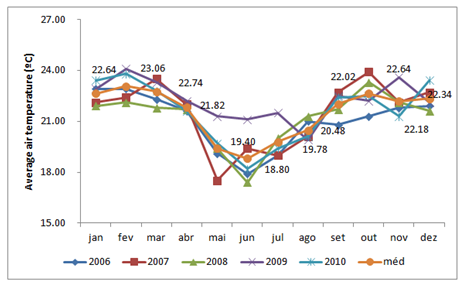
Figure 1 Average air temperature throughout the experiment, the Experimental field of the agricultural cooperative of Araxá, MG, from 2006 to 2010.
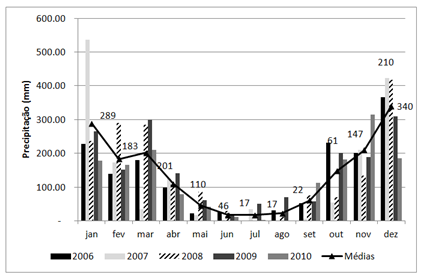
Figure 2 Precipitation throughout the experiment, the Experimental field of the agricultural cooperative of Araxá, MG, from 2006 to 2010.
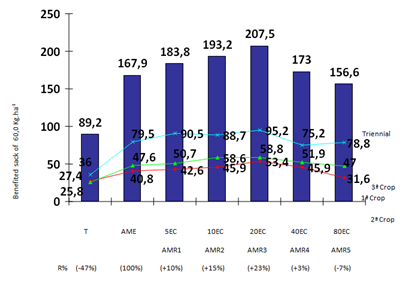
Figure 3 Results of the productions in the first, second and third harvests and the total production in three years time.
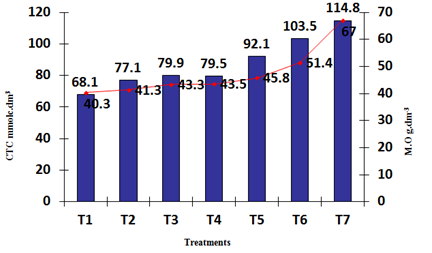
Figure 4 Chemical changes in organic matter and CTC soil, average of 3 Mihalis, experimental field of the agricultural cooperative of Araxá, MG, from 2006 to 2010.
Organic matter (MO), Suitable range for clay soil: 30 to 50 g. dm3.
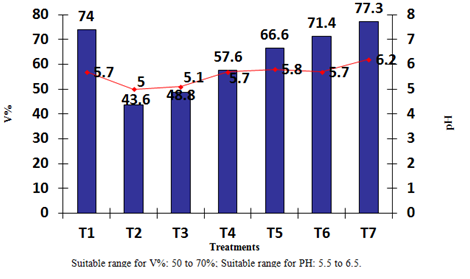
Figure 5 Chemical changes of PH and V% in soil on the average of 3 harvests, Experimental field of the agricultural cooperative of Araxá, MG, from 2006 to 2010.
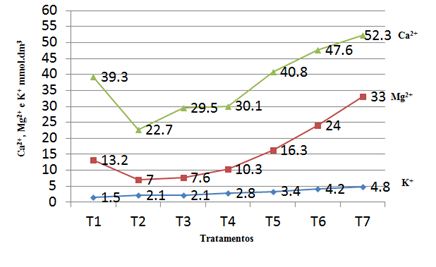
Figura 6 Alterações químicas do Ca2+, Mg2+ e K+, no solo na média das 3 safras, Campo Experimental da Cooperativa Agropecuária de Araxá, MG, de 2006 à 2010.
Faixa adequada para Ca2+: 30 a 60; Mg2+: 10 a 15 e K+: 2 a 3 mmolc.dm-3.
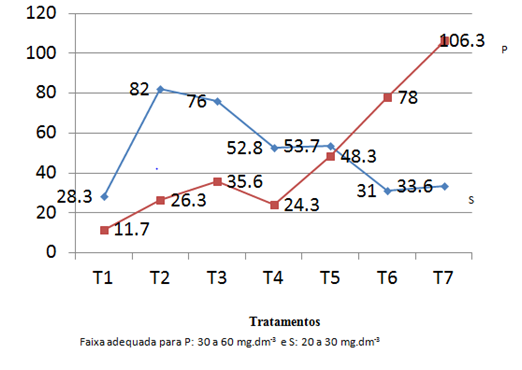
Figure 7 Alterações químicas de P e S no solo na média das 3 safras, Campo Experimental da Cooperativa Agropecuária de Araxá, MG, de 2006 à 2010.
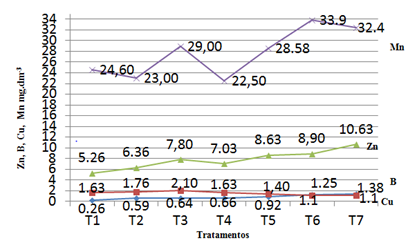
Figure 8 Chemical changes of Zn, B, Cu and Mn in the soil on the average of 3 harvests, Experimental field of the agricultural cooperative of Araxá, MG, from 2006 to 2010.
Suitable ranges: Zn=3.8 to 7.5; Mn=7.6 to 15.0; B and Cu = 0.61 to 1.5 mg.dm-3.
The pH was negatively influenced in the treatments with higher amounts of mineral nutrients, treatments 2 and 3 being followed with the saturation index of bases. At higher doses of manure the pH and V% were kept in adequate range.1 For the bases (Ca2+, Mg2+, K+) there was a significant reduction of Ca2+ and Mg2+ in the treatments with higher doses of mineral fertilizers (T2, T3 and T4) by acidification of the soil, and increasing in the higher doses by the probable buffer effect in the soil , maintaining Ca and Mg levels in a suitable range and even higher.1 As for K, the doses of corral manure associated with reduced mineral fertilizations were sufficient to maintain adequate levels,1 with accumulation of K at higher doses of 40.0 and 80.0 t.ha-1. The P in all treatments, except in the control was adequate, and rises significantly from 20.0 t.ha-1. The S in all treatments present adequate values and up to well above in the exclusive mineral, this high content probably is due to mineral fertilization as the use of Ammonium sulphate.
As for micronutrients B and Zn tend to rise with manure doses with deficient boron in the control and mineral treatment and the others with adequate levels.5 Cu, although adequate tends to reduce the larger doses of manure, while the Mn, always adequate, also rises with the larger doses 40.0 to 80.0 t.ha-1. The N, P, K and S leaf contents observed in Table 7 show that there were significant differences among the treatments, all of which were higher than the N, P, K and S deficient control. These results demonstrate that organic fertilization associated with reduced mineral, maintained the appropriate foliar levels collected at the time of the post harvest.
Nutrients |
Treatments |
1º Crop |
2º Crop |
3º Crop |
Nitrogen (g.Kg-1) |
T |
27,8 b |
23,4 c |
24,8 b |
AME |
30,1 ab |
30,7 ab |
29,95 ab |
|
5,0 EC+AMR1 |
29,9 ab |
32,1 a |
30 ab |
|
10,0 EC+AMR2 |
31,1 ab |
30,2 ab |
32,3 a |
|
20,0 EC+AMR3 |
32 a |
29,5 ab |
31,4 a |
|
40,0 EC+AMR4 |
30 ab |
29,9 ab |
30,4 a |
|
80,0 EC+AMR5 |
28,7 ab |
27,4 b |
30,6 a |
|
Tukey 5% |
CV% |
5,17 |
5,4 |
7,63 |
Phosphorus(g.Kg-1) |
T |
0,7 b |
0,9 a |
0,6 b |
AME |
1,2 ab |
1,1 a |
1,3 a |
|
5,0 EC+AMR1 |
1,1 ab |
1,2 a |
1,4 a |
|
10,0 EC+AMR2 |
1,3 ab |
1,3 a |
1,4 a |
|
20,0 EC+AMR3 |
1,4 ab |
1,4 a |
1,4 a |
|
40,0 EC+AMR4 |
1,5 ab |
1,3 a |
1,3 a |
|
80,0 EC+AMR5 |
1,6 a |
1,2 a |
1,6 a |
|
Tukey 5% |
CV% |
29,08 |
22,32 |
22,9 |
Potassium (g.Kg-1) |
T |
17,1 b |
16,9 b |
13,9 b |
AME |
19,3 ab |
20,15 ab |
21,1 |
|
5,0 EC+AMR1 |
20,4 ab |
20,1 ab |
20,2 a |
|
10,0 EC+AMR2 |
21,1 a |
22,3 a |
21,3 a |
|
20,0 EC+AMR3 |
20 ab |
19,8 ab |
19,8 a |
|
40,0 EC+AMR4 |
19,9 ab |
21,4 a |
19 ab |
|
80,0 EC+AMR5 |
21,7 a |
20,7 ab |
18,6 ab |
|
Tukey 5% |
CV% |
8,37 |
9,27 |
11,58 |
Sulphur (g.Kg-1) |
T |
1,3 b |
1,4 b |
1,3 a |
AME |
1,8 ab |
2,1 a |
1,8 a |
|
5,0 EC+AMR1 |
1,7 ab |
2 ab |
1,6 a |
|
10,0 EC+AMR2 |
1,5 ab |
1,9 ab |
1,6 a |
|
20,0 EC+AMR3 |
2 a |
2,1 a |
1,6 a |
|
40,0 EC+AMR4 |
1,9 ab |
1,9 ab |
1,8 a |
|
80,0 EC+AMR5 |
2 a |
2,1 a |
1,67 a |
|
Tukey 5% |
CV% |
15,44 |
15,05 |
24,75 |
Table 7 Results of foliar analyses of N, P, K and S at 30, 42 and 54 months of age of coffee after harvest, Experimental field of the agricultural cooperative of Araxá, MG, from 2006 to 2010
* Treatments followed by the same letters in the columns do not differ from each other by the Tukey test at 5% probability.
These results suggest that the organic fertilization associated with the reduced mineral kept the foliar contents similar to the exclusive mineral fertilization, according to the data obtained by.14-18 Table 8 summarizes the N, P, K and S doses used in planting up to 54 months of coffee cultivation, as seen in treatment 2 and proportional reductions in percentage in the other treatments as a function of the doses of manure of coffee used and its contents in each year of application. In this way it is possible to verify that the reduction of the levels of mineral fertilization of the coffee tree can be of: 6 to 88% for the N; 16 to 93% for P; 7 to 86% for K and 9 to 89% for S, with organic fertilization of 5.0 to 80.0 t.ha-1 of manure from manure.
Treatment |
T2 (AME) Kg.ha-1 |
T3 (5,0EC+AMR1) |
T4 (10,0EC+AMR2) |
T5 (20,0EC+AMR3) |
T6 (40,0EC+AMR4) |
T7 (80,0EC+AMR5) |
Nitrogen |
1733 |
-6,5 |
-16,1 |
-32,5 |
-59,9 |
-88,0 |
Phosphorus |
584 |
-16,5 |
-29,1 |
-53,7 |
-79,5 |
-93,2 |
Potassium |
1537 |
-7,2 |
-14,5 |
-29,1 |
-50,7 |
-86,6 |
Sulphur |
636 |
-9,1 |
-18,2 |
-35,9 |
-71,7 |
-89,4 |
Table 8 Reduction of the levels of N, P, K and S of mineral fertilization using the different doses of the cow manure from 0 to 55 months of cultivation of the coffee.
* Sum of the levels of N, P, K and S with the sources of urea, S. Ammonium, and MAP for nitrogen. Yoorim Master II S and MAP to the match. Potassium chloride for potassium and Yorim Master II s and s. Ammonium for sulphur.
* Não foi considerado o S do Sulf. Zinco, Manganês e Cobre utilizados
None.
The author declares no conflict of interest.

©2018 Santinato, et al. This is an open access article distributed under the terms of the, which permits unrestricted use, distribution, and build upon your work non-commercially.