Journal of
eISSN: 2373-4345


Research Article Volume 6 Issue 6
1School of Dentistry, University of Florida, USA
2PBC BioMed, Europe
3Department of Orthopaedics, University of Texas Health Science Center at San Antonio, USA
4Department of Periodontics, University of Florida College of Dentistry, USA
Correspondence: Ibraheem K Bamaga, School of Dentistry, University of Florida, 1395 Center Dr. Room D10-28, Gainesville, Florida, 32610, USA, Tel 3522153120
Received: March 23, 2017 | Published: April 6, 2017
Citation: Bamaga IK, O Sullivan RP, Schmitz J, et al. An osteoblast origin for craniofacial dysplasia in neurofibromatosis type I. J Dent Health Oral Disord Ther. 2017;6(6):204-210. DOI: 10.15406/jdhodt.2017.06.00223
Sphenoid wing dysplasia (SWD), which results in a craniofacial deformity, is the third most common skeletal deformity in Neurofibromatosis Type I (NF1) patients. A neurofibromin osteoblast conditional deletion mouse model (Nf1ob-/-) has been developed to study the skeletal abnormalities in NF1. No overt morphological phenotype is seen in the appendicular or axial skeleton of these mice. Nf1ob-/- mice have been shown to have increased bone porosity and lower bone density. We noted a progressive craniofacial deformity, which results in cranial asymmetry, malocclusion and unilateral proptosis of an eye. To assess this deformity, we employed micro-computed tomography (mCT) and geometric morphometric analysis to compare Nf1ob-/-mouse skulls to control animals. Landmarks were placed on the images at 13 biologically relevant cranial anatomical sites. Analysis of distances and angles between these landmarks revealed that there is significant variation between the Nf1ob-/- mice and controls. We found that the nasal and frontal bones of Nf1ob-/- mice skulls are deviated from the central line, whereas it was straight in controls. The nasal region is tipped downward in Nf1ob-/- mice. We also noted that the cranium shows a trend toward macrocephaly in Nf1ob-/- mice whereas other measurements were within the range of normal control mice. These differences correspond to those seen in craniofacial dysplasia and SWD in NF1 patients. No tumors were found associated with the craniofacial dysplasia in Nf1ob-/- mice. Our results identify a primarily osteoblast origin for the pathogenesis of craniofacial dysplasia in Nf1ob-/- mice and strongly support an osteoblast origin for SWD in NF1. In addition, we identify and validate a novel mouse model with which to explore molecular mechanisms and test preventative treatments for SWD in NF1.
Keywords: sphenoid bone, craniofacial abnormalities, malocclusion, megalencephaly, facial asymmetry, exophthalmos
NF1, neurofibromatosis type 1; SWD, sphenoid wing dysplasia; mCT, micro computed tomography; EDMA, euclidean distance matrix analysis; PNF, plexiform neurofibromas
Neurofibromatosis type 1 (NF1) is one of the most frequent human genetic disorders, with an incidence at birth of approximately one in 3000 to one in 3500.1 NF1 is characterized by the predisposition to benign and malignant tumors of the peripheral and central nervous system. NF1 patients may also exhibit noncancerous symptoms such as the presence of café-au-lait macules, axial freckling, learning disabilities, and skeletal dysplasia.2,3 Clinically, NF1 patients exhibit skeletal congenital or developmental abnormalities, resulting in alterations in bone shape or size. Skeletal defects can occur in the cranium, ribs, long bones, or the spine.4 These manifestations often worsen with age and in some cases have been associated with loss of heterozygosity at the NF1 locus.5,6 In a significant number of NF1 patients, orthopedic intervention results in failure of correction due to poor bone healing and may reflect a generalized defect in bone metabolism.4 The skeletal involvement affects approximately half of all NF1 patients.7–9 Craniofacial involvement, which includes macrocephaly, sphenoid wing dysplasia (SWD), short mandible and maxilla, cranial base deformity and malocclusion is seen in 11-20% of patients with NF1.10,11 Other craniofacial findings have been reported in NF1 including a widening of inferior alveolar canal, an enlarged mandibular foramen, and a reduction in mandibular angle. In rare cases plexiform Neurofibromas have been reported to be associated with impacted teeth and deformed alveolar ridge while optic nerve gliomas have been associated with orbit defects.12–15 NF1 patients may also display generalized defects in bone metabolism and bone turnover, resulting in osteoporosis in up to one half of affected individuals.16,17 Recently a neurofibromin osteoblast conditional knockout mouse was developed to study the skeletal manifestations of NF1. In this model (Nf1ob-/-) the loxP-flanked neurofibromin gene is conditionally deleted in bone-forming osteoblasts and osteoblast lineage cells under the control of 2.3kb col1a1 promotor-driven Cre recombinase.18,19 The Nf1ob-/- mouse was previously shown to develop a bone mass phenotype including high bone porosity with increased osteoclast and osteoblast numbers, as seen in NF1 patients. However, Nf1ob-/- mice display none of the appendicular or axial skeletal dysplasia seen in NF1.20 We observed a high rate of malocclusion in Nf1ob-/- animals as they age compared with animals of the same genetic background. Upon closer inspection, unilateral proptosis of an eye was apparent as was facial asymmetry. In this study we use morphometric analysis to characterize the craniofacial dysplasia in Nf1ob-/- mice and compare it to SWD and craniofacial dysplasia in NF1. Additionally, we establish an osteoblast lineage origin for the craniofacial dysplasia in the Nf1ob-/-mouse and identify a mouse model with which to test treatments aimed at slowing or blocking progression of sphenoid wing bone and craniofacial dysplasia in NF1 patients.
Animal husbandry and mouse models
Nf1flox/flox (Nf1fl/fl) mice were kindly provided by Florent Elefteriou et al.19 Transgenic B6.FVB-Tg (Col1a1-cre) 1Kry mice,18 were purchased from Riken (RBCR_NO. RBRC05603). Nf1ob-/- mice were generated by crossing Nf1fl/fl with Nf1fl/fl; Col1a1-cre mice. The genetic backgrounds of mice were assessed by the DartMouse™ Speed Congenic Core Facility at the Geisel School of Medicine at Dartmouth. Dart Mouse employed the Golden Gate Genotyping Assay (lllumina Inc, San Diego, CA) to interrogate 1449 SNPs spread throughout the genome. The raw SNP data were analyzed using Dart Mouse’s SNaP-Map™ and Map-Synth™ software, allowing the determination of the genetic background at each SNP location. The background test revealed that all mouse strains used in this study were fully back-crossed onto the C57BL/6 background. Genotypes of individual mice were determined by polymerase chain reaction (PCR) using DNA from tail tip at weaning. All mice were maintained in a specific-pathogen-free barrier facility with free access to food (Envigo Teklad Global diet 2918) and water. All procedures were approved by the Institutional Animal Care and Use Committee.
Genotyping
For genotyping, DNA was extracted from 0.5cm tail snip using the DNeasy blood and tissue kit (Qiagen, cat# 69506) with final elution volume of 200ml. Genotyping the Nf1fl/fl mice was carried out by PCR using three primers to detect WT and Flox alleles. Two primers from intron 30 of the Nf1 gene (P1 and P3) detect a 480-bp band from the WT allele, a third primer (P4) from neo gene with (P1) amplify a 350-bp band from the flox allele. PCR was performed under the following conditions: PCR master mix: 3.0mM MgCl2, 0.4mM dNTPs (Apex Bioresearch Products Cat# 42-138), 0.2mM of P1 primer and 0.4mM of primers P3 and P4, 0.5 ml of DNA; and the program: 1 cycle of 94°C for 5min; 32 cycles of 94°C for 1min; 56°C for 1min; and 72°C for 1min; and followed by 72°C for 10min. Genotyping for the Cre transgene was carried out under the following conditions: PCR master mix: 3.0mM MgCl2, 0.4mM dNTPs and 0.05 units/ml Apex Taq RED DNA polymerase (Apex Bioresearch Products Cat# 42-138), 0.4 mM of primers Cre1 and Cre2; and the program: 1 cycle of 94°C for 5min; 30 cycles of 94°C for 30sec; 56°C for 30sec; and 72°C for 30 sec; and followed by 72°C for 10min. PCR assay for detecting Cre-mediated recombination and completion of deletion was as following: Two primers (P1 and P2) were used to detect a 280-bp band that resulted from Cre-mediated recombination in the Nf1fl/fl allele. The four primers (5′ to 3′) are: P1, CTTCAGACTGATTGTTGTACCTGA; P2, CATCTGCTGCTCTTAGAGGAACA; P3, ACCTCTCTAGCCTCAGGAATGA; P4, TGATTCCCACTTTGTGGTTCTAAG; Cre1, CATGTTTAGCTGGCCCAAATGTTGCTG; and Cre2, CGACCATGCCCAA GAAGAAGAGGAAGGTG. All primers were synthesized by Eurofins Genomics (Ebersberg, Germany).
Preparation of skeleton and landmark data collection
Mice were sacrificed and skulls were skinned and saved in 70% ethanol until ready for scanning. Micro computed tomography (mCT) scans were performed for all mice skulls using SKYSCAN 1173 ex-vivo micro-CT from Bruker Company (Bruker, Kontich, Belgium). Samples were scanned at high resolution and the scans were reconstructed using NRecon software interface (v.1.6.4.6, Bruker micro-CT, Kontich, Belgium). The scan settings were the following: Source Voltage: 60 kV, Source Current: 167mA, Image Pixel Size: 13.60mm, Camera: 2K, Filter: Al 0.5mm, Exposure: 2100ms, Rotation step: 0.7 degrees, Frame Average: 5. The reconstructions were performed using a Feldkamp algorithm and a 5th order polynomial to correct for beam hardening in the images. All scanning and reconstruction parameters were kept constant for all skulls. All resliced and reconstructed scans were transferred to Analyze 10.0ã software (Analyze Direct, Overland Park, KS, USA) for 3D rendering. Three-dimensional coordinate locations of 13 biologically relevant cranial landmarks were recorded (Figure 1).21 Detailed description of these landmarks is provided on the landmarks collection page at the Richtsmeier laboratory website, (Table 1). Landmarks are located according to the three orthogonal planes of the 3D reconstruction of the specimen.
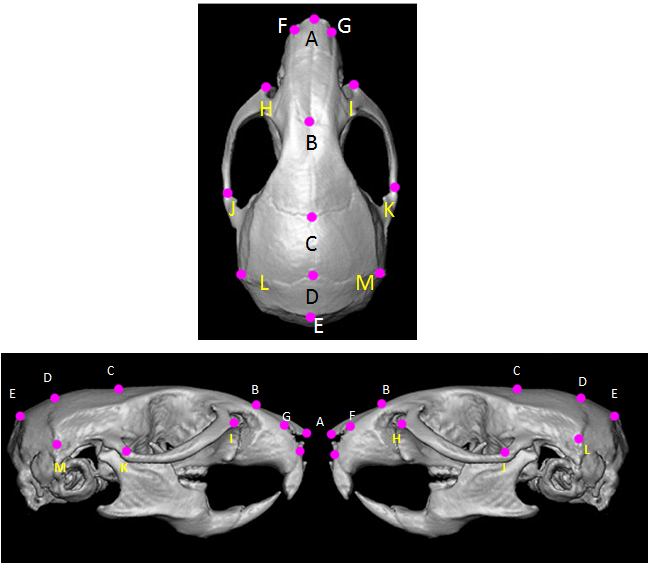
Figure 1 Mouse skull and landmarks. (a: superior; b: lateral) Schematic views of mouse skull with landmarks used for measuring linear distances. Anatomical description for each landmark is found in Table I (with permission from J. Richtsmeier: http://getahead.psu.edu/landmarks_new.html).
Point |
Anatomical description |
A |
Nasale: Intersection of nasal bones, rostral point |
B |
Nasion: Intersection of nasal bones, coudal point |
C |
Bregma: intersection of frontal bones and parietal bones at midline |
D |
Intersection of parietal bones with anterior aspect of interparietal bone at midline |
E |
Intersection of interparietal bones with squamous portion of occipital bone at midline |
F |
Anterior-most point at intersection of premaxillae and nasal bones, left side |
G |
Anterior-most point at intersection of premaxillae and nasal bones, right side |
H |
Anterior notch on frontal process lateral to infraorbital fissure, left side |
I |
Anterior notch on frontal process lateral to infraorbital fissure, right side |
J |
Intersection of zygoma (jugal) with zygomatic process of temporal, superior aspect, left side |
K |
Intersection of zygoma (jugal) with zygomatic process of temporal, superior aspect, right side |
L |
Intersection of parietal, temporal and interparietal bones, left side |
M |
Intersection of parietal, temporal and interparietal bones, right side |
Table 1 Anatomical description of landmarks used for morphometric analysis
Geometric morphometric methods
Differences in skull shape were analyzed using the 3D Landmark Coordinate Data and Euclidean Distance Matrix Analysis or EDMA. EDMA is a coordinate system-free method for statistically evaluating differences in size and shape of biological objects. EDMA converts 3D landmark data into linear distances, compiling a matrix of all linear distances between unique landmark pairs. In our samples, we used a customized EDMA version to calculate the distance in millimeters converted from the pixel size in the mCT scans. The distances between the landmarks were calculated by using the X, Y and Z coordinates of each landmark in the equation d=(√[(x2−x1)2+(y2−y1)2+(z2−z1)2]. Angles between landmarks were determined using the “measure angle” function of Analyze software.
Histological sections
Tissues were harvested after euthanasia and fixed with 4% paraformaldehyde, followed by demineralization with 0.5 M EDTA. Samples were embedded in paraffin and 5μm sections prepared for histologic analysis. Sections were placed on poly L-lysine coated slides, dried overnight and stained with H&E.
Statistical significance was assessed by Student's t-test. Values were considered statistically significant when p≤0.05. To assess the accuracy of the landmarking process, we placed 7 landmarks (A-E, L and M) on one skull and repeated the process 10 times. The overall median variability was 0.128mm with a maximum of 0.316mm (Q1=0.092 mm, Q3=0.163mm). This precision is similar to those reported for manual placement of landmarks mouse skulls.22,23
Direct comparison of Nf1ob-/- and control using the complete set of landmarks, showed several statistically significant differences in the linear distance between Nf1ob-/- sample and controls. Analysis of occlusion revealed that, Nf1ob-/- mice have a higher tendency to develop malocclusion of incisor teeth (Figure 2) as by 12 weeks of age 26% in Nf1ob-/- mice exhibit frank malocclusion of incisors. One hundred percent of animals were found to exhibit malocclusion by 48 weeks of age. The incidence of malocclusion in the C57BL/6 mouse genetic background is reported to be 0.046%.24,25 The increased frequency of malocclusion in Nf1ob-/- mice relative to control mice parallels dental abnormalities among NF1 patients.26 In many cases of craniofacial dysplasia in NF1 a plexiform neurofibroma or optic nerve glioma is found adjacent to the bone, which may drive dysplastic changes in bone. To rule out tumor involvement in the Nf1ob-/- mouse craniofacial defect we histologically examined, severe examples of malocclusion, facial asymmetry and proptosis of an eye. We found no associated tumors in these specimens (data not shown).
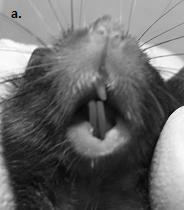


Figure 2 a: Malocclusion of incisors in Nf1ob-/- mouse. a. Incisor malocclusion in an Nf1ob-/- mouse (16 weeks of age); b: µCT frontal view of mouse skull confirms the deviation from the midline, resulting in incisor malocclusion, the occlusion of molars have not been evaluated; c: The time-course of progressive overt phenotype of malocclusion in the Nf1ob-/- mice (n=15).
Analysis of the nasal region showed that the anteroposterior linear distance (between landmarks A and B) to be shorter in Nf1ob-/- mice (compared control animals). However, there was no significant difference at the posterior region of the skull (i.e. the distance between landmarks B and E). There were no significant differences in the shape of the zygomatic bone region (landmarks H, I, J, and K) between Nf1ob-/- and control mice (Figure 3A & 3B). We measured the angle of deviation from the midline as defined by a line drawn through landmarks B, C, D, and E to test for asymmetry. Deviation from the midline of the landmarks representing the nasal and premaxilla (landmarks A, F, and G), revealed this region in Nf1ob-/- mice to be significantly deviated (3.30±1.47o) from the midline compared to control animals (0.204±0.15o) (p<0.0001). Nasal and premaxilla of 8 animals were deviated to the left and 2 animals deviated to the right, with greatest angle of 6.7o in Nf1ob-/- mice compared to the greatest angle of 0.4o in control mice (Figure 3D & 3E). In the neurocranium region the linear distances oriented along the mediolateral axis (landmarks L and M) and the distance along the rostro-caudal axis (landmarks C and E) showed no significant difference between Nf1ob-/- and control mice (Appendix Figure 1A). A trend toward macrocephaly is however present in Nf1ob-/- mice with an average distance between landmarks L and M of 9.28±1.7mm compared to 8.06±0.57mm in control (Appendix Figure 1). From the lateral aspect, the linear distance between landmarks A and E was reduced in Nf1ob-/- mice, as mentioned previously, however the distance between landmarks B and E as well as C and E were similar in Nf1ob-/- and control mice. This gives an indication that the disturbance in the anteroposterior dimension of the skull in Nf1ob-/-mice was confined to the frontal region of the skull. Moreover, measuring the angle between two lines (i.e. the first line passing through landmark A and B; and the second one between C and D), showed that the Nf1ob-/- mice display a more acute angle with an average of 138.2±3.17o compared to control mice at 146.8 ± 2.17o (Figure 4). These measurements were significantly different between Nf1ob-/- mice and control (p<0.0001) (Figure 4c). Thus, the nasal and premaxilla bones are tipped downward in Nf1ob-/- mice while control mice showed a more flattened, or straight arrangement antero-posteriorly.


Figure 3 Facial deformity and midline deviation in Nf1ob-/- mice. Superior view of 14-week old mouse cranium a: Nf1ob-/- mouse, showing shorter linear distance between points A and B, and nasal bones deviated from the midline (red line), when compared to control mouse; b: Nf1fl/fl mouse. c: Anterior view of 16w old mouse face showing deviation from the midline and proptosis of an eye, which is a typical presentation of the craniofacial deformity in NF1. d: Superior view of 14-week old Nf1ob-/- mouse cranium showing deviation of the anterior part of the skull from the midline. The red lines showing the angle between Nasale (landmark A) and the midline (i.e. straight line passing through points; C and D). e: Variation in midline in Nf1ob-/- and control Nf1fl/fl mice showed a significant difference with p<0.0001.


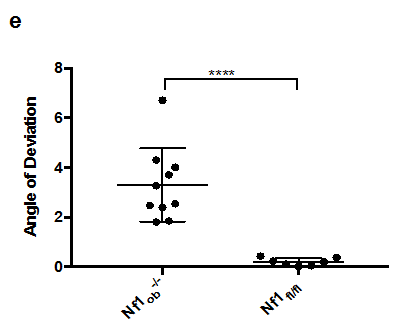
Figure 4 The craniofacial deformity in Nf1ob-/- mice from a lateral view. (A) Nf1ob-/- mouse cranium (14 weeks of age), showing more acute angle between two lines (first, between A and B; and second, between C and D), when compared to control Nf1fl/fl mouse. (B) This indicates that the rostrum, or face, demonstrates klinorhynchy or a downward tipping face in Nf1ob-/- mice which contributes to the resultant facial deformity. (C) Nasal bones are tipped downward in Nf1ob-/- mice. Graph showing that Nf1ob-/- mice have a more acute angles of anterior part of the skull relevant to the neurocranium with an average of 138.2° compared to control Nf1fl/fl mice with an average of 146.8°. The difference in angle between Nf1ob-/- and control mice was statistically significant with p< 0.0001.
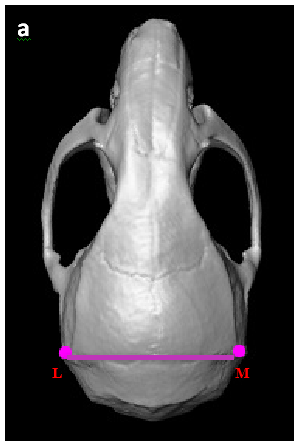
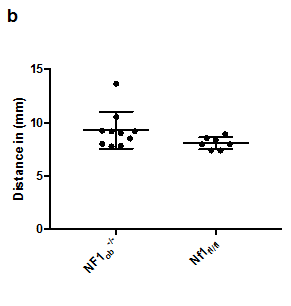
Appendix Figure 1 A trend toward macrocephaly in Nf1ob-/- mice. (A) Superior view of mouse skull showing the distance measured to analyze the neurocranium. (B) Average neurocranium in Nf1ob-/- mice is slightly larger. The difference is not statistically significant compared to control however, it indicates a trend toward macrocephaly.
In this study we showed that Nf1ob-/- mice develop facial deformity and malocclusion with osteoblast conditional deletion of the Nf1 gene. The phenotype is progressive, is unilateral, and often results in proptosis of an eye. This phenotype is strikingly similar to sphenoid wing dysplasia in NF1, which positions these animals as models with which to test interventions and mechanisms. The skeletal abnormalities in NF1 and their molecular basis has been difficult to study, in part because Nf1(+/-) mice do not display a skeletal phenotype and Nf1(-/-) mice die in utero before bone formation occurs.27–29 Elefteriou and colleagues in 2006 generated mice lacking Nf1 gene in osteoblast cells; the bone cells in which neurofibromin expression is the highest.19 This conditional deletion bypasses the embryonic lethality of a somatic deletion of the gene, generating a mouse model allowing for the analysis of the function of NF1 in bone and further study of the resulting skeletal abnormalities. No axial or appendicular skeletal abnormalities are seen in Nf1ob-/- mice. They do however present with a high bone mass phenotype with increased osteoblast numbers, increased bone formation and increased osteoclast numbers. We observed that Nf1ob-/- mice have a progressive facial asymmetry. Nf1ob-/- mice develop malocclusion and proptosis of an eye. In mice, malocclusion occurs when the incisors overgrow due to misalignment of the jaw. Therefore, the mandibular and maxillary teeth do not properly occlude.24,30 The incidence of malocclusion in the C57BL/6 mouse genetic background has been shown to be 0.046%.24,25 We found that 26 percent of Nf1ob-/- mice on the C57BL/6 background, by 12 weeks of age animals displayed frank Nf1ob-/- malocclusion of the incisors. One hundred percent these mice displayed malocclusion by 48 weeks of age (Figure 2). Malocclusion frequently accompanies sphenoid wing dysplasia in NF1.31 and it has been proposed that the incidence of asymmetry in the midface region and sphenoid wing dysplasia may be much higher if detailed radiographic studies of asymptomatic NF1 patients are performed.32 Using geometric morphometric analysis, we show that Nf1ob-/- mice develop asymmetry of the nasal region. As shown in Figure 3A & 3C, the nasal bones were found to diverge significantly from the long axis of the cranium. This dysplasia was found to be either to the left or right and was independent of sex. Additionally, the nasal region in Nf1ob-/- mice was found to demonstrate klinorhynchy or be tipped downward to a significant extent (Figure 4).
In NF1, the most clinically striking craniofacial change is facial asymmetry and dysplasia of the sphenoid bone resulting in unilateral eye proptosis.33 Computed tomography (CT) imaging reveals enlargement of middle cranial fossa with sphenoid bone changes. While cranial bones develop from analogous structures and by similar mechanisms between mouse and human, mouse cranial bone morphology is different from human.34 In mice, the eyes are not in orbits as such but in more of a channel formed by the zygomatic arch. The sphenoid bone does not form a large portion of the orbits as in humans. The eyes also are on the side of the head and point more up and out rather than forward as in the human. We find significant and robust changes in the nasal region of Nf1ob-/- mice. This pattern of deformed frontal midface region of the skull in Nf1ob-/- mice parallels the quantitative changes in the analogous structures in human NF1 craniofacial skeleton resulting in unilateral proptosis of an eye and facial asymmetry.12–26 NF1 patients often exhibit macrocephaly. We find a weak trend toward macrocephaly that does not rise to statistical significance (Supplementary Figure 1). It is possible that the pathways and signaling in of neurofibromin the neurocranium is different from that of the viscerocranium or if the mechanism of macrocephaly in NF1 is not osteoblast dependent.
It has been hypothesized that the dysplasia of sphenoid bone is unique and not like other bony abnormalities in NF1 and has been proposed to originate secondary to plexiform neurofibromas (PNF) which affect the nearby bone structure.33 We find no tumoral involvement in the Nf1ob-/- mice with malocclusion and proptosis of an eye. In addition, expression of the of 2.3kb col1α1 promotor-driven Cre recombinase has not been reported in neural tissues. Therefore, due to the primarily osteoblast expression of the of 2.3kb col1α1-Cre, our data support an osteoblast origin for sphenoid wing dysplasia and craniofacial asymmetry in the absence of tumor in NF1. It has been proposed that the skeletal dysplasia in NF1 is dependent upon a defect in mechanical signaling in bone cells.35 The differentiation and function of osteoblasts and osteoblast-lineage cells is well known to be modulated by mechanical signaling. Mechanical signaling in osteoblast cells has in turn been shown to occur via signaling through the RAS pathway, which is negatively regulated by the neurofibromin protein.36–38 In mice the largest mechanical forces encountered are likely masticatory forces present while chewing. Interestingly, bones and muscles involved in mastication are those primarily affected in Nf1ob-/- animals. Indeed, sphenoid wing bones anatomically articulate with maxillary and zygomatic bones and the neurocranium,39,40 which is less affected in the Nf1ob-/- model.
In conclusion, we have identified a mouse model of craniofacial dysplasia in NF1, which will help identify the molecular mechanism and pathways responsible for the craniofacial deformity in NF1 syndrome. There are currently no treatments known that block or slow the progression of sphenoid wing dysplasia in NF1. The Nf1ob-/- mouse represents a novel and relevant mouse model that recapitulates the phenotype of sphenoid wing dysplasia in NF1. Nf1ob-/- mice provide an important tool with which to test treatments to prevent facial deformities in pediatric NF1 patients.
None.
The authors declare there is no conflict of interest.

©2017 Bamaga, et al. This is an open access article distributed under the terms of the, which permits unrestricted use, distribution, and build upon your work non-commercially.