Journal of
eISSN: 2373-4396


Review Article Volume 1 Issue 5
Department of Internal Medicine, Military Hospital, Macedonia
Correspondence: Slavica Mitrovska, Department of Internal Medicine, Military Hospital, Macedonia ul. Sole Stojcev br. 1-2/8, 1000 Skopje, Macedonia, Tel 38971385267
Received: September 08, 2014 | Published: October 13, 2014
Citation: Mitrovska S, Lazeska B. Contemporary echocardiographic techniques in early detection of diabetic cardiomyopathy. J Cardiol Curr Res. 2014;1(5):125-129. DOI: DOI: 10.15406/jccr.2014.01.00025
Diabetic cardiomyopathy is defined as heart failure independent of hypertension, coronary artery and valve disease. It has multifactorial etiology and the pathogenesis is still incompletely understood. Structural changes lead to functional alterations of the left ventricle (LV) and diastolic dysfunction is the earliest sign. It has long asymptomatic period, but with the time leads to reduced contractile function. Diagnosis of diabetic cardiomyopathy is a challenge for cardiologists. As an entity, it exists for more than 4 decades, but no single diagnostic method yet and no established standard diagnostic criteria. Current technology and methods are still subjects of modification and they are not routinely used in daily practice. Therefore, late diagnosis of cardiovascular complications of diabetes is very often, even at the stage of overt heart failure.
Echocardiography is a diagnostic method of choice, from practical and economic point of view, but conventional techniques-two-dimensional (2D), M-mode echocardiography and Pulsed-waved (PW) Doppler analysis have limitations and provide inconclusive results. Contemporary techniques-Tissue Doppler Imagine, Color M-mode, 2D Speckle Tracking, strain and strain-rate are more sensitive and relatively independent to the loading conditions methods that provides comprehensive assessment of myocardial tissue velocities. They have capability for early detection of LV diastolic dysfunction and identification of high risk patients for developing heart failure.
The implementation of these techniques in everyday practice, as an integral part of echocardiographic evaluation of asymptomatic diabetic patients, would be of great importance of early treatment initiation, resulting in delay of disease progression.
Keywords: diabetic cardiomyopathy, tissue doppler imaging, color m-mode-technique, 2d speckle tracking, strain, strain rat
LVDD, left ventricular diastolic dysfunction; PW, Pulsed-Wave Doppler; TDI, tissue doppler imagine; EF, ejection fraction
Heart failure is a major cause of high morbidity and mortality in diabetic populations. Usually occurs as a consequence of premature atherosclerosis and CAD, but numerous experimental and clinical studies suggests a link between cardiomyopathy and diabetes in the absence of hypertension, valve and coronary artery disease. Heart failure in asymptomatic diabetic patients represents a distinct clinical entity-diabetic cardiomyopathy. Although the term was first introduced by Rubler et al.,1 controversies still exist regarding pathophysiology and treatment. Diabetic cardiomyopathy has a progressive course. The etiology is multifactorial. Metabolic changes lead to cellular and molecular abnormalities, but the pathogenic and pathophysiological mechanisms are not defined in details. Structural changes lead to functional abnormalities of the left ventricle (LV). At the beginning, they are asymptomatic, but with the time, lead to overt heart failure. Current knowledge of pathophysiological mechanisms in diabetic cardiomyopathy is not consistent enough to take responsibility for the onset of cardiomyopathy, independently. This fact arouses suspicion of the existence of an additional risk factor that affects the myocardium and leads to dysfunction. The last decade, the interest is focused on the research of metabolic disturbances of the myocardium:
Pathophysiological mechanisms in the development of diabetic cardiomyopathy: Haemodynamic and cellular mechanisms lead to structural and functional damage of the myocardium and the onset of diabetic cardiomyopathy. The diastolic dysfunction (DD) is the first abnormality, but with the time, leads to systolic dysfunction. In systolic heart failure, the main functional abnormality is impaired myocardial contractility, where the calcium ion plays the main role. Haemodynamic changes consist of low ejection fraction (EF), low stroke volume and decreased cardiac output. They lead to increased LV after load and passively increased pressure in LA and in pulmonary veins. The consequences are pulmonary congestion, right heart failure, and secondary tricuspid regurgitation (TR).3
In diastolic heart failure, two mechanisms contribute to diastolic dysfunction:
Diagnostic approach: Noninvasive assessment of left ventricular function
Diabetic cardiomyopathy is a challenge for cardiologists, regarding the diagnosis and treatment. The early structural changes of the myocardium are manifested as LV diastolic dysfunction. Its progressive course starts with abnormal relaxation and with the time leads to systolic dysfunction (decreased contractile function).5 although diabetic cardiomyopathy as an entity exists for more than 4 decades, there is no single diagnostic method, nor set of standard diagnostic criteria.
The working group on diastolic heart failure in European Society of Cardiology, led by Prof. Paulus Walter, suggests three criteria for diagnosis of diastolic heart failure:
Recently, European Society of Cardiology published a new set of criteria for the diagnosis of diastolic heart failure. It includes ejection fraction, end-diastolic volume, parameters of Tissue Doppler Imagine, LV hypertrophy, left atrial size and concentration of natriuretic peptides. However, the technology and methods used for the diagnosis of diabetic cardiomyopathy are still subjects of modification and they do not have routine use in daily practice. Therefore, delayed diagnosis of diabetic cardiovascular complications is very common, even at the stage of overt heart failure. Hence, the need of complementary diagnostic strategies for early detection of subclinical forms of myocardial dysfunction is evident. The goal is timely implementation of therapeutic strategies and improves the prognosis.
Echocardiography is the diagnostic method of choice, from practical and economic point of view, in detection of early stages of myocardial structural and functional alteration.
Conventional techniques-two-dimensional (2D), M-mode echocardiography and Pulsed-wave Doppler Analysis (PW)-are standard and commonly used techniques for assessing LV function.
LV systolic function can be assessed by 2 methods:
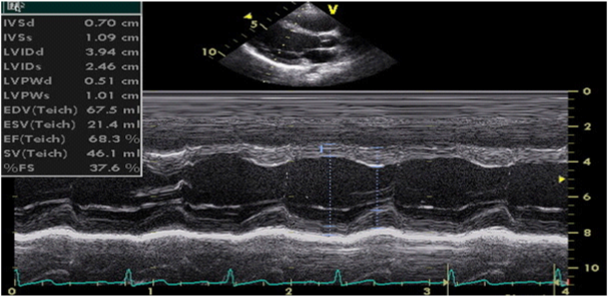
Figure 1 M-mode echocardiography (parasternal long-axis view, calculation of LV volumes and ejection fraction by Teichholz method).
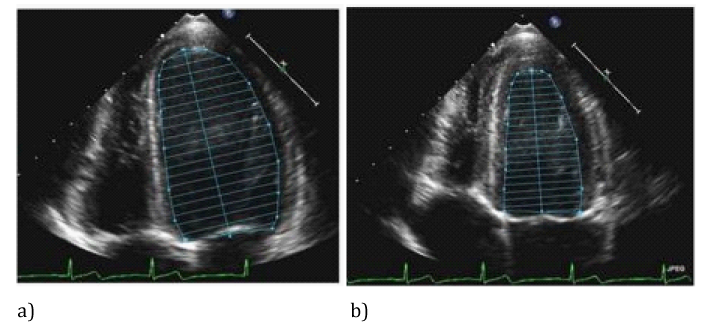
Figure 2 Bi-plane disc method (modified Simpson method) calculations of LV volumes and ejection fraction by tracing LV endocardium in diastole (a) and systole (b).
Ejection fraction is expressed as a percentage and is calculated by the formula: EF = (EDV-ESV)/EDV.
Ejection fraction greater than 55% is considered as normal systolic function. EF between 40% and 55% is considered as slightly reduced, EF of 30-40% is considered as moderately reduced and EF less than 30% is considered as severe reduced systolic function.7
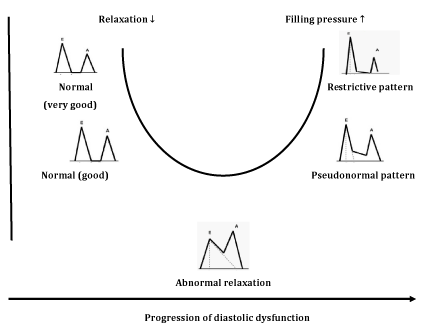
Figure 4 E/A ratio profile changes (U shaped) following deterioration of diastolic function.9
Classification of diastolic function, Depending on transmitral flow velocities, diastolic function is classified into four groups:
Although PW Doppler technique may detect the mild stage of diastolic dysfunction, it has several limitations. Thus, transmitral flow velocities depend of many factors (volume changes, heart rate, left atrial pressure), that make the method inadequate for the diagnosis of diastolic dysfunction. These factors are present in many pathological conditions (not only in diabetes) and PW Doppler provides inconclusive results. Another disadvantage of PW Doppler analysis is common misinterpretation of pseudonormal type as normal diastolic function, due to the similarity in E/A ratio profile. To distinguish the two profiles, Valsalva maneuver can be performed (forced expiration through the closed nostrils), whereby, E and A velocities decrease proportionally with a decrease in LV filling. Also, several studies note later detection of DD in diabetic patients with PW Doppler compared with new echocardiographic techniques.11
Tissue Doppler Imaging is more sensitive diagnostic method than Pulsed-wave Doppler analysis. It is relatively load independent and better reflects LV function in patients with heart failure with preserved ejection fraction. The technique is based on the following principle: in the apical, 4-chamber position, a 2-5mm sample volume is placed of the mitral ring, medial (septal) and lateral segment, to measure velocity of longitudinal motion (shortening and lengthening). Mitral annulus moves toward the top of the LV, in systole, and away from the top in the diastole phase. S-(systolic) wave, E’ and A’-wave (diastolic waves) are recorded. E’-wave (early diastolic velocity) reflects LV relaxation (elongation) while A’-wave (late diastolic velocity) reflects LA contraction and late LV filling (shortening). E’-wave progressively decreases with decreasing of longitudinal lengthening (relaxation) in various pathological conditions. It is one of the earliest markers of diastolic dysfunction and is present in all stages. Recent data suggest that the velocity at the septal corner can be influenced by various factors (LV filling) and can be reduced in patients with normal LV function. Therefore, it is preferred to measure the velocity of the lateral segment of the mitral annulus (Figure 5).12 The E’ wave at the lateral segment, greater than 10 is considered normal, while E’ less than 10 is indicator of increased LV filling pressure. The E’ wave at the septal segment, greater than 8 is considered normal, while E’ less than 8 is indicator of increased LV filling pressure. Nagueh et al.10 noted that E/E’ ratio gives more accurate estimation of LV filling pressure than E-wave velocity. The E/E’<8 is considered normal LV filling pressure. Value greater than 15 is indicative of increased, while the value from 8 to 15 is considered as slightly increased LV filling pressure.9,13 Table 1 represent the normal velocities of septal and lateral E’-waves, depending on age. TDI has ability to distinguish normal from pseudonormal Doppler profile. Thus, Boyer et al.14 in their echocardiographic study of diabetic patients without hypertension, coronary and valve pathology, found mild diastolic dysfunction in 74% with TDI, compared to PW Doppler analysis with Valsalva maneuver.
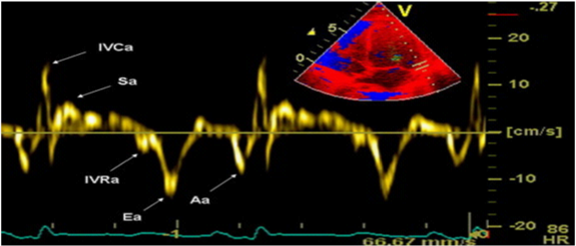
Figure 5 TDI of the lateral segment of the mitral annulus.12
|
Parameters |
Adult groups |
||
|
<40 y |
40-60 y |
˃60 y |
|
|
Septal E' (cm/sec) |
˃9 |
˃7 |
˃6 |
|
Lateral E' (cm/sec) |
˃11 |
˃10 |
˃7 |
Table 1 Normal values of Tissue Doppler diastolic parameters, depending on age.14
Technique evaluates LV diastolic function, by measuring early diastolic flow propagation velocity, from the mitral valve to the top of the LV. The assessment is done by apical, 4-chamber position, with the M-mode line placed through the middle of the mitral valve orificium. The color scale is set to the lowest Nyquist level, so the fastest jet in the central part has a blue color. The flow propagation velocity (Vp) is measured by moving the transduser, from the level of the mitral valve to the LV, up to 4 cm in depth. The slope of Vp greater than 50cm/s is considered normal (Figure 6).15 In healthy individuals, the flow propagation velocity is greatest at the basal segments of the LV and slightly reduces the velocity, moving to the top. In diastolic dysfunction such as abnormal relaxation, the initial LV filling is most frequently at the level of the basal segments and then declines. Very often, the jet reaches the top of the left ventricle as a result of reduced apical suction. Vp ranges from 45-50cm/s and graphic displays greater slope. Patients with Vp<45 cm/s were considered to have pseudonormal or restrictive type of DD. Recent studies conclude that the ratio between transmitral E-wave and Vp (E/Vp), more reliable estimates the LV filling pressures and serves as a good predictor of adverse cardiac events. The value of E/Vp>1.5 is a strong predictor of heart failure during intra-hospital period. The value of E/Vp>2.5 corresponds to the pulmonary capillaries pressure greater than 15mmHg.16
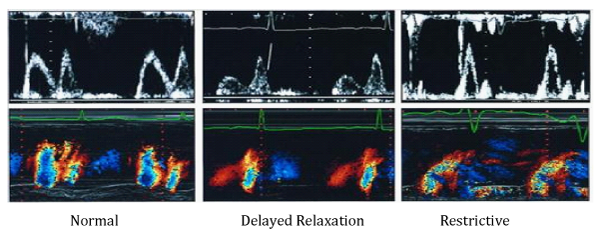
Figure 6 Pulsed and Color M-mode analysis of LV filling in patients with normal diastolic function, abnormal relaxation and restrictive type of transmitral flow.16
Two-dimensional analysis of deformation and rate of deformation of the myocardial segments (2D Speckle Tracking, strain, strain-rate)
It is a new, noninvasive, load independent technique that provides advanced analysis of myocardial mechanics. It quantifies the segmental and global LV function as well.17 During the cardiac cycle, the myocardium passes through the multiple complex three-dimensional deformations, whose borders are moving toward each other. There is consent, deformation in elongation and thinning to be considered positive, while shortening and thickening to be considered negative values. This method consists of evaluation of speckle tracking displacement of the myocardium, analysis of the points of maximum velocities during the cardiac cycle, and semiautomatic calculation of the distance between the peak velocities (Figure 7).18 The quantitative evaluation of myocardial deformation is performed in 3 spatial directions–longitudinal, radial and circumferential. By speckle tracing displacement, the system can calculate offline and after adequate image acquisition displacement, velocity of displacement, strain (deformation) and strain rate (rate of deformation). The epicardium is manually traced in apical and/or short axis view, and endocardium is automatically traced by the system. The region of interest is divided into 6 segments by the software, and the segments with no good image quality are excluded.
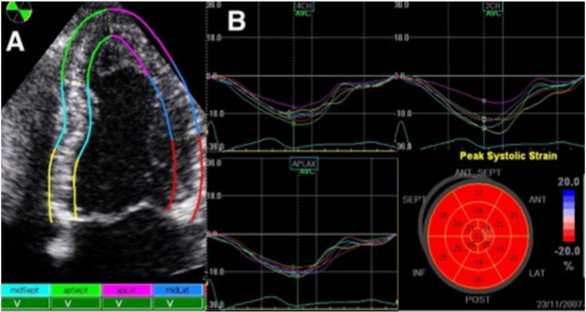
Figure 7 Two-dimensional analysis of deformation of myocardial segments. А) Velocities of movement of each segment, B) Strain profile from each segment. Bull’s eye: Average mean of each segment.19
The postsystolic index (the percentage of postsystolic strain compared to the maximum strain peak of the evaluated segment) Bull’s eye, can be obtain. The degree of deformation (strain) is expressed as a percentage, and strain rate is expressed in seconds-1. In healthy individuals, longitudinal systolic strain rate ranging from 1.0/s to 1,4 /s and for longitudinal strain in most segments varies from 15-25%, for radial strain ranging from 50-70% and for circumferential strain varies from 20-22%. Reduced values installment of deformation is markers of LV subclinical dysfunction and have predictive role in adverse cardiac events. Global longitudinal strain, calculated as the sum of the longitudinal systolic maximum value of each segment, divided with the number of segments. Longitudinal strain is myocardial deformation from the base to the top of LV. Circumferential strain is determined in parasternal short axis at the level of the papillary muscles and represents myocardial shortening. Radial strain is deformation directed to the center of the LV cavity.19
Several studies investigate the link between impaired composition of the extracellular matrix and LV dysfunction. Strong Heart Study analyze LV function in diabetic patients and found that the extent of DD was directly proportional to the HbA1c level and the accumulation of advanced glycosylation end products (AGEs) in the myocardium increases cross-linking of collagen, and provokes myocardial fibrosis. Structural changes leading to functional disturbances of LV and the extensiveness of myocardial fibrosis determines the degree of DD.20 Echocardiography is able to register the characteristics of diabetic cardiomyopathy (normal LV size and volumes, LVH, decreased compliance, preserved systolic function and altered LV filling pressures).21 These are similar to other types of restrictive CMP (infiltrative processes that include amyloidosis, haemochromatosis, sarcoidosis) and they should be distinguished from constrictive pericarditis. In this regard, conventional echocardiography may be limited by inadequate acoustic window. Also, pulsed-wave Doppler analysis cannot make distinction between pseudonormal filling pattern and normal diastolic function.22 Contemporary echocardiographic modalities, especially strain and strain rate, overcome this problem and provide useful information about the myocardial deformation and early detection of LV dysfunction. Additional techniques, cardiac CT and cardiac MRI can assist in diagnostic process. Late gadolinium magnetic resonance is non-invasive, x-ray free technique that provides detailed tissue characterization and quantification of myocardial fibrosis. It is more sensitive to detect even small subendocardial lesions and is highly effective to indentify the aetiology of LV dysfunction. Cardiac MRI clearly demonstrates the thickness of the pericardium and despite to its limitations (chronic renal failure, intracardiac devices, arrhythmias), it has diagnostic and prognostic significance. Gated computed-tomography CT scanning is an accurate technique for evaluation of cardiac function, but requires radiation and intravenous contrast application. Therefore, it is not suitable for serial follow-up and for detection of fibrosis, perfusion and wall motion. It is often used in evaluation of coronary arteries and coronary calcification. Summarizing the positive and negative features of imaging modalities, can be noted that contemporary echocardiographic techniques offer precise information on morphological and functional characteristics of diabetic cardiomyopathy. As a non-invasive, inexpensive methods, they can be performed frequently, enabling better risk assessment and predict prognosis.
The analysis of left ventricular diastolic function is an important part of the diagnostic algorithm in diabetic cardiomyopathy. The implementation of new echocardiographic techniques in everyday practice, as an integral part of echocardiographic evaluation of asymptomatic diabetic patients, will contribute for early detection of diastolic aberrations. Also, it will be of great importance of early treatment initiation, resulting in delay of disease progression.
None.
Authors declare that there are no conflicts of interest.
None.

©2014 Mitrovska, et al. This is an open access article distributed under the terms of the, which permits unrestricted use, distribution, and build upon your work non-commercially.