Journal of
eISSN: 2373-6437


Review Article Volume 11 Isuue 3
1Associate Professor (Anesthesiology & Critical Care), NRI Institute of Medical Sciences, India
2Associate Professor (Obstetrics & Gynecology), GITAM Institute of Medical Science and Research, India
Correspondence: Vijayalakshmi Chandrasekhar, Associate Professor (Obstetrics & Gynecology), GITAM Institute of Medical Science and Research, Rushikonda, Visakhapatnam-530014, A.P., India
Received: November 28, 2019 | Published: December 2, 2019
Citation: krishnamurtin C, Chandrasekhar V. Endotracheal Cardiac Output Monitoring (ECOM). J Anesth Crit Care Open Access. 2019;11(3):85?89. DOI: 10.15406/jaccoa.2019.11.00416
Cardiac output reflects the amount of blood expelled by the heart in one minute and calculated as the product of the heart rate by the stroke volume. The variables that affect systolic volume are preload, afterload, and contractile function. Cardiac output is the main determinant of oxygen transport and its monitoring helps to establish the differential diagnosis of the possible causes of shock and optimizes its treatment. A less invasive technique to monitor cardiac output in real time is always preferable as it can be evaluated more quickly and easily, even if it is slightly less accurate, especially in critical situations that require a rapid assessment of the patient’s condition. There are a number of techniques that allow us to obtain measurements of cardiac output in a very effective and non-invasive way. The endotracheal cardiac output monitoring (ECOM) is an emerging technology for intubated patients enabling rapid real time and accurate data on the status of the cardiac output and various derived parameters. ECOM is poised to be the new gold standard in critical care management and an emerging toll in the armamentarium of intensivists.
Cardiac output (CO) is the volume of blood ejected by each ventricle per minute and is the product of stroke volume and heart rate. CO is an integral part of hemodynamic monitoring during anesthesia for major and high risk surgeries as it serves as a marker of oxygen delivery to the tissues and flags patients at risk of significant morbidity, mortality or both. It also guides treatment, primarily for fluid resuscitation and the use of vasoactive and inotropic drugs. An ideal CO monitor should be minimally or non-invasive, continuous, accurate, operator independent, cost effective, reproducible, reliable during various physiological states, inexpensive, safe and have fast response time.1
The use of thermos dilution technique using Swan Ganz catheters remained a gold standard for cardiac output measurement for many years. The search for newer, less invasive methods of measuring CO led to the introduction of numerous devices like arterial pulse contour analysis, thoracic bio reactance, vascular unloading technique, pulse wave transit time, and radial artery application tonometry, aortic Doppler and thoracic electrical bio impedance into clinical practice.2,3
The term ‘minimally invasive cardiac output monitors’ collectively describes all devices that calculate CO without requiring insertion of a pulmonary artery catheter (PAC). Each of these devices, utilizes different parameters to determine CO. The latest endotracheal cardiac output monitor (ECOM), is based on the principle that blood is a charged solution with fluid motion and volumetric changes as it is pumped by the left ventricle. Smart sensors and transmitters affixed to the cuff of the endotracheal tube in direct contact with the ascending aorta measure impedance signals that use algorithms to determine the cardiac output and other derived parameters in real time.
Evolution of co measurement
The early methods of assessing cardiac ouput were all indirect and invasive measurements. Adolf Eugen Fick (1829-1901) was the first to measure cardiac output in 1870 by measurement of oxygen concentration of arterial and venous blood and subsequent calculation of O2 consumption. In 1929, Werner Forssman inserted a ureteral catheter to perform right atrial catheterization on himself and documented this on x-ray film! In 1945, Coumand and Richards measured CO by direct Fick method. 1956: Forssmann, Cournand and Richards jointly won the Nobel Prize in Medicine. In 1970, Jeremy Swan and William Ganz developed their eponymous pulmonary artery (PA) catheter and revolutionized measurement of CO. Their invention enabled diagnostic measurements at the bedside and contributed to the birth of critical care medicine. In 1972, Forrester added a thermistor to the pulmonary artery catheter, allowing CO measurements by thermos dilution. Newer methods like bio impedance, Doppler and ECOM FOR non-invasive and direct, real time measurements of CO followed. The advantages and drawbacks of each technique is enumerated in Tables 1 and 2.4‒6
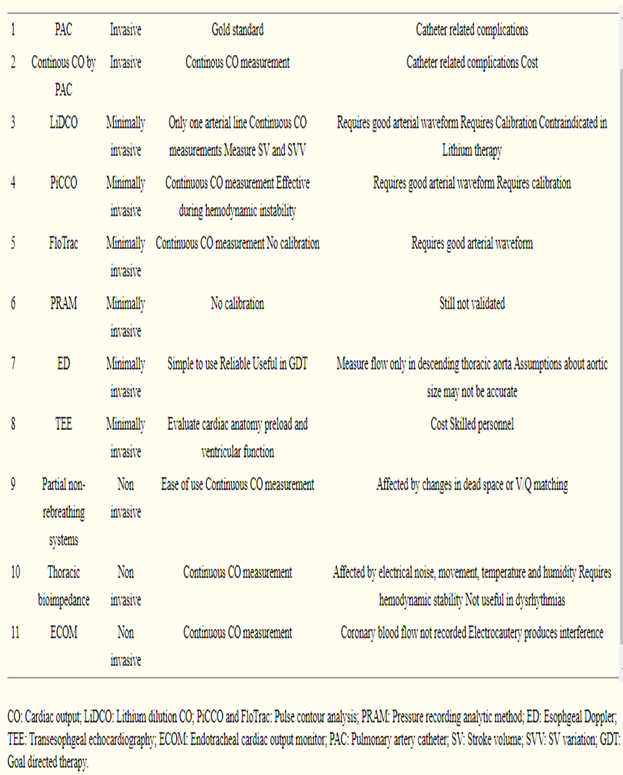
Table 1
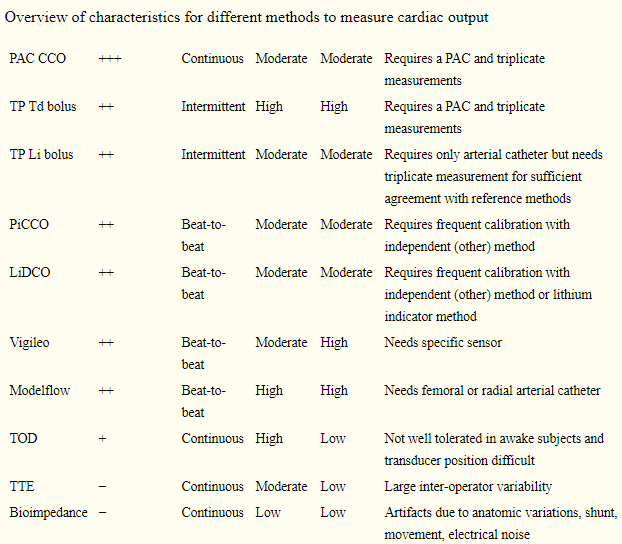
Table 2
ECOM:
The principle for ECOM is that blood is a charged solution with fluid motion and volumetric changes as it is pumped by the left ventricle. The electric resistance of blood changes when it moves or fluctuates in volume.
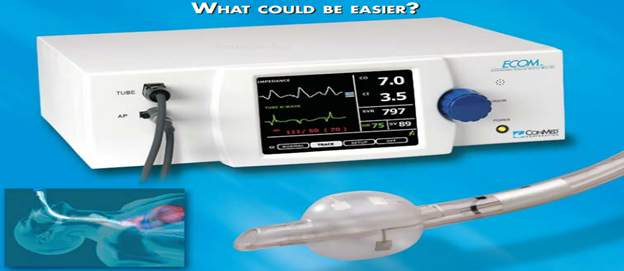
ECOM is dramatically different from other cardiac output monitors and based on bio impedance technology. The ECOM system uses an adaptive multi-parameter algorithm which allows for the reduction of between-subject variability. The endotracheal tube has 7 silver doped plastic electrodes. A low intensity high frequency alternating current (4 milliamperes at 20–100 kiloHertz) with input impedance of 1 mOhms applied to aspecially designed 7.5-mm internal diameter endotracheal tube designed with six electrodes with conducting ink on a plastic back ingglued on the cuff and one on the shaft. The electrode surface is smooth and atraumatic to the tracheal mucosa and the shaft electrode is a 15-mm-wide band that serves as a ground. Three orthogonal pairs of sensing transmitting and receiving electrodes (1 and 2, 4 and 5, 1 and 6) glued on the cuff is positioned immediately proximal to the tracheal bifurcation and in direct contact with the ascending aorta. Three impedance signals (DZx, DZy, DZz) are measured without any interference or anomalous signals from heart structures, lungs or the great vessels (Figures 1‒3). A three-dimensional impedance field is derived from these three inputs. Since the electrodes are positioned in close proximity to the ascending aorta the inputs are highly accurate. The electrode arrays and ECOM software have inbuilt software that automatically compensates for any changes in the positioning of the endotracheal tube and also that of the patient’s body, and displays a beat to beat measurement of the CO and derived parameters non invasively. The application of current to the electrodes on the endotracheal tube do not cause any injury to the tracheal mucosa even after 24 h of continuous use, as all circuits are electrically isolated.7‒10
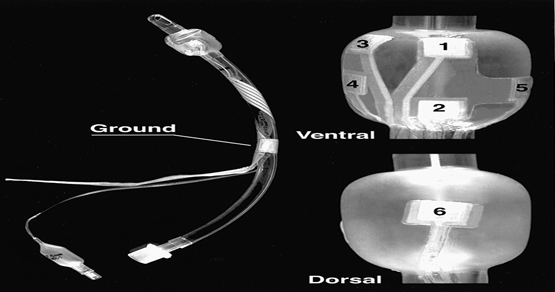
Figure 1 Model 6-3D endotracheal tube with six electrodes on the balloon and one ground electrode on the shaft. (Left) The entire endotracheal tube showing the ground electrode on the shaft of the tube. (Top right) Ventral surface of the balloon with electrodes 1–5. (Bottom right) Dorsal surface of the balloon with electrode 6. Electrode 3 is the current source. Electrode pairs 1 and 2, 4 and 5, and 1 and 6 give the three orthogonal signals.
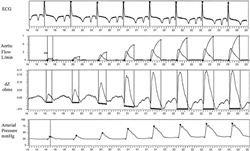
Figure 2 The top trace is the electrocardiogram derived from the endotracheal tube electrodes. The R wave is identified by a square and a vertical line. The second trace is aortic flow (liters/minute) measured by the transit time flow probe. The curve ending in a small square is the integral of transit time flow probe flow and gives stroke volume. The third trace is the change in impedance with time (DZ) measured in ohms. The trace between the two vertical lines corresponds to the aortic flow. The last trace is arterial pressure in millimeters mercury.11
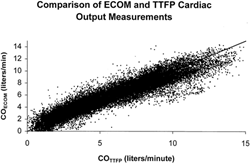
Figure 3 Plot of cardiac output calculated from the endotracheal cardiac output monitor system and the transit time flow probe-The relationship is linear.
Limitations
The ECOM electrodes must stay in contact with the tracheal mucosa at all times and, if they lose this, there will be loss of signal. However, the ECOM algorithm can compensate for any loss of contact of one or two of the sensing electrodes. This can also occur in the event of high airway pressures or poorly inflated endotracheal cuff, when several electrodes may lift off the tracheal mucosal surface. The signal will return if these situations are rectified.
The ECOM system applies the current and measures the resulting voltage directly from the tracheal mucosa. Hence the signal obtained closely matches the shape and appearance of the ascending aortic flow waveform avoiding flow signals from the superior vena cava, right atrium, left atrium, and pulmonary artery. It designed to maximize the aortic signal and minimize impedance signals from other vascular structures. There is no interference with other electrical equipment on the patient (e.g., ECG, pacemaker, diathermy etc.)
Hemodynamic parameters measured and calculated by the ECOM System:
Cardiac output and derived parameters like cardiac index, stroke volume and systemic vascular resistance are all displayed on the console.
Indications for ECOM:
|
Indications for ECOM cardiac output monitoring |
Influence on management |
|
Deranged cardiac function in shock states |
Titration of fluids, inotropes and vasopressors |
|
Goal-directed resuscitation of complex shock states |
|
|
Continuous monitoring following cardiac and non-cardiac surgery for high risk patients |
Early intervention for altered cardiac function |
|
Protocol-driven management of hemodynamically unstable patients |
Standardised management algorithms driven by cardiac output monitoring can support management decisions |
Summary
The ECOM system provides a continuous real time display of CO derived from impedance measurements sensed by its array of electrodes. A linear relationship between the ECOM and CO is ensured between 0 and 15 l/min and bias is estimated at 0.15 l/min and the standard deviation being 1.34 l/min. The limits of agreement are -2.53 to 2.82 l/min.11,12
The ECOM system is able to measure stroke volume and CO accurately without being influenced by variations in systolic pressure, hematocrit, blood conductivity, or time. The signal corresponds to the shape and appearance of the waveform in the ascending aorta and the electrode design filters flow signals from the superior vena cava, right atrium, left atrium, and pulmonary artery. A variety of factors (institutional, device related, and patient specific) influence the selection of a cardiac output monitoring devices and clinicians need to understand the underlying principles and the inherent limitations of these devices. Endotracheal CO monitor is a promising technology that will give a quantum leap to critical patient management strategies in the future.

©2019 krishnamurtin, et al. This is an open access article distributed under the terms of the, which permits unrestricted use, distribution, and build upon your work non-commercially.
