Journal of
eISSN: 2373-6437


Research Article Volume 10 Issue 1
1Associate Lecturer University of Queensland, Staff Specialist Department of Anaesthesia, Toowoomba Base Hospital, Australia
2Resident Medical Officer, MBBS, Logan Hospital, Australia
3Department of Anaesthesia, Princess Alexandra Hospital, Australia
4Associate professor University of Queensland, Senior Staff Specialist & Deputy Director, Department of Anaesthesia, Princess Alexandra Hospital, Australia
Correspondence: Alexander HO, Resident Medical Officer, MBBS, Logan Hospital, Armstrong Road, Meadowbrook, QLD 4131, Australia
Received: December 22, 2017 | Published: January 8, 2018
Citation: Woo TLP, Ho A, Guy KJ, Sivalingam P (2018) Lateralisation of the BIS Sensor during Carotid Endarterectomy Does it Really Matter?. J Anesth Crit Care Open Access 10(1): 00346. DOI: 10.15406/jaccoa.2018.10.00346
Bispectral index (BIS) monitoring provides a measure of depth during general anaesthesia. The manufacturer’s instructions state that the sensor can be positioned on either side of the forehead. It is not known whether sensor position affects the recorded BIS value during carotid endarterectomy (CEA). We hypothesised that there would be no difference in the recorded BIS values between left and right positioned sensors during CEA. 44 patients undergoing elective carotid endarterectomy surgery under general anaesthesia were enrolled in the study. Two BIS Quatro sensors (Covidien) were sited on each patient in both a left‒ and right‒sided configuration and monitored throughout the procedure. The average BIS values, SQI and EMG were recorded at one‒minute intervals. Anaesthetic management was left to the discretion of the attending anaesthetist. The surgical technique was at the discretion of the consultant surgeon. A shunt was inserted in all cases. The initial clamp time and time to opening of the shunt were recorded for all patients. A random effects model for repeated measures data was used to estimate the within‒subject variance (after adjusting for known and unknown variables) and create revised Bland – Altman plots. The revised Bland‐Altman plot demonstrated a mean difference (bias) between the operative (OS) and non‒operative (NOS) positioned BIS sensors of‐1 with 95% limits of agreement between ‐11 and +10. Our study demonstrated no significant difference between the average BIS value recorded from left and right positioned sensors during CEA.
Keywords: Bispectral Index (BIS), Evoked potentials, General anesthesia, Bland‒Altman plot, Revised random erects model, Carotid endarterectomy surgery, Brain ischaemia
Bispectral index (BIS) monitoring is commonly used to provide a measure of depth during general anaesthesia in attempt to reduce the rare occurrence of awareness.1,2 The Bispectral Index is a generated number between 0 and 100 that is derived through utilization of a number of advanced EEG signal processing techniques including bispectral analysis, power spectral analysis, and time domain analysis.3 The recommended range to reduce awareness is 40‐60 arbitrary BIS units. During carotid endarterectomy, clamping of the carotid artery may alter cerebral perfusion resulting in ischaemia with altered EEG activity.4 When monitored using a continuous EEG changes are commonly observed bilaterally, however asymmetrical changes are often seen.3 Electrocephalogram (EEG) changes during endarterectomy have shown global but not hemispheric changes which was correlated with systolic blood pressure variability during clamping.5 Bonhomme et al.6 recently investigated the use of BIS monitoring during carotid cross clamping with the sensor placed on the operative side of the forehead. They demonstrated that clamping of the carotid artery was associated with variable changes in BIS (increase, decrease, or no change at all) and suggested caution when interpreting BIS values during carotid cross‐clamping.
The manufacturer’s instructions for the BIS QuatroTM sensor state that the sensor can be positioned on either side of the forehead. There is limited evidence in the literature to support whether the side or site that the sensor is positioned is important. Chang et al.7 compared the recommended sensor placement to an “inverted mandible” placement in 20 patients and concluded that they correlated well. Neidhart et al.8 assessed the concordance of the simultaneous use of two BISxpTM devices during general anaesthesia and concluded that they did not always provide a reproducible single number. Howard et al.9 demonstrated that the use of bilateral BISxpTM monitors can detect inter‐hemispheric asymmetry in the dolphin species Tursiops truncates when they sleep in one cerebral hemisphere. All these studies used the first generation BISxp monitor that has now been superseded. Both Chang and Neidhart did not consider the continuous nature of the data in their statistical analysis and their conclusions may be incorrect. Therefore we designed this study to establish whether the position of the BIS sensor (i.e. left or right sided) makes a difference in the BIS reading during carotid endarterectomy.
The study was approved by the Princess Alexandra Hospital ethics committee. After informed written consent, forty‐three patients undergoing elective carotid endarterectomy under general anaesthesia were enrolled in the study. There were no exclusion criteria. The patient characteristics are summarized in Table 1.
|
Mean Age |
69 years(44‒87) |
|
Sex |
|
|
Male |
29 |
|
Female |
16 |
|
Mean BMI |
27.7kg/m2(19.6‒39.2) |
|
Mean ASA |
3 |
Table 1 Patient Characteristics
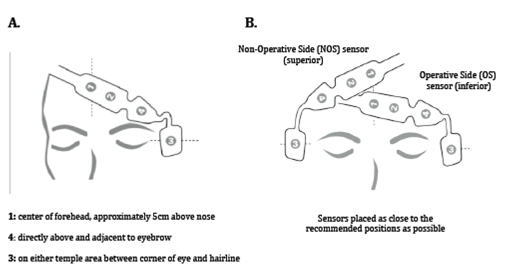
Prior to induction of anaesthesia, two BIS QuatroTM sensors (Covidien Ltd.) were sited on the patient in both a left‐ and right‐sided configuration as close to the positions instructed by the manufacturer. The sensors were designated as operative side (OS) and non‐operative side (NOS). The OS sensor was sited inferiorly and the NOS sensor superiorly for all patients to maintain a consistency in sensor placement (Figure 1).

Figure 1 Recommend positioning of the BIS QuatroTM sensor (A) and positioning of BIS QuatroTM sensors used in the study (B).
Two BIS VISTATM monitoring systems (Covidien Ltd.) were used throughout the procedure to monitor and store the average BIS, signal quality index (SQI) and electromyography (EMG) values at one‐minute intervals. The data was downloaded from the monitor into an excel spreadsheet at later date. Anaesthetic management was left to the discretion of the attending anaesthetist. All patients were induced with propofol and maintained with either sevoflurane or desflurane. Opiates were used in all cases in varying combinations of fentanyl, alfentanil, morphine, or remifentanil. Most patients received additional simple analgesics and antiemetics. Ketamine was not used in any patient.
A surgical consultant or their trainee registrar under consultant supervision performed the carotid endarterectomy. The surgical technique used was at the discretion of the consultant surgeon however all surgeons elected to routinely place a shunt in all cases.10 Initial clamping times of the carotid artery and the times the shunt was opened were recorded for all patients using the clock on the BIS monitor. BIS values from both the OS and NOS during the thirty‐minute period prior to clamping of the carotid artery, the time artery was clamped and the thirty‐minute period directly after opening the shunt were used for the analysis. A random effects model for repeated measures data as described by Myles and Cui was used to estimate the within‐subject variance to plot a revised Bland‐Altman plot to estimate the agreement between NOS and OS BIS values during the procedure.11
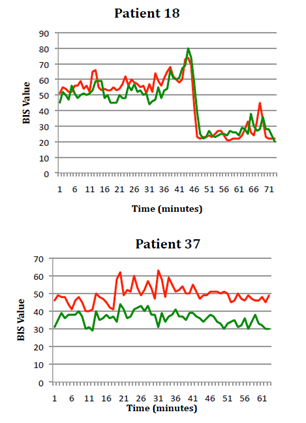
Data from six of the forty‐three patients was excluded from the analysis. Three patients had incomplete data sets – two due to monitor dysfunction (flat internal battery and the monitors not plugged into an external power source) and one due to sensor malfunction (loss of sensor contact due to excessive patient sweating). Two patients had incorrect clamping and shunt times recorded by the attending anesthetist. One patient lost data from one BIS monitor due to an unknown cause (the data from the BIS monitor was not present on the internal memory). Data from the remaining thirty‐seven patients was used in the analysis. Examples of BIS data are shown in Figure 2. Patient 18 demonstrates particularly good correlation between OS and NOS BIS values while patient 37 demonstrates the least correlation between BIS values of all patients in the study.

Figure 2 Examples of good (A) and poor (B) correlation between OS and NOS BIS values (OS green, NOS red).
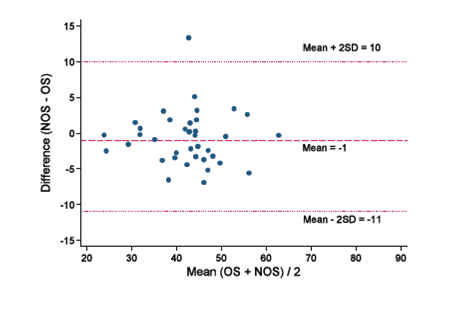
In a series of articles,12‒14 Bland and Altman advocated the use of a graphical method to plot the difference scores of two measurements against the mean for each subject. This has the limitation of using one‒way analysis of variance to estimate the within‒subject variance. By applying random effects model on the within‒subject variance with repeated measures data, we create an appropriate revised Bland–Altman plot.11 The revised random effects model is an extension of the analysis of variance method and it allows adjustments for many more covariates, in order to get a more precise estimate of the residual variation within a subject. Table 2 summarizes the within‐subject standard deviation between the OS and NOS for the different variables considered in the random effects model. When there is no covariate in the model (Model 1), the within‒subject SD for OS is 6.76. However, if we use Model 5 (Figure 3), which includes the mean measurements of the two methods for each measurement occasion, then the width of the 95% limits of agreement will be substantially reduced to 2.7. Addition of the clamp variable to the model had little effect in Model 6; therefore analysis is based on model 5 to construct the revised Bland‐Altman plot.

Figure 3 Bland‒Altman plot of the difference between NOS and OS against the mean of NOS and OS in the thirty‒seven patients in the study. The within‒subject variance is estimated by a random effects model which includes the mean measurements of the two methods for each measurement occasions.
|
Model and Covariate |
Within‒Subject SD |
|
|
OS |
NOS |
|
|
Model 1: No explanatory variables. |
6.76 |
5.91 |
|
Model 2: Adjusting for baseline. |
6.76 |
5.91 |
|
Model 3: Adjusting for mean value for the individual over time. |
6.77 |
5.92 |
|
Model 4: Adjusting for baseline and mean value for the individual over time. |
6.77 |
5.92 |
|
Model 5: Adjusting for baseline, mean value for the individual over time, and mean measurement between two methods. |
2.7 |
2.7 |
|
Model 6: Model 5 plus clamp variable. |
2.7 |
2.7 |
Table 2 Within‒subject standard deviation (SD) and variable in the model to estimate agreement between OS and NOS
The revised Bland‐Altman plot demonstrated a mean difference (bias) between the operative (OS) and non‒operative (NOS) positioned BIS sensors of‐1 with 95% limits of agreement between ‐11 and +10. The presentation of the 95% limits of agreement is for visual judgement of how well two methods of measurement agree. The smaller the range between these two limits the better the agreement is.
The use of the Bland‐Altman plot is well established method to compare two methods of measurement. Interpretation of agreement depends upon what is deemed to be clinically important. When using the BIS monitor there is a wide recommended target range (40‐60 arbitrary BIS units). If the middle of the recommended range is chosen, using the extremes of the 95% limits of agreement (i.e. +/‐ 2SD) estimated by the Bland‐Altman plot would give a BIS range of 39 ‒ 60. This range is acceptable clinically and therefore we conclude that there is no significant difference in BIS values between the OS and NOS recorded in the patients during the study.
It is important to consider why no difference was demonstrated. Possible reasons include the use of routine shunts resulting in clamp times too short to cause any significant lateralised difference in the EEG, an adequate collateral cerebral perfusion during clamping so that there were not any lateralised differences in EEGs, and finally that the BIS monitor was not sensitive enough to detect lateralised difference if present.
The use of carotid shunts may be a compounding factor to the study in detecting differences in BIS monitor placement. Assad15 demonstrated significant interhemispheric BIS differences during coronary artery bypass graft in patients with known carotid stenosis, however this study did not utilize a carotid shunt. A reduction in mean arterial pressure was found as a result of the aortic crossing clamping, despite an intact circle of Willis which should allow for contralateral brain perfusion to the diseased hemisphere. The differences were attributed to global reductions of cerebral hypoperfusion, as opposed to poor supply from one hemisphere to the other.
The suppression of unilateral hemispheric function with unilateral barbiturate injections into the carotid has also shown no differences in left and right BIS values. Heller et al.16 investigated EEG changes which were influenced through the use of sedative agents. These sedative agents showed significant decrease in EEG readings, however the carotid in which it was injected into had no impact in the changes. It is true that this differs from the current study, which looked into physiological cerebral perfusion and ischemia, however both studies have established that the BIS monitor are adequate in monitoring EEG changes despite its placement on the patient.
According to the findings of the present study, there is no significant difference between the average BIS values recorded from the operative and non‐operative positioned sensors during carotid endartectomy with shunts. Future studies will need to explore the population undergoing general anaesthesia without shunting.
This project is an original work and all sources of assistance or ideas of others have been appropriately acknowledged.
None.
None.

©2018 Woo, et al. This is an open access article distributed under the terms of the, which permits unrestricted use, distribution, and build upon your work non-commercially.