Journal of
eISSN: 2572-8466


Research Article Volume 2 Issue 4
1Department of Physical Sciences, Jawaharlal Nehru University, India
2Department of Nanosciences, Jawaharlal Nehru University, India
3Inter University Accelerator Centre, India
4Department of physics, Bhabha Atomic Research Centre, India
5Laboratory for Neutron Scattering, Switzerland
Correspondence: Bohidar HB, School of Physical Sciences, Jawaharlal Nehru University, New Delhi 110067, India, Tel 91 11 26704637, Fax 91 11 2674 1837
Received: December 28, 2016 | Published: March 10, 2017
Citation: Pandey PK, Rawat K, Aswal VK, et al. Structural Hierarchy in DNA Hydrogels. J Appl Biotechnol Bioeng. 2017;2(4):144-150. DOI: 10.15406/jabb.2017.02.00038
Sol-gel transition in aqueous DNA solutions was probed to determine the gelation time tgel and temperature Tgel. It was remarkable to observe that Tgel increased from 36 to 57°C and tgel linearly decreased from 700 to 350 s with increase in DNA concentration. The hydrogels were studied by using small angle neutron scattering (SANS) ([DNA]≤3%(w/v)) to determine the underlying hierarchy of length scales. From structure factor profile analysis, three distinct signatures were obtained:
Physical networks were formed for concentration, c*≥2%(w/v) and the system involved at least five identifiable length scales. A revisit has shown that hierarchical structure of DNA hydrogel owes its origin to considerable self-organization at the molecular level dependent on biopolymer concentration.
Keywords: DNA hydrogels, neutron scattering, guinier-regime, power-law, broad peak region, correlation length, self-assembly
SANS, small angle neutron scattering; EGDE, ethylene glycol diglycidyl ether
DNA is found to be an extraordinary biopolymer because it can be used as molecular tool to construct many other objects such as nano devices, periodic arrays and genetic engineering templates. DNA plays a vital role in many biological processes like gene therapy. But due to its large extended chains it cannot be delivered directly into the cells.1 DNA hydrogels are eco-friendly because these are biocompatible and biodegradable. Unlike other hydrogels, DNA hydrogel are different in terms of efficiency and strong branched cross-linking.2 The benefit of it is one can achieve gelling under physiological conditions that allows for the encapsulation of drugs, proteins and mammalian cells in the sol phase instead of drug-loading step and denaturing conditions.3 A strongly interactive PVA and DNA cryogel was prepared and it showed a good mechanical resistance due to its heterogeneous porous structure.4 For natural DNA, formaldehyde and metal compounds such as arsenic, chromate and nickel are widely used as cross-linkers which are known carcinogens.5,6 DNA-cross-linked PAA m gel could be used to release nano particles for potential drug-delivery vehicles in response to right stimulus .7 DNA hydrogels reversibly respond to thermal stimulus, by switching between the gel and sol state (transition temperature) and enzymes when restriction sites are inserted into one of the building blocks.8
DNA hydrogels have a wide range of biomedical application in tissue engineering and drug-delivery system.9 Lee et al inspired by silkworm and spiders gave the evidence for the formation of DNA hydrogel fiber with self-entanglement prepared in the presence of ionic liquid.10 Moran MC et al.9 prepared DNA gel particles and studied swelling, dissolution behavior and DNA release.9 They made DNA gel particles in the presence surfactant CTAB and protein lyzozyme, but without using any cross-linker or organic solvents. Orakdogen N et al.11 showed evidence of strain hardening in both physical and chemical DNA gels.11 Physical gels were prepared by physical cross-linking of DNA with heating-cooling cycle, while chemical gels were prepared by adding a cross linker like EGDE (ethylene glycol diglycidyl ether). Visco elastic properties of DNA gels and the crossover frequency for DNA in solutions that vary with concentration have been reported.12,13 Liu Y et al.14 described the relaxation time of double and single stranded DNA on the basis of viscosity measurement in an oscillatory flow and by stress relaxation measurements.14 DNA hydrogel relaxation dynamics has been found to be hierarchical in concentration.15 The differential shrinking of hydrogels in presence of NaBr and cationic surfactant has been reported.16 Rhelogical behavior of DNA hydrogels indicated that storage modulus G’ and loss modulus G’’ are frequency independent which is due to dominance of viscoelastic relaxation of the networks at lower frequencies.17
Hierarchical self-assembly in DNA gels is the primary factor which distinguishes and makes it versatile. At appropriate concentration and controlled flexibility, one-pot self-assembly of DNA gives rise to very small nanometer range tetrahedral, dedecahedra and bucky-ball size complex structures. Therefore, self-assembly of DNA allows formation of complex 3-D structures.18 DNA gels exhibit universal scaled stiffening behavior that can be reproduced by a wormlike chain model keeping in mind the entropic elasticity of DNA strands.11 For tissue engineering applications, due to biocompatibility and permeability of hydrogel, one can design the required three-dimensional constructions.19 In spite of the availability of a large volume of literature on DNA, the micro-structural probing of their hydrogels by SANS remains poorly explored. In this report, we have comprehensively studied DNA hydrogels using SANS to develop a general understanding of hierarchical self-organization of these networks. Considering the importance of the nucleic acids in genetic engineering and pharmaceutics, these results are of importance.
The salmon testis dsDNA sodium salt (2000 bp, molecular weight 1.3×10⁶ g/mol) and D2O (base solvent) were purchased from Sigma-Aldrich, USA. In the medium of (0.15M) sodium chloride and 0.015M sodium citrate, it has 41.2% G-C content and 87°C melting temperature. DNA was dissolved in D2O in different amounts (1-3% (w/v)) at 60°C, followed by heating to 90°C under stirring to denature the biopolymer. Finally, samples were gradually cooled to room temperature (25°C) while their viscosity was measured in real time (viscometer model SV-50, A & D Company, Japan) and the gels were subjected to SANS studies. Rigid gels were formed for DNA concentration, c*≥2% (w/v). The SANS experiments were carried out using the SINQ neutron source at PSI, Villegen, Switzerland. These measurements were carried out with 1.6 nm neutron wavelength where the scattering wave vector (q) was scanned in the range of 0.03-3.4 nm-1.20 The scattering profile, I(q) vs q, exhibited characteristic signature pertaining to the internal micro-structure of the samples. All the measurements were performed using a 2D position sensitive detector of size (96cm x 96cm), source wavelength of 0.8nm, and sample to detector distance of 28 and 20m and path length of quartz cuvette of 2mm. All concentrations are in (w/v) unless otherwise stated.
Sol-gel Transition
DNA solutions prepared with different DNA concentrations were analyzed for their characteristic sol-gel transition behavior. Time dependent evolution of viscosity η is shown by Figure 1 for different samples. The time dependent growth of viscosity could be described by the scaling relation given by 21
(1)
Here, relative viscosity , η0 is solvent viscosity, and tgel is gelation time.
The plot between ηr vs. t shown in Figure 1A, provided the characteristic time tgel obtained from the change in slope which was found to decrease with DNA concentration. It was found that as the DNA concentration was increased from 1 to 3%, the viscosity of DNA sol increased gradually due to the formation of inter connected physical networks. To fit relative viscosity data to time dependent power-law function was used and corresponding power-law exponent k was determined. Theoretical value for Rouse dynamics corresponds to k= 0.7 for conducting and k= 1.3 for percolating gel network.22,23 In our case, k= 0.13 ±0.02, implying invariance of the network growth process with DNA content. Although it was an indicative description of gelation, but on the basis of experimental data, it was possible to give a reasonable description to gelation kinetics. The gelation time was tgel ≈ 700 s for 2% gel, which reduced to 350 s when the DNA concentration was 3%. This clearly indicated that at higher concentration due to the propensity of DNA strands the physical entanglement was highly favorable that caused earlier gelation (Figure 2).
No gelation transition was noticed when the biopolymer concentration was less than 2%. The temperature of gelation was 36°C for 2% sample which enhanced to 57°C for 3% DNA gels. It is remarkable to note that just by raising the concentration it was possible to increase the gelation temperature by 63 %. At the same time the gelation time reduced by almost 50%. Further, the data shown in Figure 3, could be fitted to a straight line (chi-squared= 0.99) with a slope of »23 (°C (v/w)). The linear dependence of gelation temperature with DNA concentration was not reported hither to. This result will have significant bearing on the applications of DNA hydrogels.
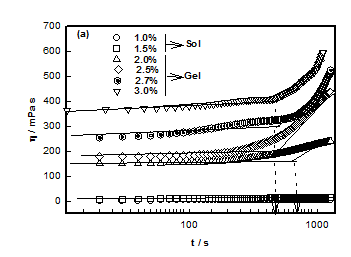
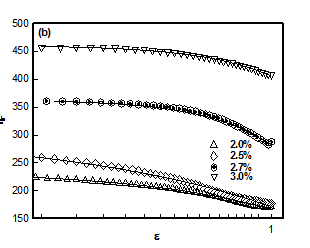
Figure 1
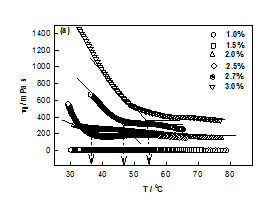

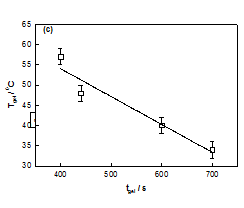
Figure 3
Static Structure Factor
The static structure factor profiles obtained from different DNA hydrogel samples are shown in Figure 4. The raw data was examined by checking their 1/I(q) vs q2 and vs q2 behavior which correspond to Ornstein-Zernike 24 and Debye-Bueche functions.25 The statistical accuracy of this fitting was poor. The best fit to the data was found when it was fitted to an empirical function given by equation (2). In this formalism, we have identified three ranges of scattering vectors q:
where Rg is known as radius of gyration of scattering moiety.
(2)
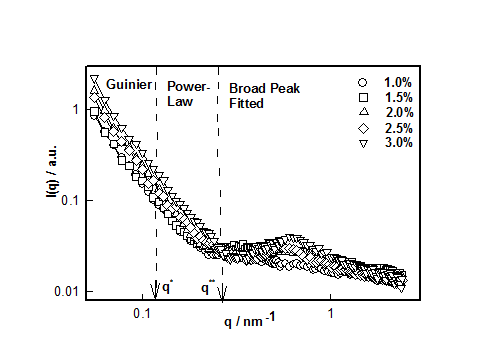
Figure 4 SANS correlation between static structure factor I(q) and scattering vector q for different DNA concentrations. These correlations are best fitted with Guinier, Power-Law and Broad peak (Lorentzian) functions in different q-ranges.
This mode of analysis yielded excellent chi-squared values (>0.97) in all the cases. The cross-over between low and intermediate and intermediate and large-q values are identified as q* and q**, respectively. These defined the signature length scales given by and
which plotted for different hydrogel samples. This biopolymer had an overlap concentration of c*(≥ 2%) above which the solution was in gel state (Figure 5). Remarkably, the value of L*(=50nm) coincides with the persistence length of DNA.26,27 The L** value was 26 nm in the sol and about 22 nm in gel state (Figure 5). Thus, to a very good approximation, L* ≈ 2L**. In the low q-region the scattering factor was approximated by Guinier-regime.
(3)
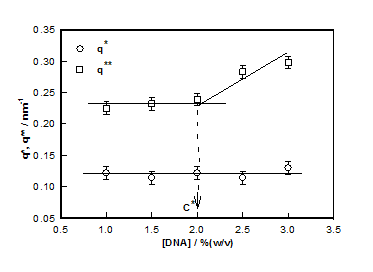
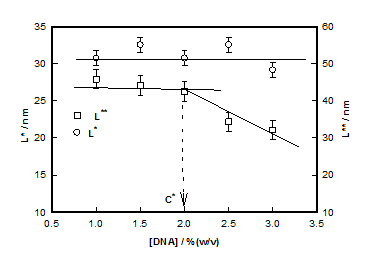
Figure 5
Where IG is the structure factor at very low q and the fitting yielded value of radius of gyration Rg ≈ 40±3nm in the sol state independent of DNA concentration (Figure 6). According to scaling laws correlation length dependence of ξ with concentration is given as.28
(4)
Where c*(»2 %) is the typical overlap concentration and ν is excluded volume exponent of the system. From this scaling relation, using ξ = 0.5- 3.3 nm (deduced from equation 6), Rg= 40nm and c= 2% and scaling exponent obtained was v~0.40-0.45. Thus, in the sol state DNA strands were in the poor solvent environment, which changed to marginal solvent situation as the gelation temperature was reached. Therefore, the sol-gel transition was concomitant with change in the solvent quality for this biopolymer. Since, this change was in the favorable direction of solubility, there was no phase separation, but a clear transition to gel phase occurred due to a propensity in the physical entanglement of the DNA strands. We use equation (4) with caution because it strictly applies to chemically cross-linked networks and gels. In the intermediate q-regime (0.12 nm-1≤ q ≤0.21 nm-1), power- law dependence of structure factor was defined by
(5)
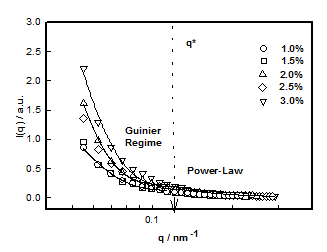
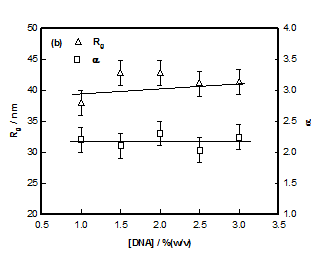
Figure 6
The least-squares fitting of data yielded the value for α ≈ 2.2±0.1 independent of DNA concentration (Figure 6B), which attributed Gaussian chain behavior (theoretical value=2) to these strands. SANS data in the high q-region was described by a signature broad-peak, a profile normally noticed in scattering from amorphous soft materials. In this formalism, the typical distance between scattering heterogeneities is explained by d-spacing, d0which is the peak position of the broad correlation peak located at q0.Theq0value signifies the peak position of different morphologies such as in lamellar, cylindrical, spherical or for bi-continuous structures.29 Here in the case of hydrogels one can see the significance of such a model. We identify d0 as average distance between the polymer-poor and polymer-rich regions. The following functional form (modified Lorentzian function) described the broad peak feature seen in our system Peak position q0 is related to d0 through the relation
(7)
Figure 7 data clearly shows that for the sample with 1% DNA concentration there was no correlation peak. As we increased the DNA concentration, the existence of broad peak became more prominent and its position shifted to lower-q0 value. Thus the value for d0 decreased from 16.0±1.0 to 10.0 ±0.8 nm which signified that the hydrogel system had become compact and dense. Incidentally, the value of the exponent m≈ 2±0.2. Secondly, we found that with increase in DNA concentration (1 to 3%), the correlation length, ξ increased from 0.50 to 3.3nm. It can be inferred that as DNA concentration increased there was formation of network structures due to physical entanglement of DNA strands, which was predominant at higher DNA concentrations. This corresponded to dominant scattering arising from these structures. This behavior is depicted in Figure 8, which, in addition, defines the overlap concentration c*. Based on the SANS data, a schematic sol-gel phase diagram can be constructed which is shown in Figure 9. In the sol state, the mean inter strand distance was d0 = 16±1 nm, Rg =40±2 nm and correlation length (distance of minimum approach) ξ= 0.5±0.04 nm. These values changed to d0 = 10.0±1.0 nm and ξ=3.3±0.4 nm at the highest concentration used in this study. Thus, it was clearly seen that the self-assembly leading to the gelation involved at least five length scales. The other three parameters showed strong concentration dependence.

Figure 7 Correlation between I (q) versus q obtained from SANS measurement for high q regime performed on different DNA concentrations at room temperature. Note the red-shift of q0 (arrows).
It was found that self-assembly of DNA strands precedes gelation transition. It was possible to extract micro-structural information about DNA strands with SANS measurement. The structure factor profile, I(q) vs q data, was divided into three different q-regions and were treated with specific fitting functions:
The crossover between regions between (i) and (ii) and between (ii) and (iii) designated as q* and q** defined two other length scales, (=50 nm independent of concentration) and (= 26 to22 nm decreasing with increase in DNA concentration). From statistical analysis of the structure factor data, we obtained the radius of gyration value, Rg≈ 40±3nm. Assuming, the strands to be rod-like, the length of the strands L can be determined from, which gives L»140 nm which is quite realistic. In the high-q region a broad correlation peak was detected and the broad peak fitting analysis yielded correlation length, ξ increasing from 0.50nm to 3.30nm and the inter strand spacingd0 decreasing from 15.6 to 9.8 nm as DNA content was increased from 1% to 3%. A clear overlap concentration c* = 2% (w/v) was found. DNA hydrogel was found to be consisting of hierarchy of structures with well-defined length scales that contribute uniquely to the scattering process. In summary; it has been shown that hierarchical structure of DNA hydrogels is replete with several self-organized assemblies, whose spatial extension is dependent on the biopolymer concentration.
PKP acknowledges University Grants Commission, Government of India for a Junior Research Fellowship. KR is very thankful to Department of Science and Technology, Government of India-Inspire Faculty Award. This work was supported by the Department of Science and Technology (DST), India.
The author declares no conflict of interest.

©2017 Pandey, et al. This is an open access article distributed under the terms of the, which permits unrestricted use, distribution, and build upon your work non-commercially.