Journal of
eISSN: 2572-8466


Research Article Volume 6 Issue 2
Department of Biomedical Engineering, Florida International University, USA
Correspondence: MC Christie, Biomaterials and Cardiovascular Mechanics Laboratory, Department of Biomedical Engineering, Florida International University, 10555 West Flagler Street, EC 2690Miami, Florida 33174, USA, Tel 305.348.7392, Fax 305.348.6954
Received: March 13, 2018 | Published: March 15, 2019
Citation: Christie MC, Salinas MM. Performance study of inferior vena cava filters. J Appl Biotechnol Bioeng. 2019;6(2):78-93. DOI: 10.15406/jabb.2019.06.00178
We examine the hemodynamic behavior of flow fields neighboring three different inferior vena cava filter (IVCF) designs. Trap–Ease®design, a Vena Tech® design, and Greenfield® design, respectively, in order to determine their performances under varying conditions of occlusion size, pressure, and blood viscosity. CFD–GEOM® was used to create the trap–ease®, the Vena–tech®, and the Greenfield® (Greenfield®) filters as unoccluded and partly occluded with a virtual volume of entrapped thrombi. The Trap–ease® was modeled as unconcluded, 40% upper protection occluded, 40% lower protection occluded, and both sides 40 % occluded each. For the Vena–tech® and Greenfield® models were created for unconcluded, 25% occluded, 50 % occluded and 80% occluded. The geometries were created inside a fluid volume and were surrounded by another geometry representing the wall vessel domain; through CFD–ACE+® each mesh domain contains physiologically valid dimensions and parameters obtained from literature. Simulations were performed for normal, pre–hypertensive, hypertensive pressures as well as for diabetes, sickle cell disease, and leukemia blood viscosities. The unconcluded filters were shown to have a minute effect on the blood flow. In the cases of the slightly occluded filters, results reveal that blood flow velocity increases along the sides of the trapped thrombus. In the mildly occluded filters, blood velocity profiles around the periphery of the clot increases considerably, and there exists pro–thrombotic regions distal to the occlusions due to blood stagnation. The same basic scenarios occur in the flow field with the highly occluded filters but with greater magnitude of events. The Vena–tech® shows higher shear stresses than the Greenfield® when it is highly occluded. Higher viscosities increase stagnation zones but are countered by higher pressure as in pre–hypertension and hypertension. IVCFs with unoccluded baskets were shown to create no significant disturbance on the blood flow. Filters show small, but significant, stagnation zones with occlusions of low volume, and these stagnation zones increased as the entrapment size increased. Hypercoagulability states such as diabetes, sickle cell and leukemia slightly increase the size of stagnation zones due to an overall reduction in the velocity of flow. On the contrary, pre–hypertensive and hypertensive conditions reduce the size of region of stagnation by increasing flow velocity. Excessive vessel exposure to highly occluded filters increases the risk of damage to the vessel wall and increases the risk of filter migration.
Keywords: thrombosis, hypertension, embolism, hypercoagulability, inferior vena cava filters, diabetes, sickle cell anemia, implanted cardiovascular device, vascular device performance
Pulmonary embolism is one of the major causes of hospitalization and death in the United States. Conventional treatments for embolisms include anti–coagulant drugs such as Warfarin® or Heparin® anti–thrombotics such as Streptokinase® bypass surgery, and thromboaspiration.12,13,16 In cases where the patient shows contraindication to anticoagulation, failure of anticoagulation, complication to anticoagulation, or large clotting occurs, the patient usually receives an inferior vena cava filter (IVCF).2,11,16
An IVCF is a device that is implanted in the inferior vena cava to prevent PE and other types of thrombosis such as iliocaval or renal thrombosis.7,17,26 IVCFs are inserted via a catheter through either the femoral vein, internal jugular vein. The filter is placed inside the vena cava through the use of a catheter, which is guided into the inferior vena cava using fluoroscopic guidance; then, it is deployed in its desired location.25,28 IVCFs are a last resort type of clinical procedure. There are many IVCFs with no real chief among them; while some of them have proven to be closed to effective, there are still factors of concerned that have not been address properly due to lack of clinical documentation.19,21 Success of IVCFs is difficult to interpret because of varying indications, follow– up lengths, patient treatment, methods of reporting, and a lack of control and comparative data.16, 21
One of the major issues of partially occluded IVCFs is the formation stagnation zones. These zones get larger with increasing occlusion size3 and can allow the formation of thrombi which can then travel straight to the left ventricle and into the lungs resulting in a pulmonary embolism. The hemodynamic effects around an IVCF play a vital role in determining its aptitude to continue with its patency, there have been filters that have been removed from the market due to serious hemodynamic disturbances that have led, in the worst cases, to filter migration.11,16 Some studies suggest that the Trap–Ease® filter (Figure 1) is safer because it has two degrees of protection and has performed well on clinical trials.19,21 Made by Cordis®, this filter is laser cut entirely out of nitinol. It has a trapezoidal two layer basket shape design, and is classified as a level two device. The baskets are interconnected by six struts, and is 65mm in length (before deployment), and 50mm (after deployment). Diameters of the filter vary from 18mm–30mm.19
The Vena–tech® filter (Figure 2) is an average performance IVCF with one degree of protection.21 It was designed and created by B. Braun Medical® and is made of phynox, a non–ferromagnetic alloy with optimal imaging compatibility. It has a conical design with an open basket with six struts attached.11,16 The Greenfield filter® (Figure 3), which was developed by Boston Scientific® in 1994, has been considered the gold standard during many years.17,25 Ironically, it is presently believed to be one of the worse filters available for inferior vena cava implants.21 The Greenfield® filter design is a 12 French (F) stainless steel over the wire conical design. It is made of 316L grade stainless steel. It maintains its shape through the six radiating legs that cross back and forth across the struts of the filter.25 The legs are welded to the apical center bead. The base diameter is 3.2cm, and the legs are 4.9cm. The filter is also preloaded differently depending upon its application. The Greenfield® filter is a level one filtering device7,8 because it has one degree of protection. There exists the need to observe the behavior of filters in patients suffering from pre–hypertension and hypertension as these conditions are on the rise and are responsible for severe damage to the cardiovascular system. Furthermore, hypercoagulability diseases such as diabetes, sickle cell disease and leukemia should also be linked to filter studies as these conditions are pre–thrombotic in nature. Diabetes mellitus viscosity increases due to elevated blood glucose levels. Patients suffering from diabetes are at a higher risk from suffering severe organ microcirculation problems in kidneys and eyes.24 Furthermore, they can develop cardiovascular complications of the magnitude of pulmonary embolism or stroke.15,24,29
The anomalous, rigid, sickle shape in red blood cells (RBCs) affected with SCD, decreases the cells flexibility and results in their restricted movement through blood vessels and overall increase in whole blood viscosity.24,26 Excessive agglomeration of these cells around or behind IVCFs occlusions could result in thrombus nucleation.1
Elevated count of white blood cells (WBCs), as seen in patients suffering from leukemia, results in an increase in whole blood viscosity. Several studies confirm the risk of embolization as viscosity increases. Leukemia has also been attributed with retinal hemorrhage, retinal vein thrombosis, myocardial infarction, acute limb ischemia, and renal vein thrombosis.20,22,23
This report will show simulations of blood flowing through implanted Trap–ease®, Vena–tech® and Greenfield® filters with unclouded and occluded scenarios. Using physiologic valid dimension and parameters, the conditions of pressure and viscosity have been varied, and the hemodynamic behavior modeled and observed in an effort to determine the underlying mechanisms by which blood flow is disturbed in the presence of IVCFs in order to predict future complications due to these disturbances.
Geometry description
In order to represent the inner lumen of the vessel, an X–Y plane 28 mm (D) circle was created with center (0,0), and it was extruded 150 mm in the Z–direction. This is the fluid domain and it was meshed with 0.842 size cells. The filter structure was created by revolving a point around the Z–plane and obtaining a 4 mm (D) circle. The circle was then extruded 5mm in the Z–direction and the structures were made hollow and closed. Six struts were created around the wall of the filter and extruded at a 30 degree angle with the Z–plane. Both geometries–the fluid and the filter domains– were intersected and trimmed in order to create a mesh representing the flow of blood when it passes through a vena cava filter. This is done so that there exists an interface between the filter and the vessel wall and it is necessary for CFD–ACE+® modeling. The filter was shelled and meshed with unstructured domain with tetrahedral 0.845 size cells. . In order to represent the wall vessel, an X–Y plane 32 mm (D) circle was created with center (0,0) and divided in half; then, two 2 mm (Thickness) four–sided surfaces were created and translated 150 mm towards the other end of the cylinder. This allows the vessel wall geometry to integrate the already created inner grid as part of its domain. Later, the wall vessel was meshed with tetrahedral cells of 1.2 sizes.
Valid physiological parameters have ben obtained from literature and incorporated to the model. Blood has a density () of 1060 Kg/m3 and 3.5 centi–Poise viscosity (). Vena cava filters are manufactured with stainless steel. While the vessel wall of veins shows similar mechanical properties to expanded poly–tetra–fluoro–ethylene (ePTFE) [] which has a density () of 1550 Kg/m3, elastic modulus (E) of 2700 MPa, 0.3 Poisson’s Ratio (Table 1).
ρ (Kg/m3) |
µ (centi-Poise) |
E (MPa) |
Poisson’s Ratio |
|
Blood |
- |
- |
||
Stainless steel |
80002 |
- |
||
ePTFE |
- |
Table 1 Physical and mechanical properties of the materials used in the simulation
Theory
Wall Shear Stress is defined as the stress which is applied parallel to the face of a wall and it is given by the following equation: , Where is the wall Shear Stress , µ is the viscosity, δυ = represents the change in velocity, and is the change in distance. The conservation equation states that the rate at which mass enters a system is equal to the rate at which mass leaves the system and it is represented by the equation given as , where ρ is the fluid density, t stands for time, µ represents the fluid velocity, and λ symbolizes gradient.
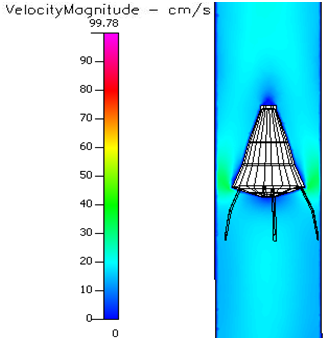
Figures for all unoccluded IVCFs show few flow disturbances and almost no stagnation zones. The blood flow velocity is slightly lower just behind the basket of the filter and the struts (Figures 4.1). Interestingly, unoccluded filters have lower stagnation zones when accompanied by higher pressures as in the case of pre–hypertension and hypertension (Figure 4.1–4.2). In a Trap–ease occluded 40 % at the downstream basket, stagnation zones exist right behind the occlusion of entrapped emboli (Figure 4.3). Conditions such as diabetes, sickle cell and leukemia significantly decrease the flow velocity round the occlusion, and it causes slightly larger stagnation regions (Figure 4.3–4.6). However, these conditions, in the presence of pre–hypertension (Figure 4.7–4.10) and hypertension (Figure 4.11–4.14), do show smaller stagnation zones than normal pressure. Same events happen with a 40 % occluded Trap–ease at the upstream basket where the occlusion happens between the struts and the vessel wall (Figure 4.14–4.18).
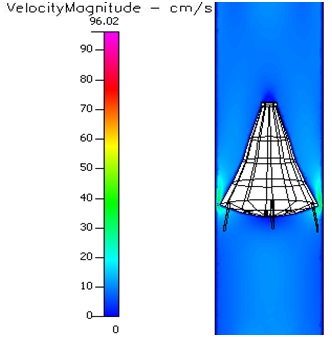
In the Vena–tech with 50 % occlusion, stagnation zones exist right behind and on the sides of the virtual emboli (Figure 4.19–4.22). Blood velocity travels around the solid body at higher velocity than normal flow. Conditions such as diabetes, sickle cell and leukemia significantly decrease the flow velocity round the occlusion, and it causes slightly larger stagnation regions (Figure 4.22–25). However, these conditions, in the presence of pre–hypertension (Figure 4.26–4.29) and hypertension (Figure 4.30–4.33), do show smaller stagnation zones than normal pressure and flow velocity also increases. Same events happen In the Vena–tech with 80 % occlusion, but with higher magnitude of events (Figure 4.33–4.47). Stagnation zones are much larger, and flow itself shows very low velocity even before the occlusion. Annular velocity is much lower than the 50% occlude filter, even during hypertensive conditions.

Figure 4.28 Velocity profile of a 50% occluded Vena tech® filter in pre-hypertension and sickle cell.

Figure 4.40 Velocity profile of a 80% occluded Vena-tech® filter in pre-hypertension and sickle cell.
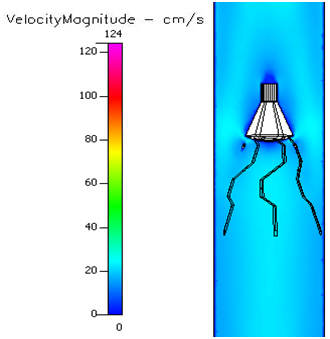
In the 25% occluded Greenfield® filters (Figure 4.48), greater velocities were observed at the sides of the occlusion and a small region of stagnation flow was created just behind the trapped emboli. Blood velocity flows around the body without major disturbances. Slightly larger stagnation regions are seen in diabetes, sickle cell and leukemia (Figure 4.49–4.51). Pre–hypertension (Figure 4.52–4.56) and hypertension (Figure 4.57–4.60) show to mitigate some hypercoagulability conditions by creating smaller stagnation zones. In the 50% occluded Greenfield® filter (Figure 4.60). flow disturbances are evidenced by greater annular velocity around the occlusion. Flow velocity increases with higher pressure. In the 80% occluded Greenfield® filter (Figure 4.61–4.73) the area reduction created by the massive object creates a flow separation zone where blood rushes annularly around it, and some blood flows very slow after the occlusion.

Figure 4.54 Velocity profile of a 25% occluded Greenfield® filter in pre-hypertension and sickle cell.
IVCFs with unoccluded baskets were seen to create no significant disturbance on the blood flow. Filters show small, but significant, stagnation zones with occlusions of low volume, and these stagnation zones get bigger as the entrapment gets larger. Also, in filter with small occlusions, blood flows calmly around the filter even in the presence of pre–hypertension and hypertension. On the other hand, large obstructions create fast annular velocity profiles which can result in higher shear stresses exerted on the vessel wall and could eventually lead to the development of vessel atrophy. Hypercoagulability states such as diabetes, sickle cell and leukemia slightly increase the size of stagnation zones due to an overall reduction in the velocity of flow. On the contrary, pre–hypertensive and hypertensive conditions reduce the size of region of stagnation by increasing flow velocity. Results suggest that in a hypothetical patient who has an implanted vena cava filter with high degree of occlusion, anticoagulant therapy is critical as in a highly occluded Vena Tech®. The criticality is magnified if this patient also suffers from a hypercoagulability disorder. This study also illuminates the need for monitoring the degree of occlusion patients who are currently have had implanted IVFs for an extended period of time. Care of such patients should include periodic measurements of occlusions in order to avoid scenarios of high degree of occlusion, since long term and excessive vessel exposure to highly occluded filters increases the risk of damage to the vessel wall. This scenario will result in implant instability in the flow field which may result in filter migration and compromised filter performance.
None.
The author declares there are no conflicts of interest.

©2019 Christie, et al. This is an open access article distributed under the terms of the, which permits unrestricted use, distribution, and build upon your work non-commercially.